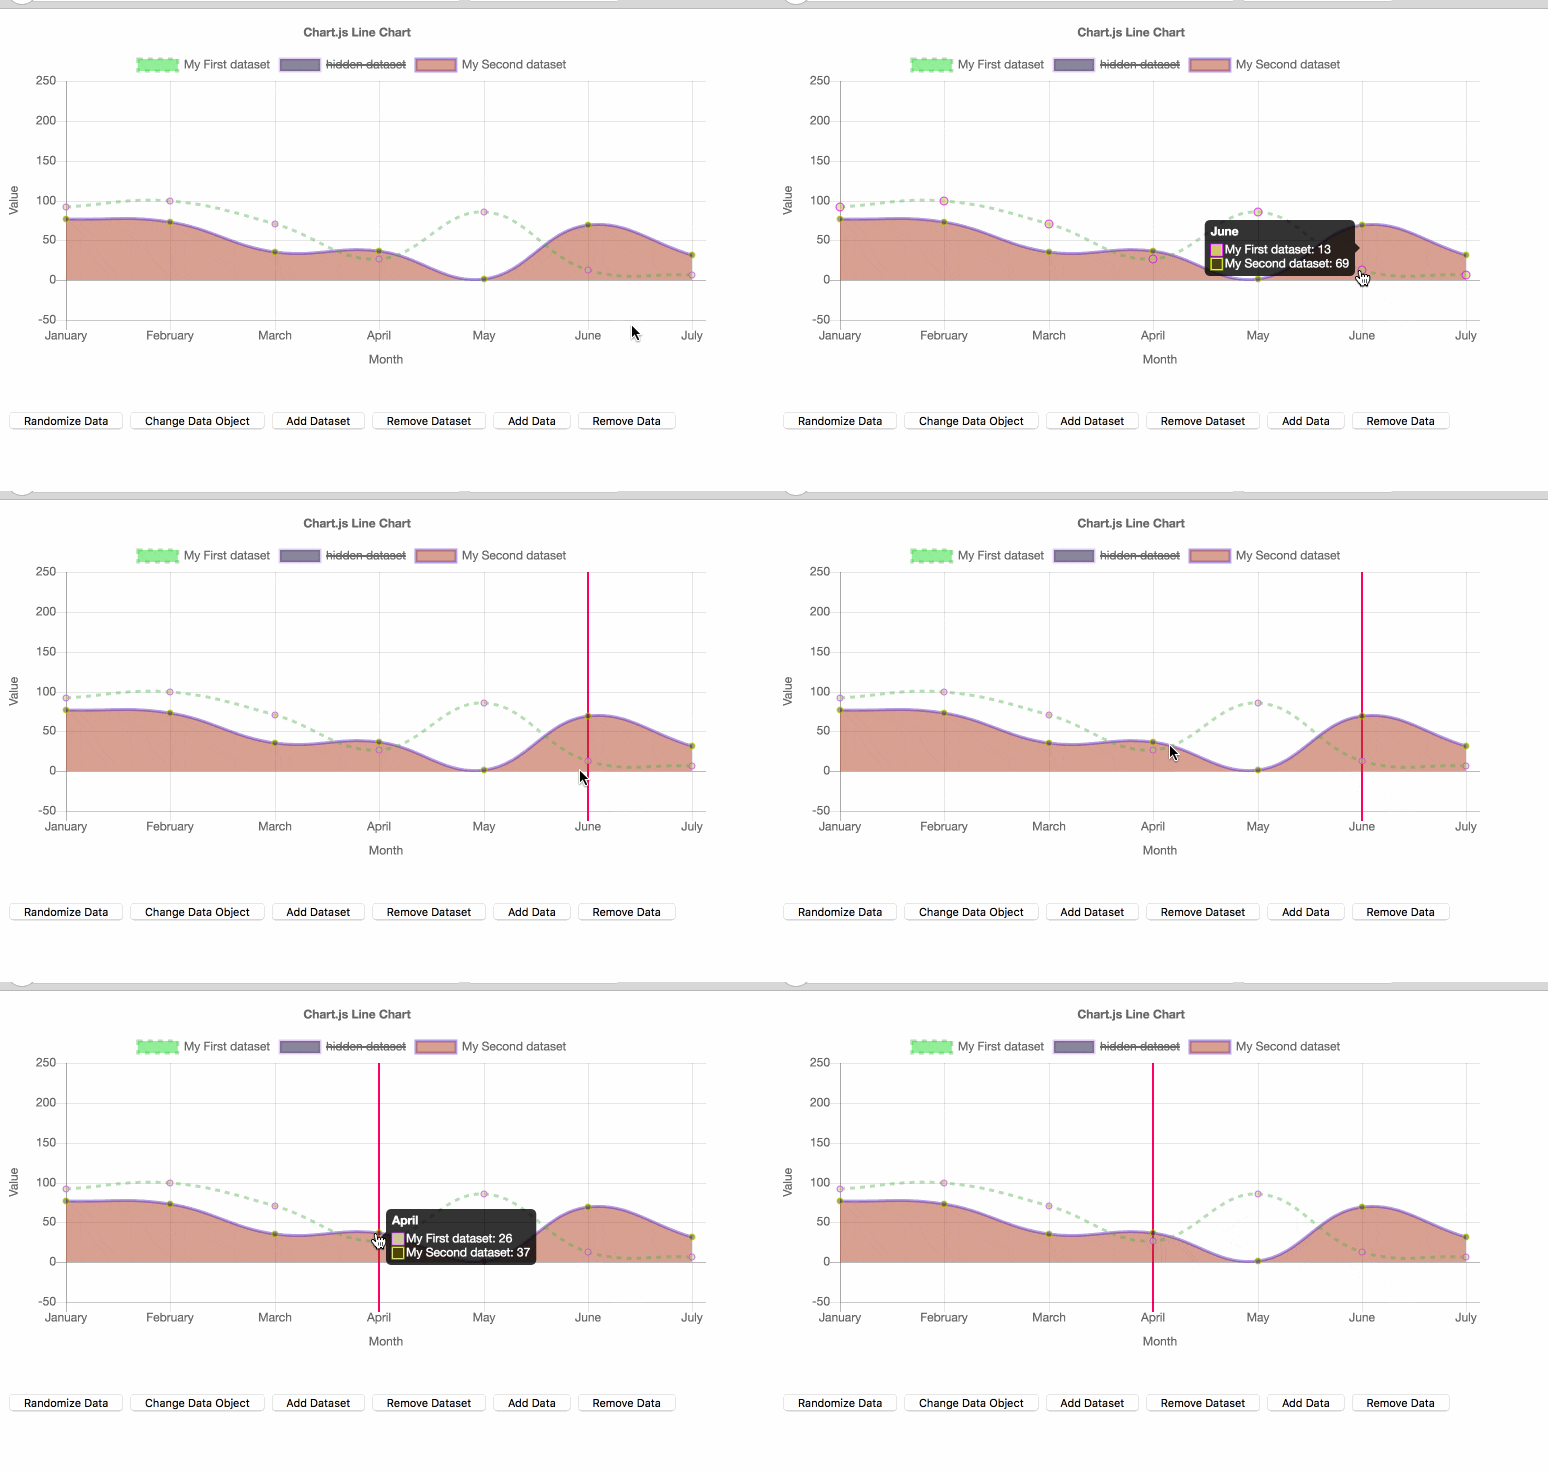
これ何
この度Chart.jsをv2に移行しました。
それまではChart.jsの線グラフに選択機能をつける - Qiitaを参考に線グラフをクリックした際に、その軸を強調表示するような処理をカスタマイズで勝手に入れ込んでいましたが、v2移行にあたり修正箇所も変わっているのでそれを書き留めておきます。
※2016/06/29時点での最新版となるv2.1.6に移行し、そのChart.jsを対象として各修正を行っています。
修正箇所
手短に直接Chart.jsをいじった場合の箇所のみ示していきます。
repositoryをcloneして修正してbuild〜とかはお好みでどうぞ。
デフォルト値の追加
デフォルトでは今回追加する強調表示機能を無効な状態にします。
@@ -6564,6 +6564,9 @@ module.exports = function(Chart) {
        tickMarkLength: 10,
        zeroLineWidth: 1,
        zeroLineColor: "rgba(0,0,0,0.25)",
+       highlightVerticalLine: false, // 強調表示を行うか否かのフラグ
+       highlightLineColor: "rgba(255,0,102,1)", // 強調表示時の線の色
+       highlightLineWidth: 2, // 強調表示時の線の太さ
        offsetGridLines: false
      },
機能を有効にする際はnew Chart()時optionsに適宜パラメーターを渡します。
options: {
  ...
  scales: {
    xAxes: [{
      gridLines: {
        highlightVerticalLine: true
      }
    }]
  },
  ...
}
軸のlabelが多い場合skipされてしまうので対処
以降2つは描画対象となるitemをループでがーーーっと組み立てているあたりに編集を行います。
Chart.jsはかしこくて、あまりに軸項目数が多いとskipしてくれちゃいます。
もれなく強調表示したいgrid線までskipしちゃうので、描画対象となるよう条件をいじります。
@@ -7111,9 +7114,10 @@ module.exports = function(Chart) {

          var isLastTick = me.ticks.length === index + 1;

+         var isHighlightTick = gridLines.highlightVerticalLine && index === me.highlightIndex;
          // Since we always show the last tick,we need may need to hide the last shown one before
          var shouldSkip = (skipRatio > 1 && index % skipRatio > 0) || (index % skipRatio === 0 && index + skipRatio >= me.ticks.length);
-         if (shouldSkip && !isLastTick || (label === undefined || label === null)) {
+         if (shouldSkip && !isLastTick && !isHighlightTick || (label === undefined || label === null)) {
            return;
          }
強調表示
強調表示grid線の色と太さを指定します。
Chart.js的にはskip対象となるgrid線の場合(shouldSkipがtreueの場合)、元は描画されていないlabelが強調表示時だけ飛び出てきてかっこわるいので、labelに空文字を代入しています。
@@ -7122,7 +7126,13 @@ module.exports = function(Chart) {
            // Draw the first index specially
            lineWidth = gridLines.zeroLineWidth;
            lineColor = gridLines.zeroLineColor;
-         } else  {
+         } else if (isHighlightTick) {
+           if (shouldSkip) {
+             label = '';
+           }
+           lineWidth = gridLines.highlightLineWidth;
+           lineColor = gridLines.highlightLineColor;
+         } else {
            lineWidth = helpers.getValueAtIndexOrDefault(gridLines.lineWidth, index);
            lineColor = helpers.getValueAtIndexOrDefault(gridLines.color, index);
          }
Sample
Chart.js/samples/line.htmlにて例を示します
強調表示機能が有効となる様フラグを渡す。
色や太さを変えたい場合はhighlightVerticalLineと同じ深さで適当に設定してください。
@@ -99,6 +99,9 @@
                         scaleLabel: {
                             display: true,
                             labelString: 'Month'
+                        },
+                        gridLines: {
+                          highlightVerticalLine: true
                         }
                     }],
                     yAxes: [{
リスナの設定 - mouseover&onclick
@@ -127,6 +130,32 @@
         window.onload = function() {
             var ctx = document.getElementById("canvas").getContext("2d");
             window.myLine = new Chart(ctx, config);
+
+            var chartElm = document.getElementById("canvas");
+
+            // point上ではクリックできる風にcursor = 'pointer';
+            chartElm.onmousemove = function(evt) {
+              if (window.myLine.getElementsAtEvent(evt).length > 0) {
+                chartElm.style.cursor = 'pointer';
+              } else {
+                chartElm.style.cursor = 'default';
+              }
+            }
+
+            chartElm.onclick = function(evt) {
+              console.log(evt);
+              // クリックした要素達を取得
+              var activePoints = window.myLine.getElementsAtEvent(evt);
+
+              // なければ撤退
+              if(activePoints.length <= 0) {
+                return;
+              }
+
+              // hilightIndexに渡して縦線を引く
+              window.myLine.scales['x-axis-0'].highlightIndex = activePoints[0]._index;
+              // update()忘れず
+              window.myLine.update();
+            }
         };

         $('#randomizeData').click(function() {
こうなる
お疲れ様でした。
まだまだjs力弱いのでマサカリ授かりたく、宜しくお願い致します。
