要約
- v1ではグラフ毎にイベントからデータへ変換するメソッドが異なる
- v2では、すべてのグラフで
getElementAtEventかgetElementsAtEventに統一された
背景
Chart.jsはv2で大きな変更があります。
公式なmigration支援ドキュメントはありません。
Issueはありますが、あまり手が回っていないようです
グラフの作り方の変更点はv1.0 からの変更点を見てください。
グラフのイベント処理にも変更があります。
この記事ではイベント処理の変更点を整理します。
Chart.jsでのクリックイベントの取り扱い
Chart.jsはCanvasを使ってグラフを描画します。
Canvasは、要素にイベントハンドラーを設定することはできません。
Chart.jsは、Canvasのイベントハンドラーのイベントオブジェクトをグラフの要素に変換するAPIを提供しています。
v1とv2では、変換APIが変わりました。
Cahrt.js v1
サンプルコード
<!doctype html>
<html>

<head>
    <title>Bar Chart</title>
    <script src="node_modules/chart.js/Chart.js"></script>
</head>

<body>
    <canvas id="canvas"></canvas>
    <script>
        const barChartData = {
            "labels": [
                "January",
                "February",
                "March",
                "April",
                "May",
                "June",
                "July"
            ],
            "datasets": [{
                "fillColor": "rgba(220,220,220,0.5)",
                "strokeColor": "rgba(220,220,220,0.8)",
                "highlightFill": "rgba(220,220,220,0.75)",
                "highlightStroke": "rgba(220,220,220,1)",
                "data": [
                    91,
                    77,
                    21,
                    60,
                    61,
                    59,
                    83
                ]
            }, {
                "fillColor": "rgba(151,187,205,0.5)",
                "strokeColor": "rgba(151,187,205,0.8)",
                "highlightFill": "rgba(151,187,205,0.75)",
                "highlightStroke": "rgba(151,187,205,1)",
                "data": [
                    8,
                    67,
                    96,
                    87,
                    77,
                    5,
                    7
                ]
            }]
        }

        const canvas = document.querySelector("#canvas")
        const ctx = canvas.getContext("2d")
        const chart = new Chart(ctx).Bar(barChartData)

        canvas.addEventListener('click', (e) => console.log(chart.getBarsAtEvent(e)))
    </script>
</body>

</html>
起動
npm init -y
npm install chart.js@1.1.1
v1.htmlをブラウザで開きます。
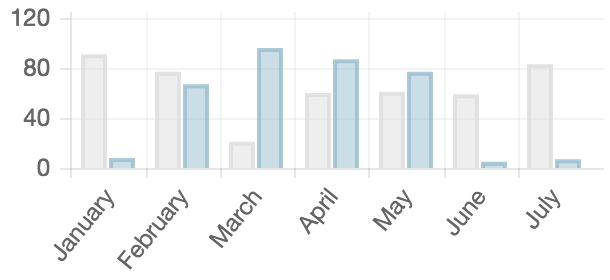
このようなグラフが表示されます。
クリックイベントの扱い
v1では、棒グラフの場合、getBarsAtEventを使って、MouseEventからクリックしたデータ(正確にはクリックした時にtooltipを表示しているデータ)を取得します。
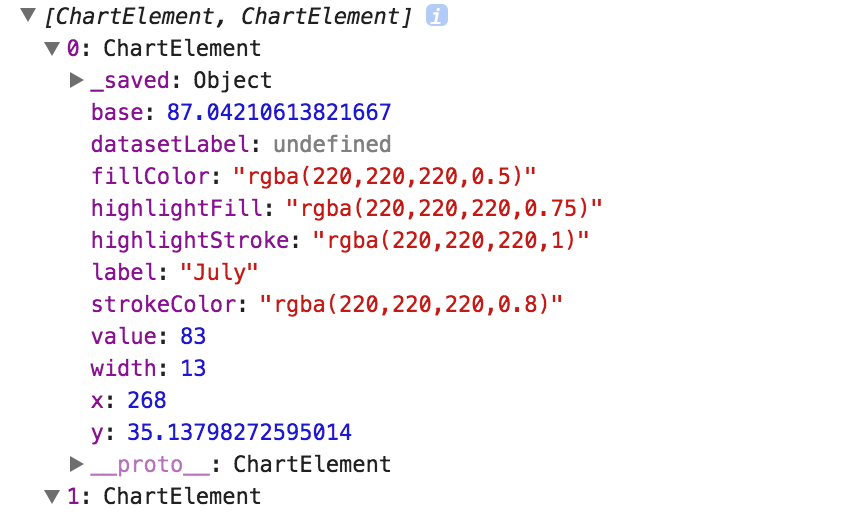
getBarsAtEventメソッドを使うと、次のようにChartElementの配列に変換されます。
1つのChartElementには次の情報が含まれます。
{
  "value": 83,
  "label": "July",
  "strokeColor": "rgba(220,220,220,1)",
  "fillColor": "rgba(220,220,220,0.75)",
  "highlightFill": "rgba(220,220,220,0.75)",
  "highlightStroke": "rgba(220,220,220,1)",
  "_saved": {
    "value": 83,
    "label": "July",
    "strokeColor": "rgba(220,220,220,0.8)",
    "fillColor": "rgba(220,220,220,0.5)",
    "highlightFill": "rgba(220,220,220,0.75)",
    "highlightStroke": "rgba(220,220,220,1)",
    "width": 13,
    "x": 268,
    "y": 87.04210613821667
  },
  "width": 13,
  "x": 268,
  "y": 35.13798272595014,
  "base": 87.04210613821667
}
valueとlabelを使えば、クリックした要素を取得できそうです。
Chart.js v2
サンプルコード
<!doctype html>
<html>

<head>
    <title>Bar Chart</title>
    <script src="node_modules/chart.js/dist/Chart.bundle.js"></script>
</head>

<body>
    <canvas id="canvas"></canvas>
    <script>
        const barChartData = {
            "labels": [
                "January",
                "February",
                "March",
                "April",
                "May",
                "June",
                "July"
            ],
            "datasets": [{
                "label": "Dataset 1",
                "backgroundColor": "rgba(220,220,220,0.5)",
                "data": [
                    3, -27, -46,
                    56, -87, -82,
                    86
                ]
            }, {
                "label": "Dataset 2",
                "backgroundColor": "rgba(151,187,205,0.5)",
                "data": [-88, -78,
                    74, -32,
                    35,
                    29,
                    62
                ]
            }]
        }

        const canvas = document.querySelector("#canvas")
        const ctx = canvas.getContext("2d")
        const chart = new Chart(ctx, {
            type: 'bar',
            data: barChartData
        })

        canvas.addEventListener('click', (e) => console.log(chart.getElementsAtEvent(e)))
    </script>
</body>

</html>
起動
npm init -y
npm install chart.js@latest
v2.htmlをブラウザで開きます。
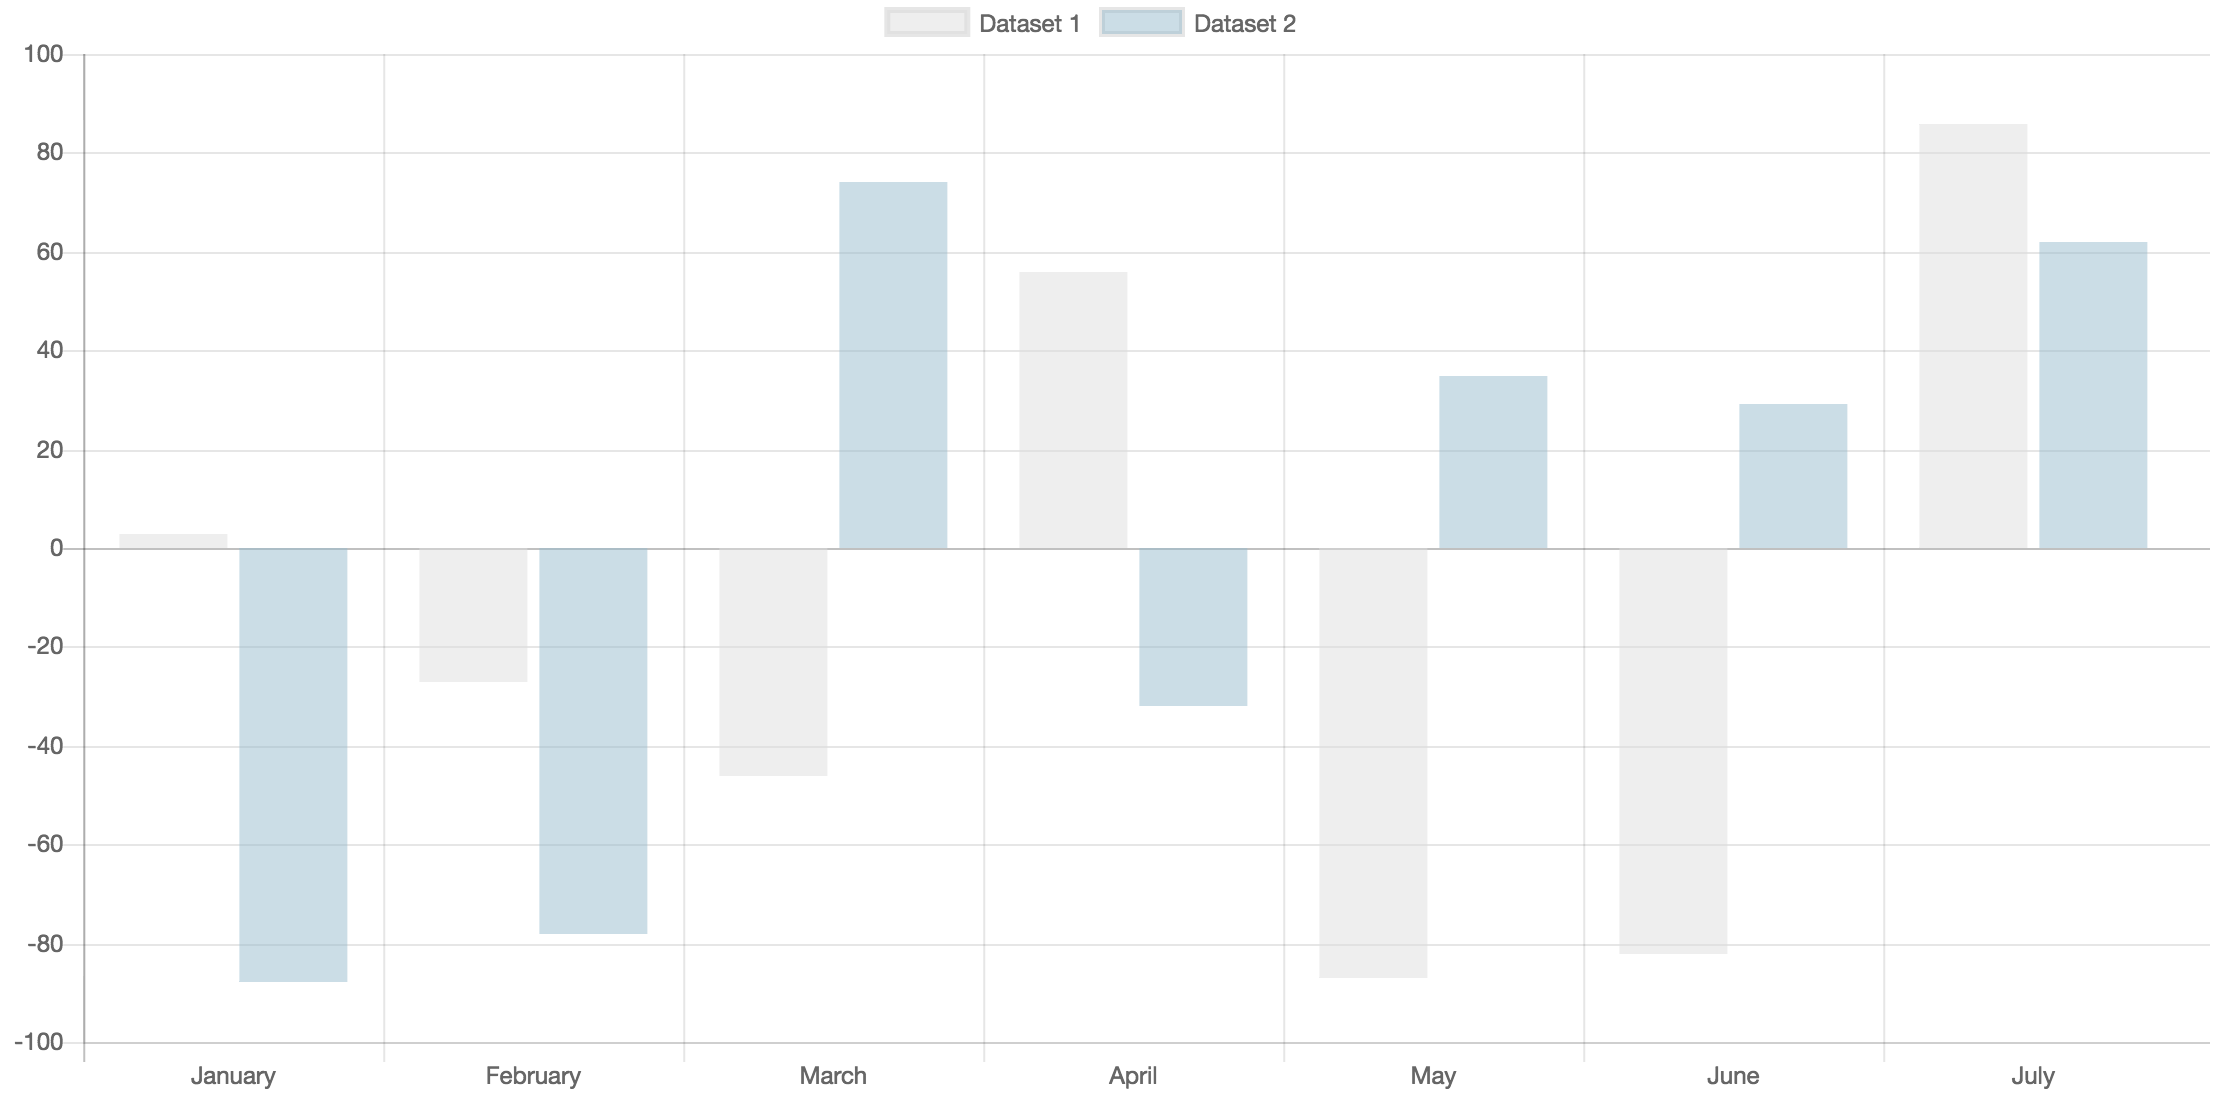
このようなグラフが表示されます。
クリックイベントの扱い
v2では、getElementsAtEventを使って、MouseEventからクリックしたデータを取得します。
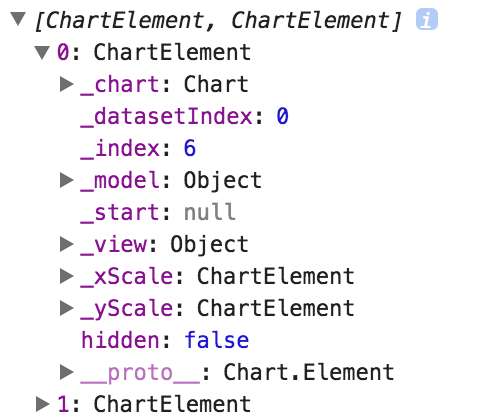
getElementsAtEvent メソッドを使うと、次のようにChartElementの配列に変換されます。
ChartElementに含まれる情報も変更されました。
{
  "_datasetIndex": 0,
  "_index": 6,
  "hidden": false,
  "_model": {
    "x": 989.6839904785156,
    "y": 67,
    "label": "July",
    "datasetLabel": "Dataset 1",
    "base": 279,
    "width": 54,
    "backgroundColor": "rgba(196, 196, 196, 0.5)",
    "borderSkipped": "bottom",
    "borderColor": "rgba(0, 0, 0, 0.1)",
    "borderWidth": 0
  },
  "_view": {
    "x": 989.6839904785156,
    "y": 67,
    "label": "July",
    "datasetLabel": "Dataset 1",
    "base": 279,
    "width": 54,
    "backgroundColor": "rgba(196, 196, 196, 0.5)",
    "borderSkipped": "bottom",
    "borderColor": "rgba(0, 0, 0, 0.1)",
    "borderWidth": 0
  },
  "_start": null
}
labelは_model配下に移動しています。
またvalueはなくなりました。
代わりに_datasetIndexと_indexがあります。元データから取得可能です。


