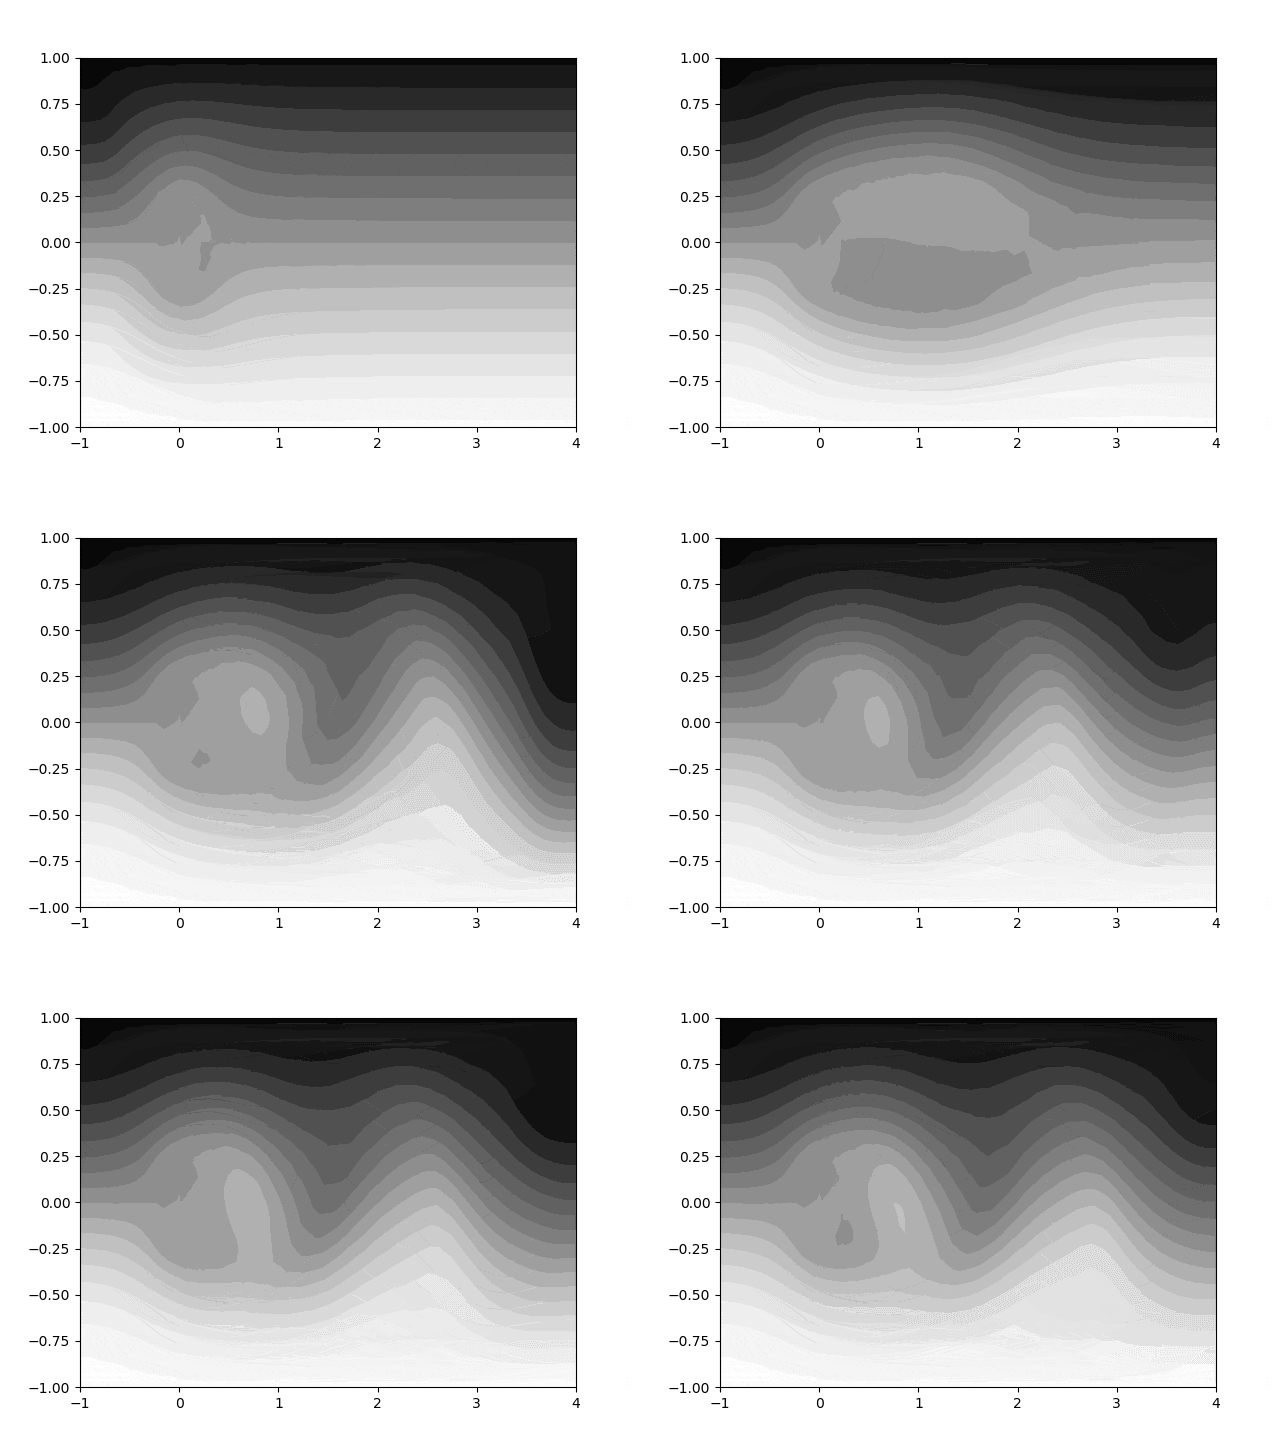
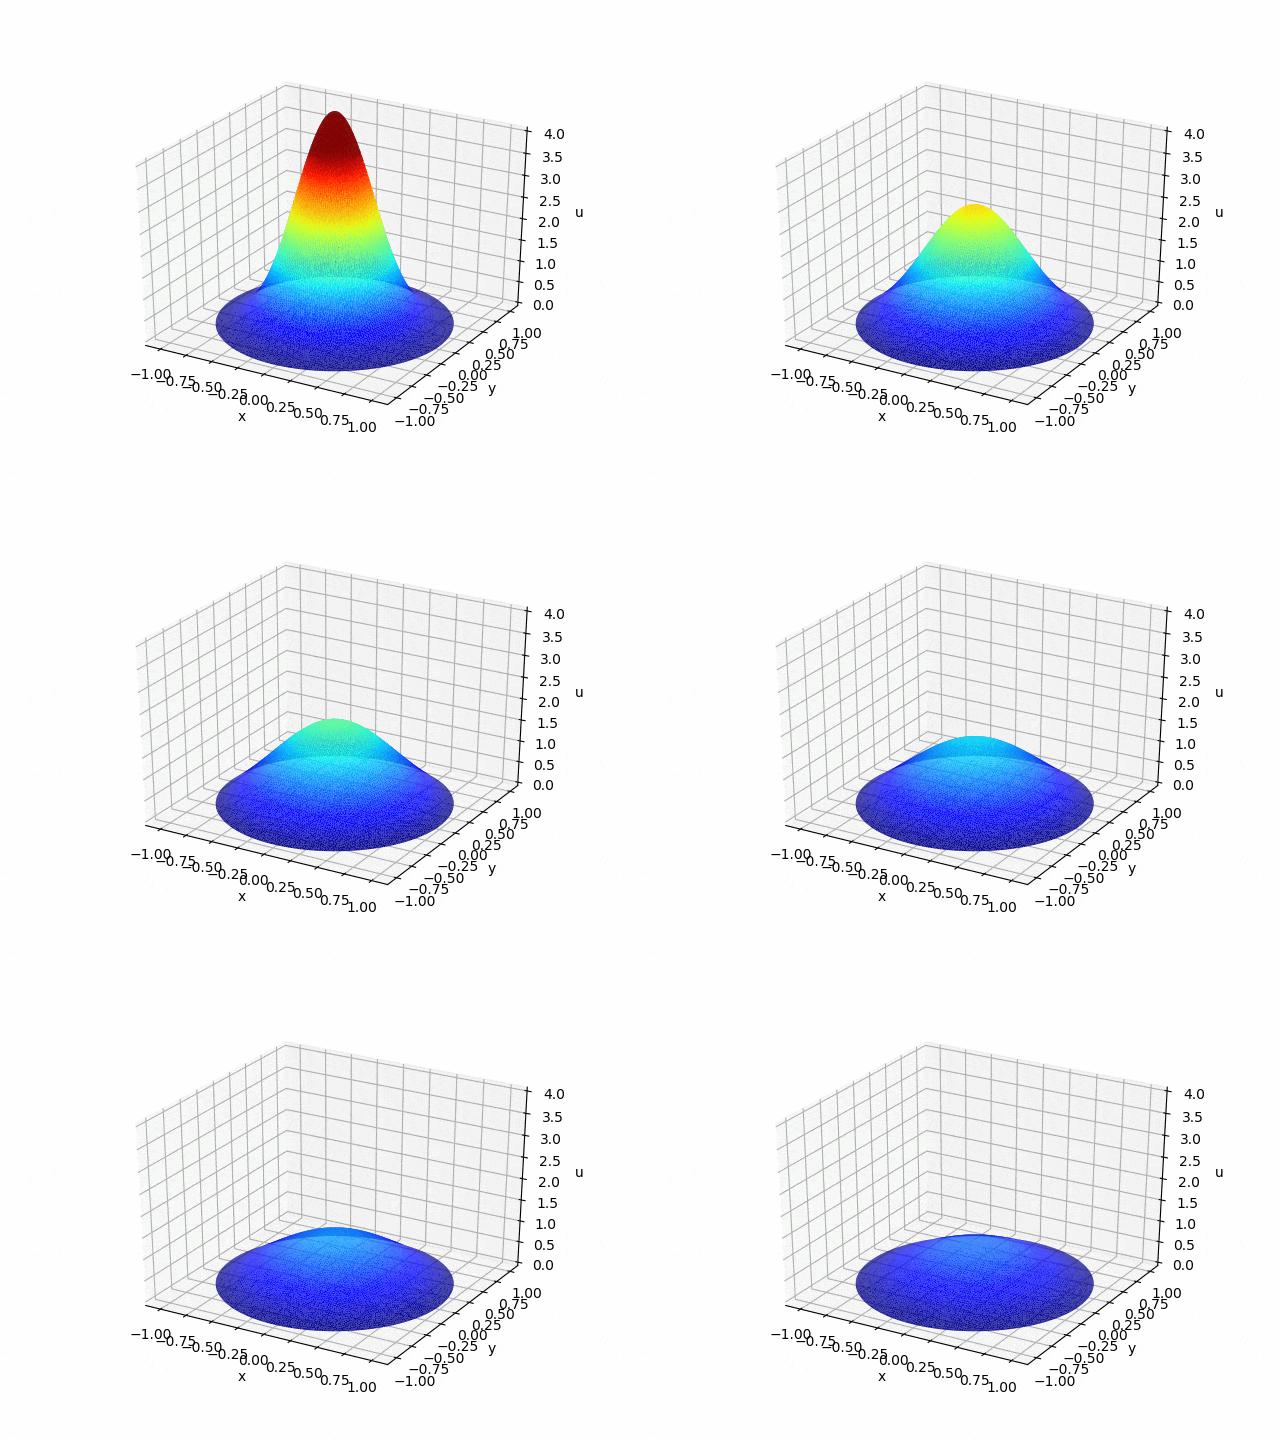
本記事では Windows を使っている人向けに、FreeFem++ という有限要素法を用いて偏微分方程式の数値計算を行うソフトウェアから計算結果を出力し、Python の matplotlib を用いて、物理的な時間発展現象を可視化する数学 gif を作ってみます。
いずれのソフトウェアも無料です。今回テーマとするのはカルマン渦列と熱拡散です。

左から流体が流れてきたとき、障害物の後方に渦の列が上下交互に現れているのがわかります。
こんな感じの数学 gif を作っていきましょう!
1. FreeFEM++とmatplotlibをインストールしよう!
この章では@t_kemmochiさんのFreeFem++の紹介と私による以前の記事Python を使ってお手軽に数学 gif を作ってみようの前半部分を参考にお願いします。
1.1 FreeFEM++を手に入れよう!
@t_kemmochiさんのFreeFem++の紹介にしたがって、FreeFEM++の公式サイトからFreeFEM++をダウンロード&インストールした上で、専用の総合環境であるFreeFem++-csをダウンロードしましょう。
Macの場合は上手く行かないことがあるようです。その場合は適当なエディダでコードを編集した後に、ターミナルから実行することでFreeFem++に計算させることになります。
1.2 matplotlib をインストールしよう!
未インストールの場合は Anaconda3 の導入から行ってください。例えば、
の前半部分を行えば大丈夫です(matplotlibのバージョンアップまで忘れずに行いましょう)
2 数値計算をして、計算結果を出力しよう!
数値計算のコードはプロが一般に公開しているものを流用させていただきます。
2.1 有限要素法によるカルマン渦列の数値計算をしよう!
大塚 厚二, 高石 武史. 「有限要素法で学ぶ現象と数理」のサポートサイトの第4章のサンプル(元は鈴木厚博士によるもの)をベースとしてカルマン渦列の数値計算をします。
matplotlib に読み込ませる csvファイルの生成は@t_kemmochiさんのFreeFem++の紹介による方法を用います。
後での可視化の都合上、流れ関数 $\varphi$ はP1要素に変更しておきます(P2での出力・可視化の仕方は調査中です…)。
以下のようなコードに変更した後、ファイルを実行すると連番のcsvファイルが出力されます。
macro grad(u) [dx(u),dy(u)] // EOM
macro div(u1,u2) (dx(u1)+dy(u2)) // EOM

int i=0;
real t=0;
real nu = 1.0/400.0;
real dt=0.1;        // time step
int imax=500;         // max iteration steps
int iplt0=imax/40;    // interval for plot
int iplt1=imax/10;    // interval for ps file
real alpha=1.0/dt;

//境界条件 滑無,滑り,流入,流出
int wall=1, slide=2, inflow=4, outflow=5;
border  ba(t=0,1.0){x=t*5.0-1.0;y=-1.0;label=slide;};  // 下
border  bb(t=0,1.0){x=4.0;y=2.0*t-1.0;label=outflow;};  // 右
border  bc(t=0,1.0){x=4.0-5.0*t;y=1.0;label=slide;};   // 上
border  bd(t=0,1.0){x=-1.0;y=1.0-2.0*t;label=inflow;};  // 左
border cc(t=0,2*pi){x=cos(t)*0.25;y=sin(t)*0.25;label=wall;};
mesh Th=buildmesh(ba(30)+bb(30)+bc(30)+bd(30)+cc(-30));

// P2/P1要素
fespace Vh(Th,[P2,P2]),Qh(Th,P1),Xh(Th,P1);

Vh [u1,u2],[v1,v2],[up1,up2];
Qh p,q;
Xh psi,phi,phii;

problem  NS([u1,u2,p], [v1,v2,q],solver=UMFPACK,init=i)
= int2d(Th)( alpha*(u1*v1 + u2*v2) + nu*(grad(u1)'*grad(v1) + grad(u2)'*grad(v2)) - p*div(v1,v2) - q*div(u1,u2) )
- int2d(Th)( alpha*(convect([up1,up2],-dt,up1)*v1 + convect([up1,up2],-dt,up2)*v2) )
+ on(slide,u2=0) // 壁境界 滑り
+ on(inflow,u1=1.0-y*y,u2=0) // 流入 $u_{1}=1-y^{2}$
+ on(wall,u1=0,u2=0);  // 壁境界 円柱 滑り無

phii = y-y*y*y/3.0;
problem streamlines(phi,psi,solver=Crout,init=i) = // from cavity.edp
  int2d(Th)(dx(phi)*dx(psi)+dy(phi)*dy(psi))
   - int2d(Th)((dx(u2)-dy(u1))*psi)
   + on(slide,phi=phii)
   + on(inflow,phi=phii)
   + on(wall,phi=0);

[u1,u2] = [0,0];  // 初期条件

for ( i = 1; i <= imax; i++) {
   t=dt*i;
   [up1,up2]=[u1,u2]; // $\vec{u}^{n-1}$の更新
   NS;  // $\vec{u}^{n},p^{n}$の計算
   streamlines; // 流線の計算
   if (i%50 == 0)
     plot(phi,cmm="Streamlines t="+t,nbiso=40);

   if (i%5 == 0){
   ofstream sol("csv/phi"+i/5+".csv");
    for(int j=0;j<Th.nv;j++)
    sol << Th(j).x << "," << Th(j).y << "," << phi[][j] << endl;
   }
}
ここで、ファイルを保存する際にはedpファイルが置かれているフォルダにあらかじめ csv というフォルダを作っておきましょう。
2.2 有限要素法による熱方程式の数値計算をしよう!
こちらでは齊藤宣一教授の個人サイトからサンプルプログラムを探しましょう。
その中から、Heat.edp を見つけ出し、以下のように出力の形式を整えます。
/*
Solving linear Heat equation
du/dt - \Delta u = 0       in 2d ball B(0,R),
u = 0                      on boundary |x| = R,
u(x,0) = 5*exp(5*(-x^2-y^2));
R = 1.0
*/

real h = 0.02, R = 1;
border C(t =0,2*pi){x=R*cos(t); y=R*sin(t);label=1;};

mesh Th = buildmesh(C(floor(2.*pi*R/h)));

fespace Vh(Th,P1);
real dt = 0.001, T = 0.2;

Vh uh, vh, uh0 = 5*exp(5*(-x^2-y^2));


problem Heat(uh,vh) = int2d(Th)(uh*vh/dt)
+ int2d(Th)(dx(uh)*dx(vh) + dy(uh)*dy(vh))
- int2d(Th)(uh0*vh/dt) + on(1, uh=0);

real t = 0; int k = 0;
for(t = dt;t<T+dt/2;t+=dt){
    cout<<"t="<<t;
    Heat;
    k++;
    if(k%2 == 0){
        ofstream sol("csv/uh"+k/2+".csv");
        for(int j=0;j<Th.nv;j++){
            sol << Th(j).x << "," << Th(j).y << "," << uh[][j] << endl;
        }
    }
    uh0 = uh;
}

ofstream tri("csv/Th.csv");
for(int i=0;i<Th.nt;i++){
    tri << Th[i][0] << "," << Th[i][1] << "," << Th[i][2] << endl;
}
こちらでも、ファイルを保存する際にはedpファイルが置かれているフォルダにあらかじめ csv というフォルダを作っておきましょう。
3 計算結果を jupyter に読み込ませて、数学 gif にしてみよう!
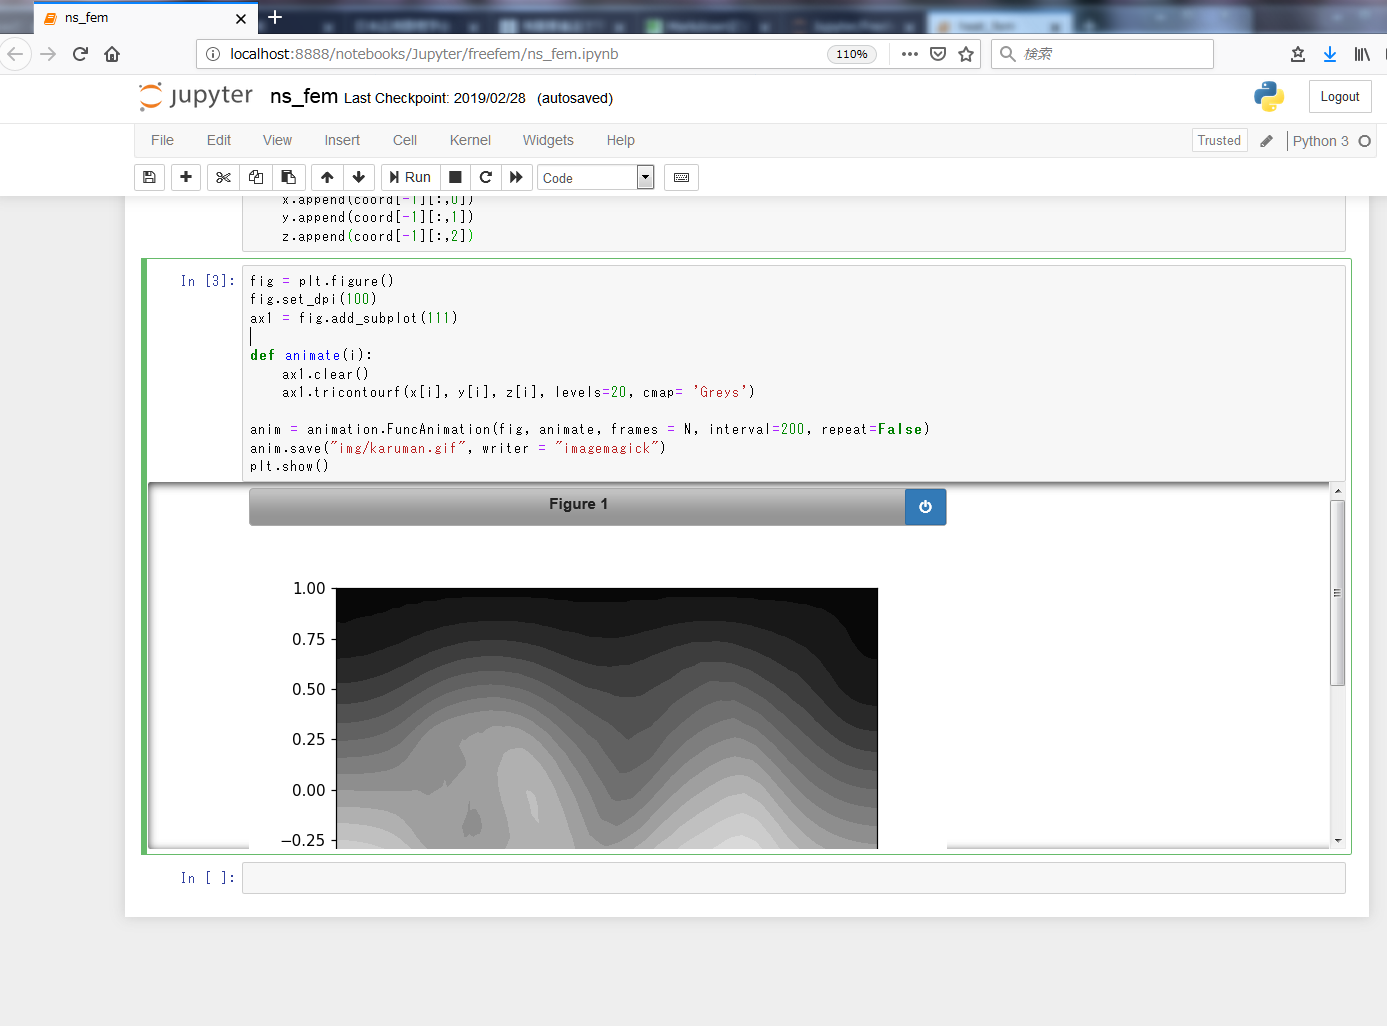
これで準備が整いました。jupyter notebook を起動して、次のようにしてライブラリの読み込み、csv の読み込み、グラフの出力を行います。
実行前に、作業中のフォルダにimgという名前のフォルダを作成しておきましょう。
%matplotlib nbagg
import numpy as np
import matplotlib.pyplot as plt
import matplotlib.animation as animation
import pandas as pd

coord = []
x = []
y = []
z = []

N = 100
for i in range(N):
    coord.append(pd.read_csv('csv/phi'+str(i+1)+".csv",header=None).values)
    x.append(coord[-1][:,0])
    y.append(coord[-1][:,1])
    z.append(coord[-1][:,2])

fig = plt.figure()
fig.set_dpi(100)
ax1 = fig.add_subplot(111)

def animate(i):
    ax1.clear()
    ax1.tricontourf(x[i], y[i], z[i], levels=20, cmap= 'Greys')

anim = animation.FuncAnimation(fig, animate, frames = N, interval=200, repeat=False)
anim.save("img/karuman.gif", writer = "imagemagick")
plt.show()
これでめでたくgifの出力と保存ができるようになりました
熱方程式についても、同様の方法でgifの作成をすることができます。
%matplotlib nbagg
import numpy as np
import matplotlib.pyplot as plt
import matplotlib.animation as animation
import matplotlib.tri as mtri
from mpl_toolkits.mplot3d import Axes3D
import pandas as pd

coord = []
x = []
y = []
z = []

N = 100
for i in range(N):
    coord.append(pd.read_csv('csv/uh'+str(i+1)+".csv",header=None).values)
    x.append(coord[-1][:,0])
    y.append(coord[-1][:,1])
    z.append(coord[-1][:,2])


tridata = pd.read_csv('csv/Th.csv',header=None).values
tri = mtri.Triangulation(x[0], y[0], triangles=tridata)

fig = plt.figure()
ax = fig.gca(projection='3d')

def animate(i):
    ax.clear()
    ax.set_zlim(-0.,4.)
    ax.plot_trisurf(tri, z[i], cmap = plt.cm.jet, vmin = 0, vmax = 4)
    ax.set_xlabel('x')
    ax.set_ylabel('y')
    ax.set_zlabel('u')

anim = animation.FuncAnimation(fig, animate, frames=N, interval=10, repeat = False)
anim.save("img/heat_fem.gif", writer = "imagemagick")
plt.show()

