機械学習の代表の一つにxgboost がある。予測精度はいいが、何をやっているか理解しにくい。xgboost の xgb.importance を使うとどのフィーチャーが一番影響力があったか分かるが、特定の予測結果をこのブラックボックスがなぜそのような予測に至ったか把握しにくい。
{xgboostExplainer} で予測結果を説明する
{xgboostExplainer} は xgboost の予測モデルを理解するのに役立つ。現在 Kaggle で行われているメルカリのデータを使って簡単にこのパッケージを試してみた。
library(xgboost)
library(xgboostExplainer)
library(data.table)

set.seed(123)

rmseEval=function(yTrain,yPred) {
  mseEval=sum((yTrain - yPred)^2)/length(yTrain)
  return(sqrt(mseEval)) }

df.train <- fread("data/train.tsv", stringsAsFactors = F,
                  colClasses = c(brand_name="character", category_name="factor",
                                item_condition_id="numeric", shipping="numeric"))
df.train <- df.train[,-c('train_id', 'name', 'item_description')]
df.train <- df.train[sample(.N)]
df.train$price =  with(df.train, ifelse(price > 0, log(price), price))
df.train[brand_name == "", brand_name:=-1]
df.train$brand_name <- as.factor(df.train$brand_name)

train <- df.train[1:1037774,]
test <- df.train[1037775:1482535,]

xgb.train.data <- xgb.DMatrix(data.matrix(train[,-"price"]), label=train$price,missing=NA)
xgb.test.data <- xgb.DMatrix(data.matrix(test[,-"price"]), label=test$price,missing=NA)

param <- list(boost='gbtree',objective='reg:linear',colsample_bytree=1,
             eta=0.12,max_depth=9,min_child_weight=1,alpha=0.3,
             lambda=0.4,gamma=0.2,subsample=0.8,seed=5,silent=TRUE)

xgb.model <- xgb.train(param =param,  data = xgb.train.data, nrounds=100, watchlist=list(train=xgb.train.data,
                                                                                       test=xgb.test.data))

xgb.preds.train = predict(xgb.model, xgb.DMatrix(data.matrix(train[,-"price"])))
xgb.preds.test = predict(xgb.model, xgb.DMatrix(data.matrix(test[,-"price"])))
結果は
rmseEval(train[,price], xgb.preds.train)
rmseEval(test[,price], xgb.preds.test)
# [1] 0.5903865
# [1] 0.5951557
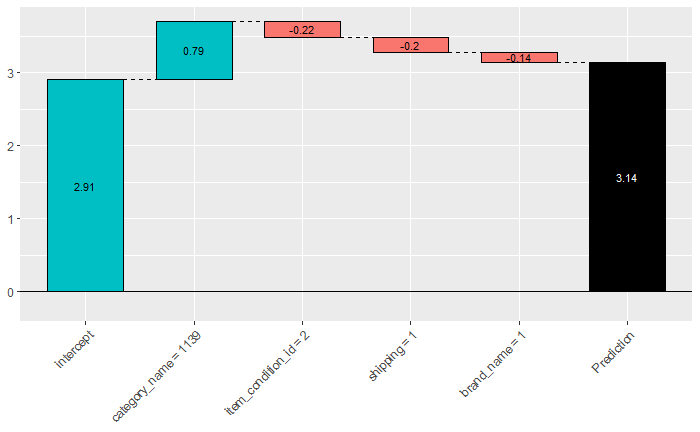
3.14という予測結果が出る。
これを xgboostExplainer で分析してみると:
explainer = buildExplainer(xgb.model,xgb.train.data, type="regression", n_first_tree = xgb.model$best_ntreelimit - 1)
pred.breakdown = explainPredictions(xgb.model, explainer, xgb.test.data)
showWaterfall(xgb.model, explainer, xgb.test.data, data.matrix(test[,-'price']) ,idx_to_get, type = "regression")

この1件に関してどのフィーチャーがどの程度貢献したか分かる。
さらに全件に対して分析してみると面白い傾向が発見できたりもする。
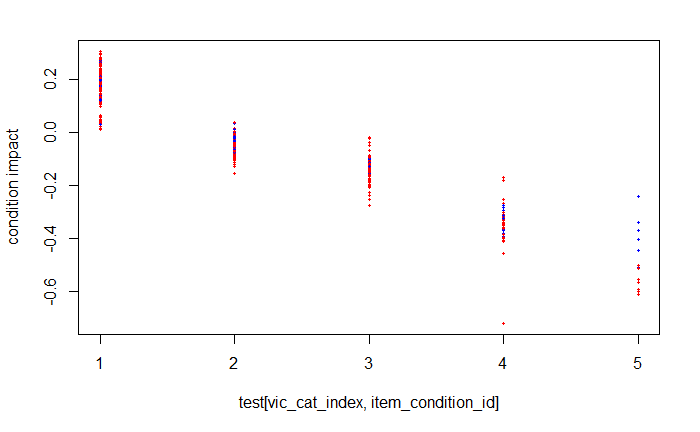
例えば LuLaRoe というカジュアルな服とVictoria's secret というブランドの価格と服の状態の関係をみてみるため、全件に関して状態別に価格の影響度をグラフ化してみると:

ここで、赤は Victoria's secret、青は LuLaRoe を表している。そして横軸は状態(数字が大きいほど悪い状態)を表している。グラフから分かる通りVictoria's secret は5(最悪)になると途端に値段がすごく下がる。反対にLuLaRoe は状態が悪くても値段がそんなに下がらなかったりする。ということは LuLaRoe で状態が悪くても高く売れるかもしれない?!
{xgboostExplainer} を使うとxgboost を使ってデータからいろんな発見が得られたり、モデルを改善するためのヒントがみつかりそうな気がする。
