はじめに
みなさんはじめまして。Qiita初投稿になります。
自身のスキルアップ・開発モチベーション維持を目的として、こちらにアウトプットを残していきたいと思います。
ひよっこエンジニアなりに頑張っていきます。
今回の目的
最近フロントエンドを触る機会があり、必要な知識の多さに目が回りそうになったので、少しでも知識をつけることを目的とします。
やることはタイトルにもあるように、TwitchでLeague of Legendsのタグをつけて配信している放送の総視聴者数をリアルタイムでグラフ化してみます。
使うもの
- React
- react-chartjs-2
- Twitch API
準備
Twitch API
まずは、Twitch APIを利用するために登録をします。
以下の記事を参考にさせていただきました。
クライアントIDがとれればOKです。
React
以下の記事を参考にさせていただきました。
ここで作ったひな形のアプリをこの後編集していきます。
あわせて、以下のものをこのタイミングでインストールしておきます。
npm install @material-ui/core
npm install -S react-router-dom
npm install --save react-chartjs-2 chart.js
コーディング
準備ができたので、いよいよ実装です。
[アプリ名]/srcにviewsフォルダを作り、そこに今回表示する画面を作っていきます。
ファイル名は、GameViewer.jsとでもしておきます。
import React from 'react';
import Button from '@material-ui/core/Button';

function GameViewer() {
  return (
    <div>
      <Button
        variant="contained"
        color="primary"
      >
        Get Game Viewer Data
      </Button>
    </div>
  );
}

export default GameViewer;
とりあえず、ボタンを付けました。
このボタンを押したらTwitchからデータ取得→グラフに反映を行うイメージです。
Twitch APIでデータ取得
import React from 'react';
import Button from '@material-ui/core/Button';

const clientID = '[Twitch API登録時に取得したクライアントID]'
const gameName = 'League of Legends';
var gameId = '';

function GameViewer() {
  // game_id取得
  const getGameId = async () => {
    let response = await fetch(
      `https://api.twitch.tv/helix/games?name=${gameName}`, {
        headers: {
          'Client-ID': clientId,
        }
      }
    );
    let json = await response.json();
    if(typeof json.data[0].id !== 'undefined'){
      gameId = json.data[0].id;
    }else{
      console.log('games get error');
    }
  }

  // 放送の情報取得
  const getLiveData = async () => {
    if(gameId === ''){
      await getGameId();
    }
    let response = await fetch(
      `https://api.twitch.tv/helix/streams?game_id=${gameId}&language=ja&first=100`, {
        headers: {
          'Client-ID': clientId,
        }
      }
    );
    let json = await response.json();
  }

  return (
    <div>
      <Button
        variant="contained"
        color="primary"
      >
        Get Game Viewer Data
      </Button>
    </div>
  );
}

export default GameViewer;
getGameId とgetLiveData を追加しました。
放送の情報を得るためには、game_idが必要になります。
そのためgetGameIdでゲーム名からgame_id取得後、getLiveDataでgame_idをもとに放送の情報取得しています。
※放送の情報取得では条件として、日本語の配信(language=ja)と視聴者数トップ100(first=100)もつけました。
グラフ化
import React from 'react';
import Button from '@material-ui/core/Button';
import { Line } from 'react-chartjs-2';

const clientId = '[Twitch API登録時に取得したクライアントID]';
const gameName = 'League of Legends';
var gameId = '';

function GameViewer() {
  const getGameId = async () => {
    let response = await fetch(
      `https://api.twitch.tv/helix/games?name=${gameName}`, {
        headers: {
          'Client-ID': clientId,
        }
      }
    );
    let json = await response.json();
    if(typeof json.data[0].id !== 'undefined'){
      gameId = json.data[0].id;
    }else{
      console.log('games get error');
    }
  }

  /* ここから先追加 */
  const [chartData, setChartData] = React.useState({
    labels: [],
    datasets: [
      {
        label: gameName,
        backgroundColor: backGroundColors[0],
        data: []
      }
    ]
  });
  /* ここまで追加 */
  const getLiveData = async () => {
    if(gameId === ''){
      await getGameId();
    }
    let response = await fetch(
      `https://api.twitch.tv/helix/streams?game_id=${gameId}&language=ja&first=100`, {
        headers: {
          'Client-ID': clientId,
        }
      }
    );
    let json = await response.json();
    /* ここから先追加 */
    if(typeof json.data[0].id !== 'undefined'){
      // 今回データの設定
      let currentTime = new Date();
      // y軸計算
      let totalViewer = 0;
      for(let i = 0; i < json.data.length; i++){
        totalViewer += json.data[i].viewer_count;
      }

      // グラフに設定
      let tmpLabels = chartData.labels;
      tmpLabels.push(currentTime.toLocaleTimeString());
      setChartData({
        labels: tmpLabels,
        datasets: [
          {
            label: gameName,
            backgroundColor: "rgba(255,0,0,0.7)",
            data: [...chartData.datasets[0].data, totalViewer]
          }
        ]
      });
    }else{
      console.log('streams get error');
    }
    /* ここからまで追加 */
  }

  /* ここから先追加 */
  const options = {
    scales: {
      yAxes: [
        {
          stacked: true
        }
      ]
    }
  };
  /* ここまで追加 */

  return (
    <div>
      <Button
        variant="contained"
        color="primary"
        onClick={function (){
          getLiveData();
          setInterval(getLiveData, 60000);
        }}
      >
        Get Game Viewer Data
      </Button>
      // グラフ
      <Line data={chartData}  options={options} />
    </div>
  );
}

export default GameViewer;
グラフデータを保持するstate(const [chartData, setChartData])、放送の情報取得後の処理、ボタンを押した際の動作、グラフを追加しました。
これで今回作るものは完成です。
最後に、App.js側でGameViewerを読み込むようにします。
(今後、他の画面も追加することを考えてこのようにしました)
import React from 'react';
import './App.css';
import { BrowserRouter, Route, Link} from 'react-router-dom';
import GameViewer from './views/GameViewer';

function App() {
  return (
    <BrowserRouter>
      <div>
        <li><Link to='/gameviewer'>Game Viewer</Link></li>
      </div>
      <div className="App">
        <Route path='/gameviewer' component={GameViewer} />
      </div>
    </BrowserRouter>
  );
}

export default App;
アプリ起動後、GameViewer→Get Game Viewer Dataボタンを押せば、毎分データ取得&グラフ描画が行われます。
npm start
しばらく放置後・・・
視聴者数の動きが見えていますね!
13時10分過ぎに視聴者数が一気に落ちていることから大手の配信が終わったことがわかります。
また、gameNameを変更することで他のゲームの情報でもグラフ化することができますので、お試しください。
さらにしばらく放置後・・・
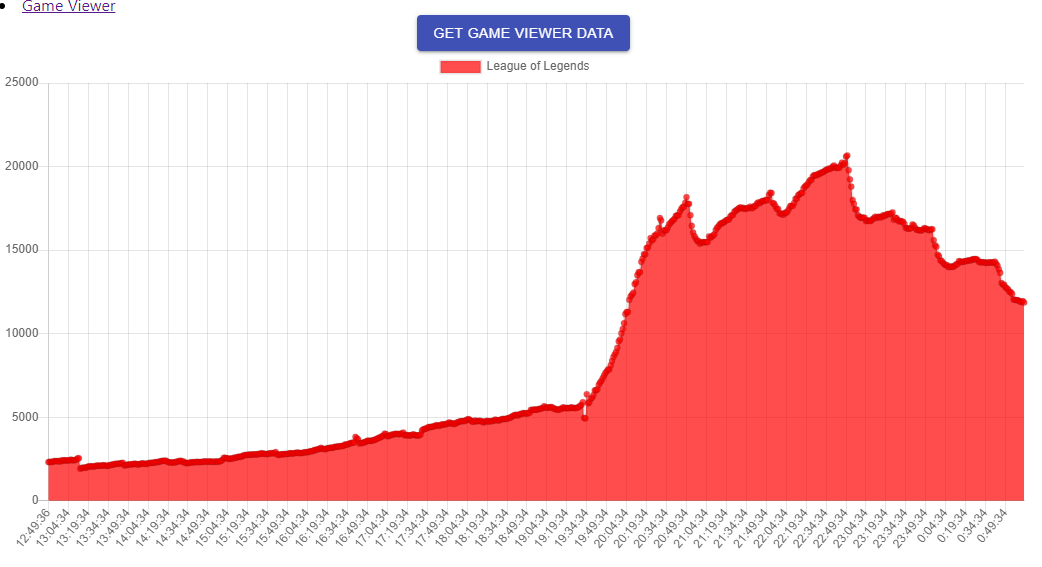
この日はWCSがあったので、開始にあわせて一気に視聴者数が増えていました。
おわりに
最後まで見ていただきありがとうございました。
細かい解説はかなり省いてしまいました。。。
コードの内容について、こう書いた方がよいなどコメントがあればいただけると嬉しいです。
ひとりごと
本当は、放送者毎の視聴者数を積み上げ面グラフで表示して、データ分析などをやってみたかったのですが、それはまた次回ということで。。。