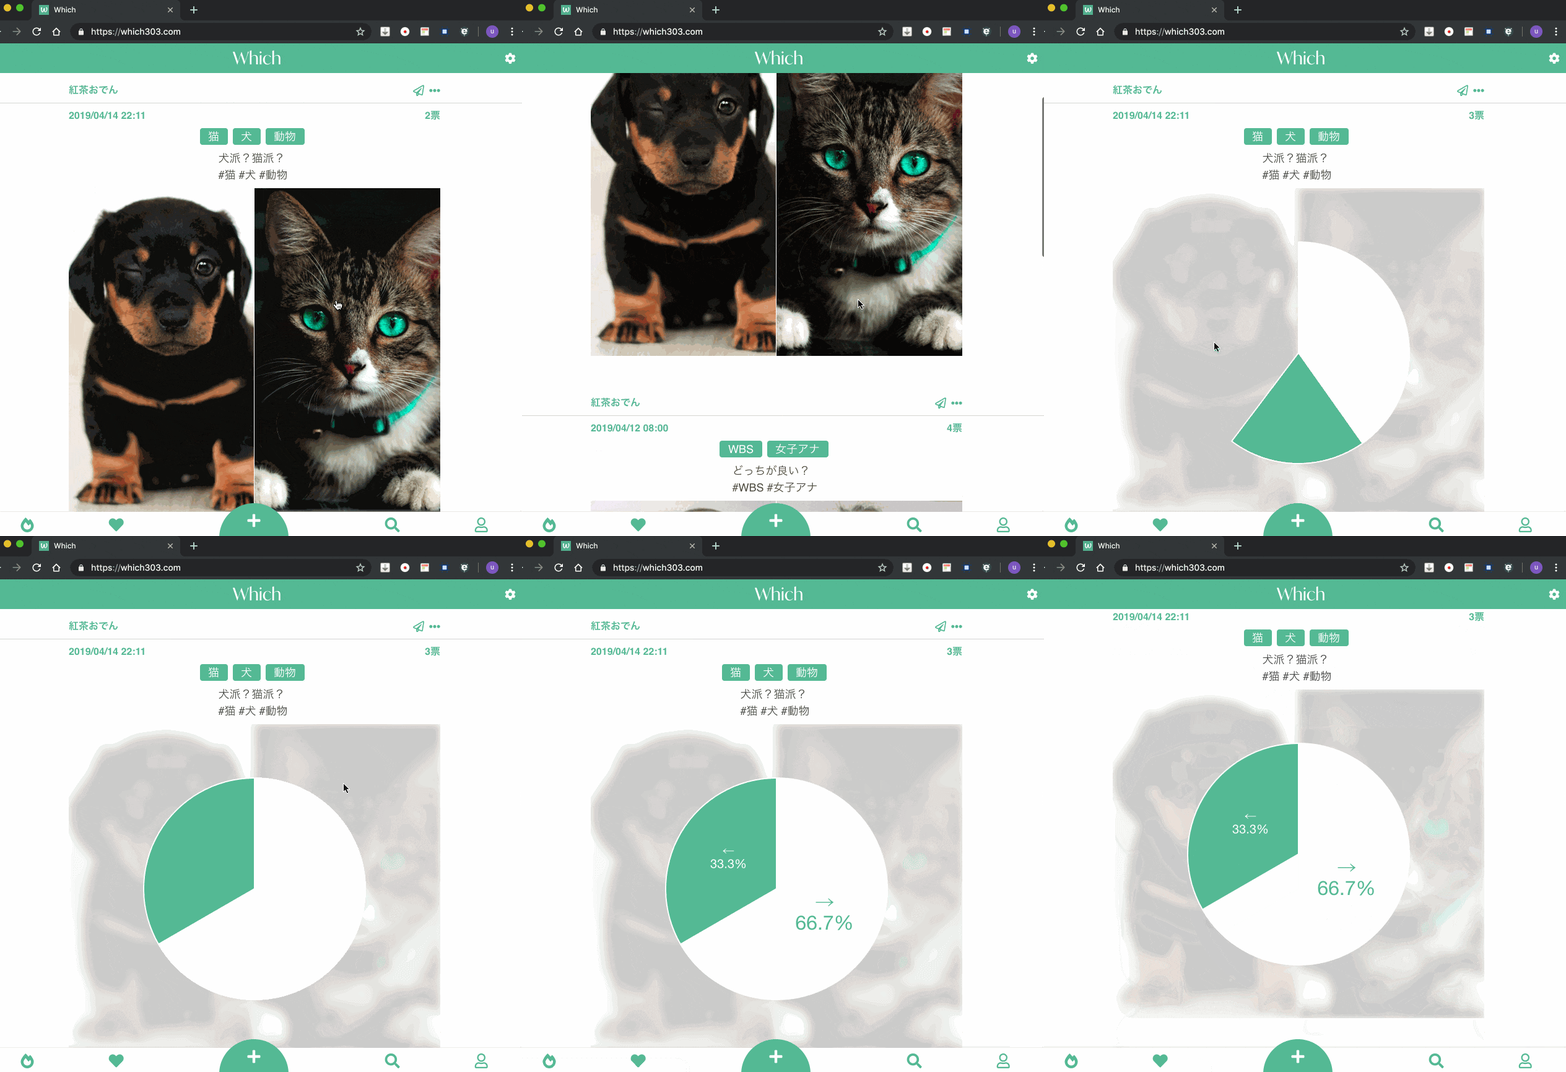
この度晴れて無職となった3名でWebサービスを作成したので、備忘録を兼ねてまとめていきます。
Qiita初投稿で拙いところもあると思いますが、ご容赦下さい。
Which開発にあたってのストーリーはこちら⇨ Note
製作に約1ヶ月ほど掛かり、苦労したことも多かったです。
本章では実装の部分を書いていきます。
環境構築については前章をご覧下さい。
作ったもの
Which
2枚の画像からどちらかを選択するような簡単なアンケートを匿名で投稿できるエンタメサービス
実装
今回実装するにあたって特に力を入れた点を書いていきます。
グラフの描画
グラフ表示のライブラリにはchart.jsをラッピングした、vue-chartjsを用いています。
円グラフ形式で、グラフ中に比率を表示させています。1
import Vue from 'vue';
import {Pie} from 'vue-chartjs'

Vue.component('chart', {
  extends: Pie,
  props: ['data', 'options'],
  mounted () {
    this.addPlugin({
      id: 'displayPersent',
      afterDatasetsDraw: function(chart, easing) {
        // To only draw at the end of animation, check for easing === 1
        if (easing !== 1) {
          return;
        }
        const ctx = chart.ctx;

        chart.data.datasets.forEach(function (dataset, i) {
          let dataSum = 0;
          let maxVal = -1;
          let maxIndex = 0;

          dataset.data.forEach(function (element, index){
            dataSum += element;
            // 最大値要素のindexをとっておく
            if (maxVal < element) {
              maxVal = element;
              maxIndex = index;
            }
          });

          const meta = chart.getDatasetMeta(i);
          if (!meta.hidden) {
            meta.data.forEach(function (element, index) {
              let fontSize;
              // 最大値要素は色・サイズ変更
              if (index === maxIndex) {
                ctx.fillStyle = 'rgb(84, 185, 148)';
                fontSize = 32;
              } else {
                ctx.fillStyle = 'rgb(255, 255, 255)';
                fontSize = 20;
              }

              const fontStyle = 'normal';
              const fontFamily = 'Helvetica Neue';
              ctx.font = Chart.helpers.fontString(fontSize, fontStyle, fontFamily);

              // Just naively convert to string for now
              const labelString = chart.data.labels[index];
              const dataString = (Math.round(dataset.data[index] / dataSum * 1000)/10).toString() + "%";

              // Make sure alignment settings are correct
              ctx.textAlign = 'center';
              ctx.textBaseline = 'middle';

              const padding = 5;
              const position = element.tooltipPosition();
              ctx.fillText(labelString, position.x, position.y - (fontSize / 2) - padding);
              ctx.fillText(dataString, position.x, position.y + (fontSize / 2) - padding);
            });
          }
        });
      }
    })
    this.renderChart(this.data, this.options)
  }
});
  /*
   ** Plugins to load before mounting the App
   */
  plugins: [
    ・・・
    {
      src: '~/plugins/vue-chart.js',
      ssr: false,
    },
    ・・・
  ],
<template>
・・・
<chart
  class="graph"
  v-if="showGraph"
  :data="makeGraphData(post)"
  :options="chartOption(post)"
></chart>
・・・
</template>

<script>
const judgeColors = [["#FFFFFF", "#54B994"], ["#54B994", "#FFFFFF"]];
・・・
  methods: {
    makeGraphData(post) {
      const data = [右のカウント, 左のカウント];
      return {
        labels: ["→", "←"],
        datasets: [
          {
            // 背景色を定義したセットから選択
            backgroundColor: judgeColors[data.indexOf(Math.max(...data))],
            data: data
          }
        ]
      };
    },
    chartOption(post) {
      return {
        responsive: true, // グラフ自動設定
        legend: {
          // 凡例設定
          display: false // 表示設定
        },
        animation: {
          duration: 500,
          easing: "easeOutExpo"
        },
        tooltips: {
          // 注釈の有効化
          enabled: true
        }
      };
    },
・・・
</script>
画像アップロード処理
スマホからの投稿を見越して、画像圧縮をかけた方が良さそうだったので2段階で圧縮をかけることにしました。
アップロード前にトリミング
一覧表示時に縦長表示となる為、予め縦長(9:16)となるようにトリミング
トリミングにはvue-cropperを使用しています。
import Vue from 'vue';
import VueCropper from "vue-cropperjs";

Vue.component('vue-cropper', VueCropper);
  /*
   ** Plugins to load before mounting the App
   */
  plugins: [
    ・・・
    {
      src: '~/plugins/vue-cropper.js',
      ssr: false
    },
    ・・・
  ],
<template>
・・・
<vue-cropper
  ref="cropper"
  style="height: 100%"
  :viewMode="2"
  :aspectRatio="1 / 1.778" <!-- 9 : 16 -->
  :zoomable="false"
></vue-cropper>
・・・
</template>

<scripts>
・・・
  methods: {
    ・・・
    saveImage() {
      // 左編集モード
      if (this.editNo == 1) {
        // クロップ領域の画像をimgタグ用にURLとして保存
        this.profileImage1 = this.$refs.cropper.getCroppedCanvas().toDataURL();
        // クロップ領域の画像をblob化
        this.$refs.cropper.getCroppedCanvas().toBlob(blob => {
          this.selectedFile1 = blob;
        });
      } else {
        // 右編集モード
        this.profileImage2 = this.$refs.cropper.getCroppedCanvas().toDataURL();
        this.$refs.cropper.getCroppedCanvas().toBlob(blob => {
          this.selectedFile2 = blob;
        });
      }
      this.closeModal();
    },
    ・・・
  },
・・・
</scripts>
アップされた写真の圧縮
firebaseのStrogeに上がったら発火するイベントをfirebase functionsに登録して圧縮しています。
画像圧縮には動作速度からSharpを選定し、使用しています。
(Sharpを用いた例がTypeScriptばかりだったので少し苦労しました)
exports.generateThumbnail = functions.storage.object().onFinalize((object) => {
  const filePath = object.name;
  const contentType = object.contentType;
  const fileDir = path.dirname(filePath);
  const fileName = path.basename(filePath);
  const thumbFilePath = path.normalize(path.join(fileDir, `${THUMB_PREFIX}${fileName}`));
  const tempLocalFile = path.join(os.tmpdir(), filePath);
  const tempLocalDir = path.dirname(tempLocalFile);
  const tempLocalThumbFile = path.join(os.tmpdir(), thumbFilePath);

  // jpgに変換するため、拡張子も併せて変更
  const regex = /(.+)\.[^.]+$/g;
  const thumbFilePathRep = thumbFilePath.replace(regex, '$1.jpg');
  const tempLocalThumbFileRep = tempLocalThumbFile.replace(regex, '$1.jpg');

  if (!contentType.startsWith('image/')) {
    console.log('This is not an image.');
    return null;
  }

  if (fileName.startsWith(THUMB_PREFIX)) {
    console.log('Already a Thumbnail.');
    return null;
  }

  const bucket = new Storage({
    keyFilename: 'service-account-credentials.json'
  }).bucket(object.bucket);
  const file = bucket.file(filePath);
  const thumbFile = bucket.file(thumbFilePath);
  const metadata = {
    contentType: contentType,
  };
  return mkdirp(tempLocalDir).then(() => {
    return file.download({
      destination: tempLocalFile
    });
  }).then(() => {
    console.log('The file has been downloaded to', tempLocalFile);
    // Sharp.jsで圧縮
    return new Promise((resolve, reject) => {
      sharp(tempLocalFile)
        .resize(THUMB_MAX_WIDTH)
        .jpeg()
        .toFile(tempLocalThumbFileRep, (err, info) => {
          if (!err) {
            resolve();
          } else {
            reject(err);
          }
        })
    });
  }).then(() => {
    console.log('Thumbnail created at', tempLocalThumbFileRep);
    bucket.file(filePath).delete();
    return bucket.upload(tempLocalThumbFileRep, {
      destination: thumbFilePathRep,
      metadata: metadata
    });
  })
});
画像が回転する問題
鋭意編集中…
さいごに
色々と苦労したところもありましたが、一通りの機能は出来ました!
こちらまだまだβ版ではありますが、もしよろしければ使ってみてください!
Which
-
以下のサイトを参考にしました。 https://beiznotes.org/show-percentage-on-chart-js/ ↩
