はじめに
この記事は 検索エンジンプロダクトを一緒に開発してた同窓会 Advent Calendar 2023の18日目の記事です。
昨日はkz_moritaさんのデータエンジニアに入門して読んだ本とこれから読みたい本でした。
概要
Hasuraとは、PostgreSQL等のデータベースエンジンのスキーマからGraphQL APIを構築してくれるオープンソースエンジンです。
Hasuraのメトリクスを監視することで、Hasuraへのgraphqlクエリの実行時間やEventTriggerの情報を監視することが可能です。
今回、業務委託先のベースフード株式会社様にて、ある社内システムに対してHasuraの導入を検討しており、メトリクス監視が可能かどうか調査しました。
全体のコードはこちらをご覧ください。
Hasuraのメトリクス取得方法
Hasuraのメトリクス取得方法はプランごとに方法が存在します。
- HasuraCloudを使用 (https://hasura.io/learn/ja/graphql/hasura-advanced/reliability/2-observability/)
- Self-Hosted版を使用
- Custom pricingプランを使用する
- Freeプランで、hasura-metric-adapterを使用する
今回の導入では社内システムを想定しており、金額面も考えると2-2の選択肢が残りました。
HasuraのDockerコンテナとprometeus用のexporterを使用しメトリクスを収集します。
hasura-metric-adapterの想定ユースケース例
hasura-metric-adapterを使った場合、以下のようなメトリクスを収集できるとのことです。
1 クエリごとの実行時間平均を可視化したい
2 イベント実行数を監視したい
3 websocketのactive数を監視したい
※今回のケースだと2.のイベント関係の情報の収集がエラーでできませんでした。
ローカル環境での構築手順
以下4つのコンテナを用意します。
- Postgres
- Hasura
- hasura-metric-adapter
- prometeus
Postgres
version: "3.6"
services:
  postgres:
    image: postgres:15
    restart: always
    ports:
      - "5432:5432"
    volumes:
      - db_data:/var/lib/postgresql/data
    environment:
      POSTGRES_PASSWORD: postgrespassword

volumes:
  db_data:
試しに構築したのでバージョンは適当です。
Hasura
  graphql-engine:
    image: hasura/graphql-engine:v2.35.0
    command: sh -c 'rm -rf /tmp/log/stdout.log && mkfifo /tmp/log/stdout.log && /bin/graphql-engine serve | tee /tmp/log/stdout.log'
    ports:
      - "8080:8080"
    restart: always
    volumes:
      - logs:/tmp/log
    environment:
      HASURA_GRAPHQL_METADATA_DATABASE_URL: postgres://postgres:postgrespassword@postgres:5432/postgres
      PG_DATABASE_URL: postgres://postgres:postgrespassword@postgres:5432/postgres
      HASURA_GRAPHQL_ENABLE_CONSOLE: "true" # set to "false" to disable console
      HASURA_GRAPHQL_DEV_MODE: "true"
      HASURA_GRAPHQL_ENABLED_LOG_TYPES: startup, http-log, webhook-log, websocket-log, query-log
      HASURA_GRAPHQL_ADMIN_SECRET: myadminsecretkey
      HASURA_GRAPHQL_METADATA_DEFAULTS: '{"backend_configs":{"dataconnector":{"athena":{"uri":"http://data-connector-agent:8081/api/v1/athena"},"mariadb":{"uri":"http://data-connector-agent:8081/api/v1/mariadb"},"mysql8":{"uri":"http://data-connector-agent:8081/api/v1/mysql"},"oracle":{"uri":"http://data-connector-agent:8081/api/v1/oracle"},"snowflake":{"uri":"http://data-connector-agent:8081/api/v1/snowflake"}}}}'
    depends_on:
      - graphql-server
      - postgres

volumes:
  logs:
commandの部分が若干癖があります。hasuraの標準出力ログをexporterと共有するためにこのようになっています。
このあたりはgithubレポジトリのdocker-compose.ymlを参考にしました。
hasura-metric-adapter
exporterを設定します。
  hasura-metric-adapter:
    image: ghcr.io/afitzek/hasura-metric-adapter:v0.2.1
    ports:
      - "8082:8082"
    volumes:
      - logs:/tmp/log
    depends_on:
      graphql-engine:
        condition: service_healthy
    environment:
      LISTEN_ADDR: 0.0.0.0:8082 # hasura-metric-adapterサーバーの起動アドレス
      LOG_FILE: /tmp/log/stdout.log # 監視対象のログファイル名
      HASURA_GRAPHQL_ENDPOINT: http://localhost:8080
      HASURA_GRAPHQL_ADMIN_SECRET: myadminsecretkey # イベント系のログを収集する場合に必要
      RUST_BACKTRACE: 1 # Rustのエラー時にバックトレースを表示する
      EXCLUDE_COLLECTORS: event-triggers # エラーが出るので必要
Prometeusサーバー
Prometeusを設定します。
まず、./prometeus/prometeus.ymlの設定ファイルを作成します。
global:
  scrape_interval: 15s # デフォルトのスクレイプ間隔

scrape_configs:
  - job_name: 'hasura'
    metrics_path: '/metrics'
    static_configs:
      - targets: ['hasura-metric-adapter:8082']
続いてdocker-compose.ymlにprometeusサーバーを追加します。
  prometheus:
    image: prom/prometheus:latest
    ports:
      - "9090:9090"
    volumes:
      - ./prometheus/prometheus.yml:/etc/prometheus/prometheus.yml
注意点
-
depends_on: graphql-engine:こちらは必ずセットします。hasuraの起動前にこちらを起動するとadapterがエラーで終了するためです。 - hasura側でメタデータのエラーが出ていると取得がうまくできない
- EXCLUDE_COLLECTORS=event-triggers を設定しないと、
thread 'main' panicked at 'no entry found for key', src/collectors/event_triggers.rs:122:20というエラーが出る
動作確認
コンテナを起動します。
docker compose up
curlでadapterが動いているか確認します。
curl -i localhost:8082/metrics
以下のような形式でメトリクスが出力されます。
hasura_errors_total{collector="version"} 3
# HELP hasura_failed_one_off_events Number of failed Hasura one off scheduled events
# TYPE hasura_failed_one_off_events gauge
hasura_failed_one_off_events 0
# HELP hasura_healthy If 1, Hasura GraphQl server is healthy, 0 otherwise
# TYPE hasura_healthy gauge
hasura_healthy 0
# HELP hasura_log_lines_counter Number of log lines processed
# TYPE hasura_log_lines_counter counter
hasura_log_lines_counter{logtype="http-log"} 4
hasura_log_lines_counter{logtype="query-log"} 2
hasura_log_lines_counter{logtype="startup"} 12
hasura_log_lines_counter{logtype="telemetry-log"} 1
hasura_log_lines_counter{logtype="unstructured"} 13
# HELP hasura_log_lines_counter_total Total number of log lines processed
# TYPE hasura_log_lines_counter_total counter
hasura_log_lines_counter_total 32
# HELP hasura_metadata_consistency_status If 1, metadata is consistent, 0 otherwise
# TYPE hasura_metadata_consistency_status gauge
hasura_metadata_consistency_status 0
# HELP hasura_pending_one_off_events Number of pending Hasura one off scheduled events
# TYPE hasura_pending_one_off_events gauge
hasura_pending_one_off_events 0
# HELP hasura_processed_one_off_events Number of processed Hasura one off scheduled events
# TYPE hasura_processed_one_off_events gauge
hasura_processed_one_off_events 0
# HELP hasura_query_execution_seconds Query execution time. On success, error is '', otherwise it's the error code. Unnnamed operations are ''
# TYPE hasura_query_execution_seconds histogram
hasura_query_execution_seconds_bucket{error="",operation="MyMutation",le="0.005"} 0
hasura_query_execution_seconds_bucket{error="",operation="MyMutation",le="0.01"} 0
hasura_query_execution_seconds_bucket{error="",operation="MyMutation",le="0.025"} 0
hasura_query_execution_seconds_bucket{error="",operation="MyMutation",le="0.05"} 0
hasura_query_execution_seconds_bucket{error="",operation="MyMutation",le="0.1"} 0
hasura_query_execution_seconds_bucket{error="",operation="MyMutation",le="0.25"} 0
hasura_query_execution_seconds_bucket{error="",operation="MyMutation",le="0.5"} 0
hasura_query_execution_seconds_bucket{error="",operation="MyMutation",le="1"} 0
hasura_query_execution_seconds_bucket{error="",operation="MyMutation",le="2.5"} 2
hasura_query_execution_seconds_bucket{error="",operation="MyMutation",le="5"} 2
hasura_query_execution_seconds_bucket{error="",operation="MyMutation",le="10"} 2
hasura_query_execution_seconds_bucket{error="",operation="MyMutation",le="+Inf"} 2
hasura_query_execution_seconds_sum{error="",operation="MyMutation"} 2.046704502
hasura_query_execution_seconds_count{error="",operation="MyMutation"} 2
※hasura-metric-adapterはエラーログしか出しませんので、docker上のログから動作確認は難しいです。
続いて、prometeusのUIからメトリクスを確認します。
http://localhost:9090に行き、検索ボックスにhaといれるとhasuraのメトリクスの候補が表示されるので、いずれかのメトリクス名を選び、検索してみます。
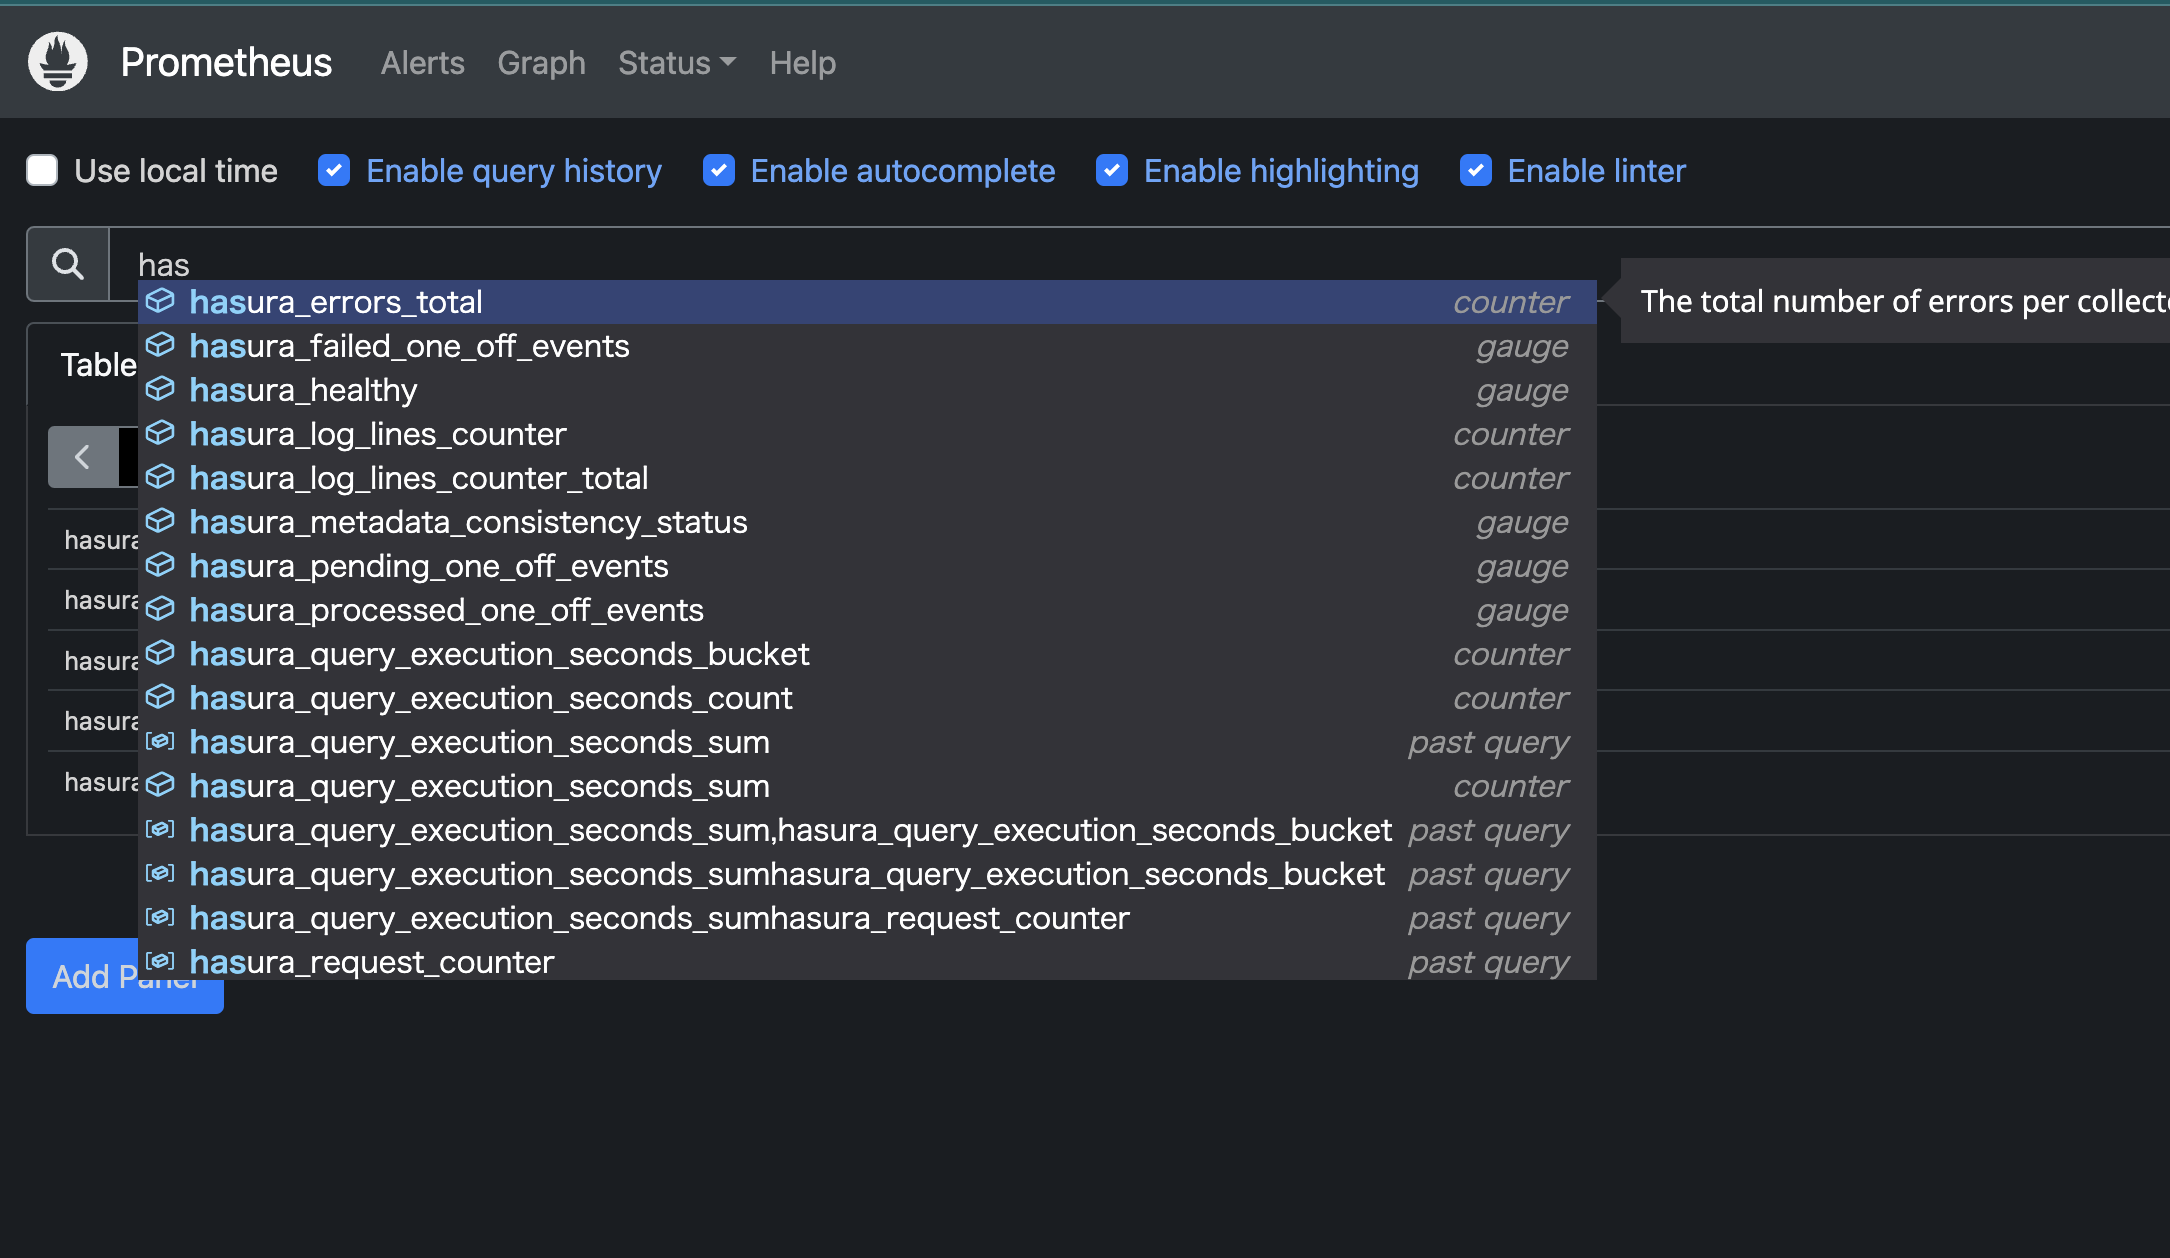
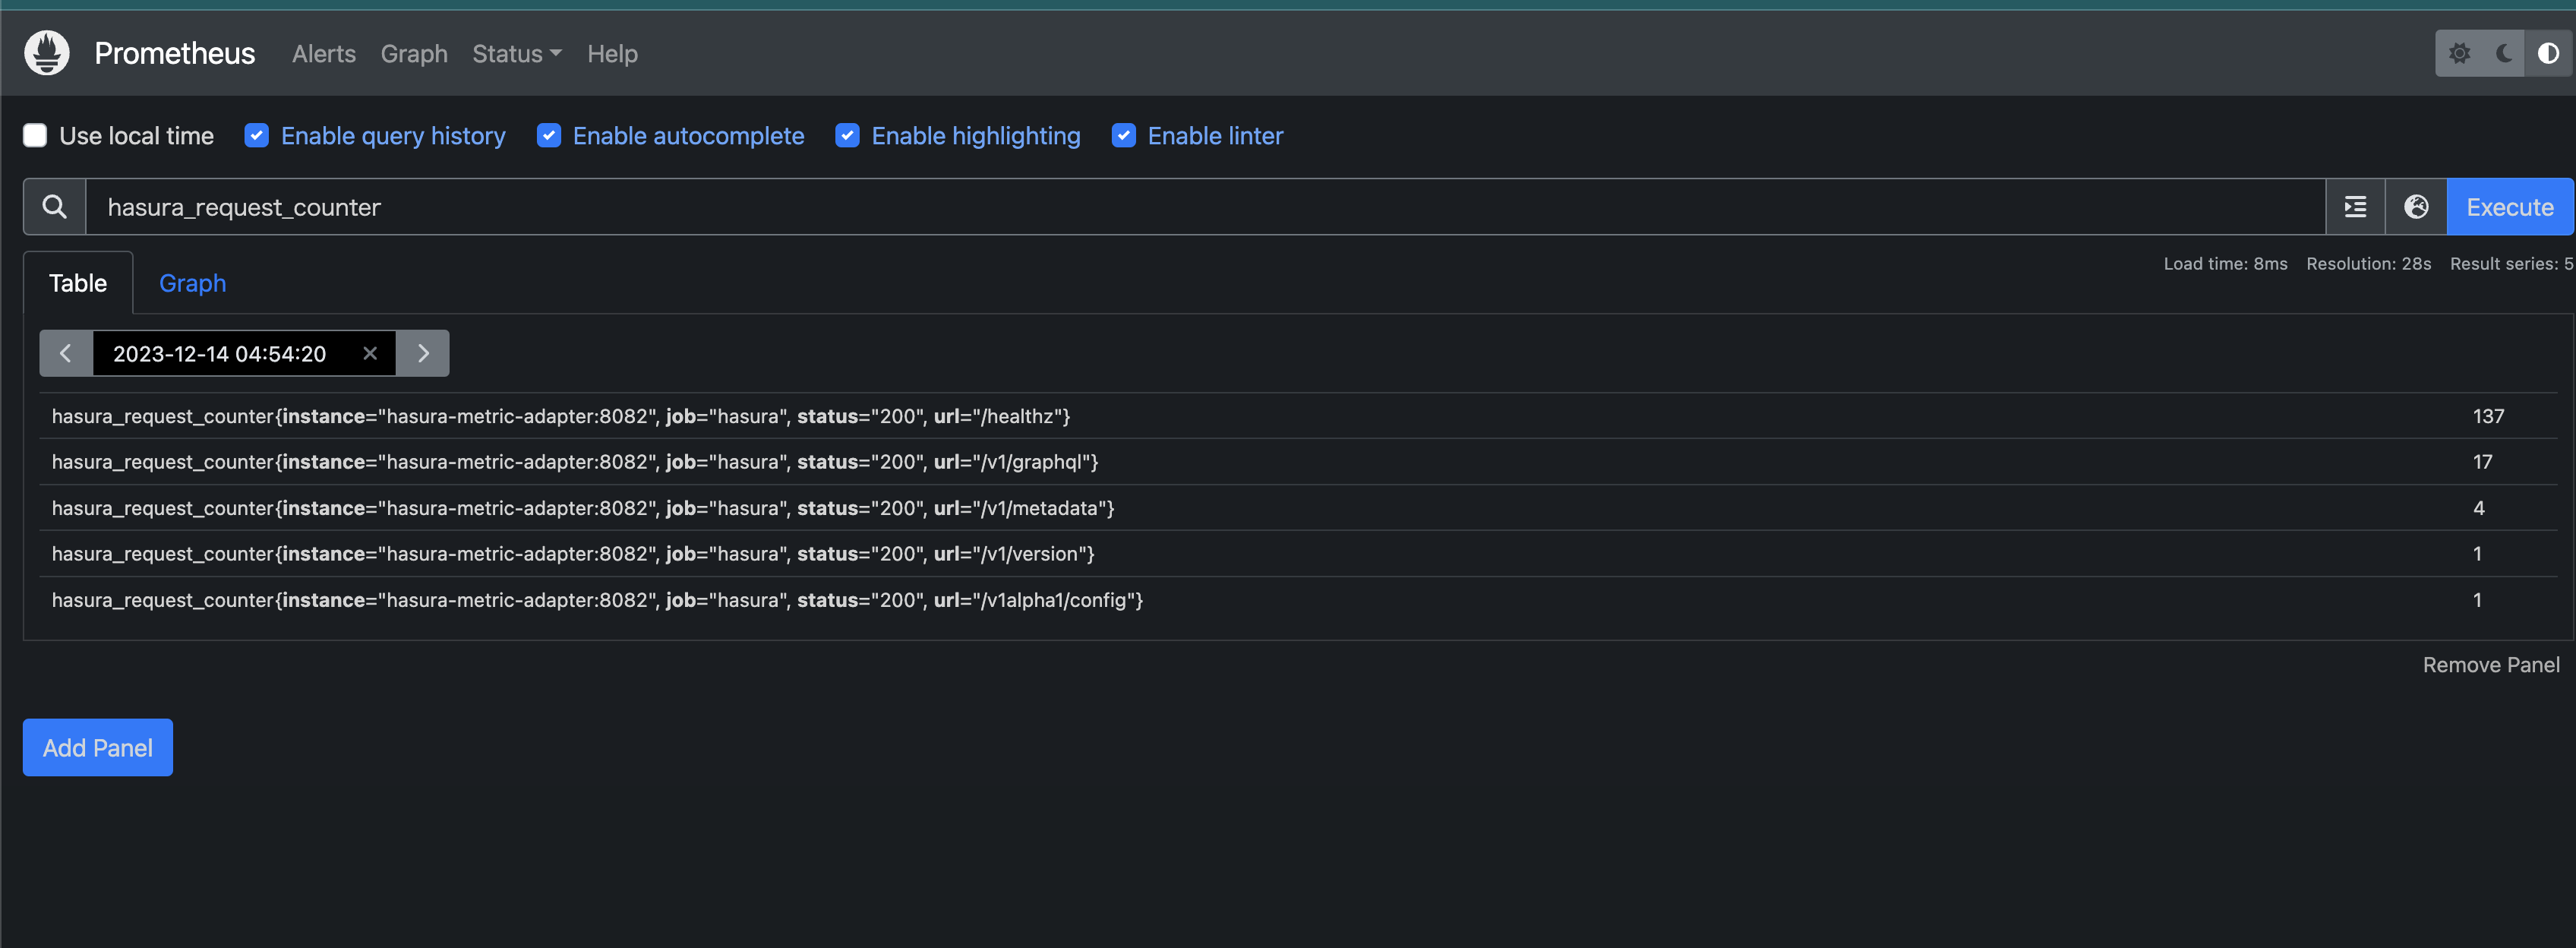
以下のように一覧がでます。
Graphタブを開くと、以下のようにグラフ表示もされました。

まとめ
hasura-metric-adapterを使用しhasuraのメトリクスをprometeusに送るための構築を行い、グラフまで表示することができました。
実際にやってみたところ、メトリクスは取れたものの取得できる種類が少なく、実用にはまだ機能不足という印象でした。