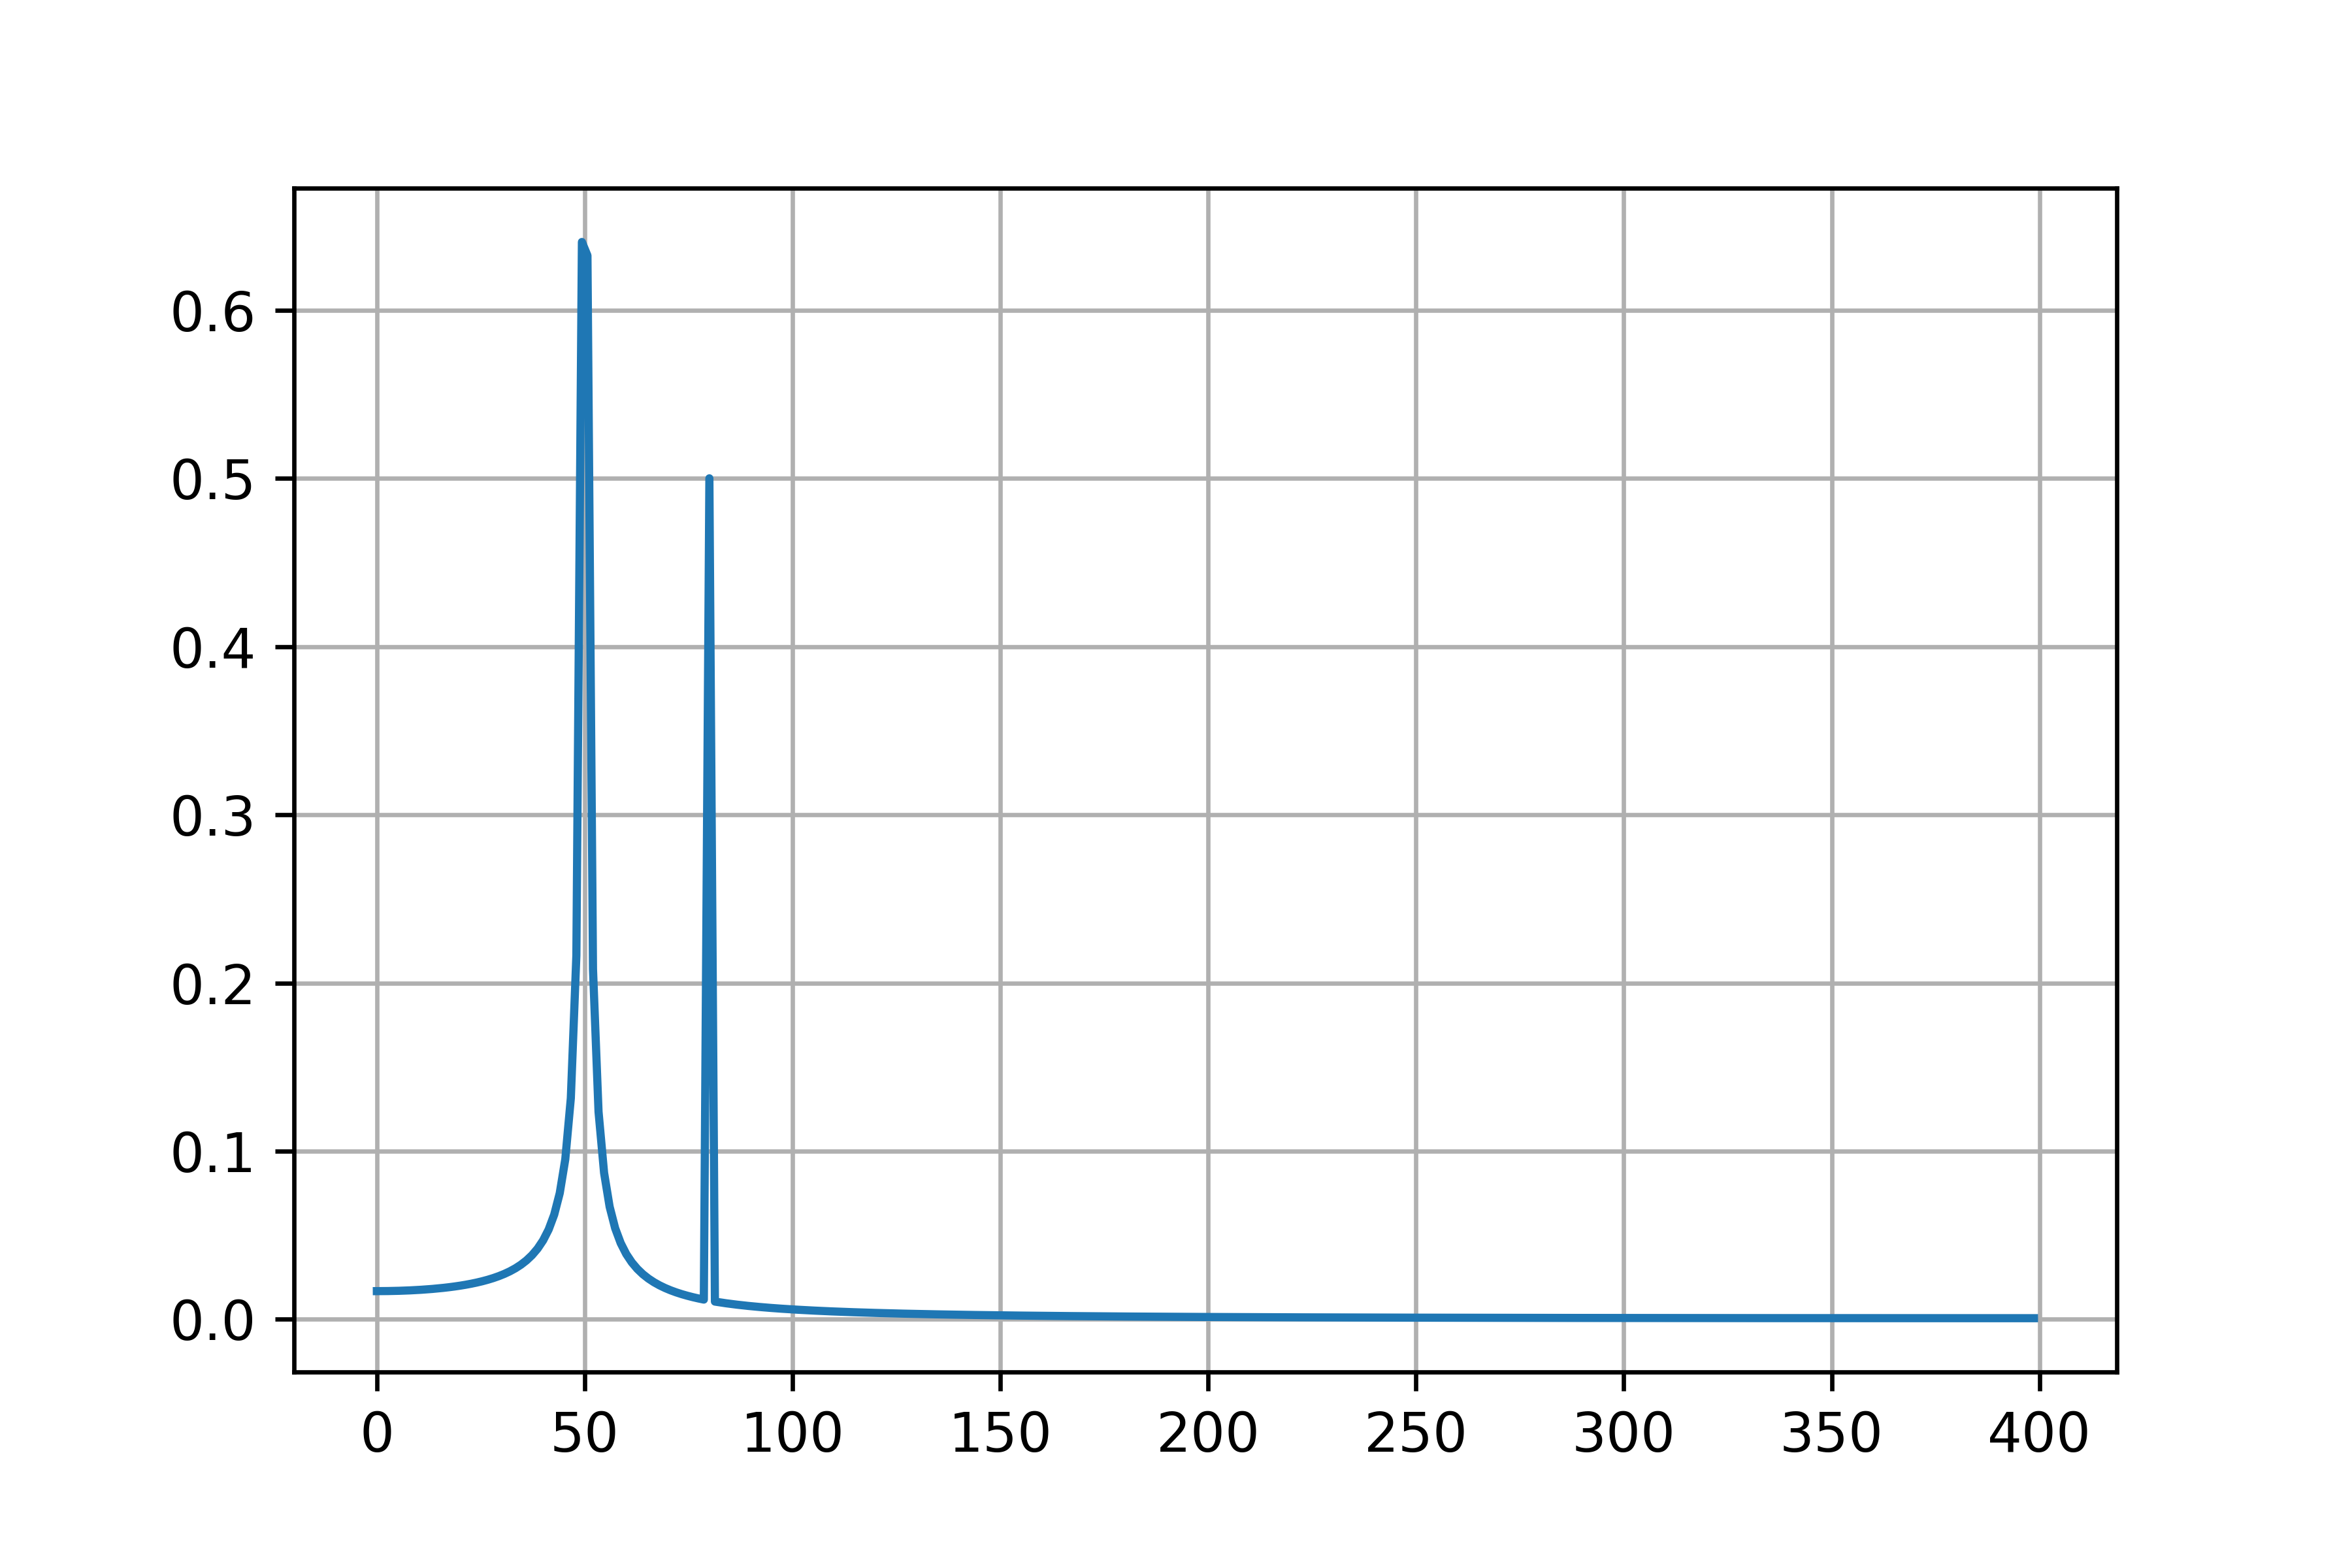
はじめに.
FFTをする際は,
Fourier Transforms (scipy.fft) — SciPy v1.10.1 Manual
にある,以下のコードを実行することが多いかもしれません.
from scipy.fft import fft, fftfreq
import numpy as np
# Number of sample points
N = 600
# sample spacing
T = 1.0 / 800.0
x = np.linspace(0.0, N*T, N, endpoint=False)
y = np.sin(50.0 * 2.0*np.pi*x) + 0.5*np.sin(80.0 * 2.0*np.pi*x)
yf = fft(y)
xf = fftfreq(N, T)[:N//2]
import matplotlib.pyplot as plt
plt.plot(xf, 2.0/N * np.abs(yf[0:N//2]))
plt.grid()
plt.show()
このコードを見たときにいくつか不思議に思う点があると思います.
- なぜ
[0:N//2]でスライスしているの? - なぜ
2.0/N * np.abs(yf[0:N//2])と表示しているの? - 本当にIFFTで元の信号の戻るの?
- 振幅スペクトル,位相スペクトルやパワースペクトルとの違いはなに?
- 振幅が1になってないのはなぜ?
前回の記事では,
「なぜ2.0/N * np.abs(yf[0:N//2])と表示しているの?」
という疑問に対して私なりの結論を提示させていただきました.
まずは,位相スペクトルを表示するプログラムを書いてみましょう.
振幅スペクトルと位相スペクトル.
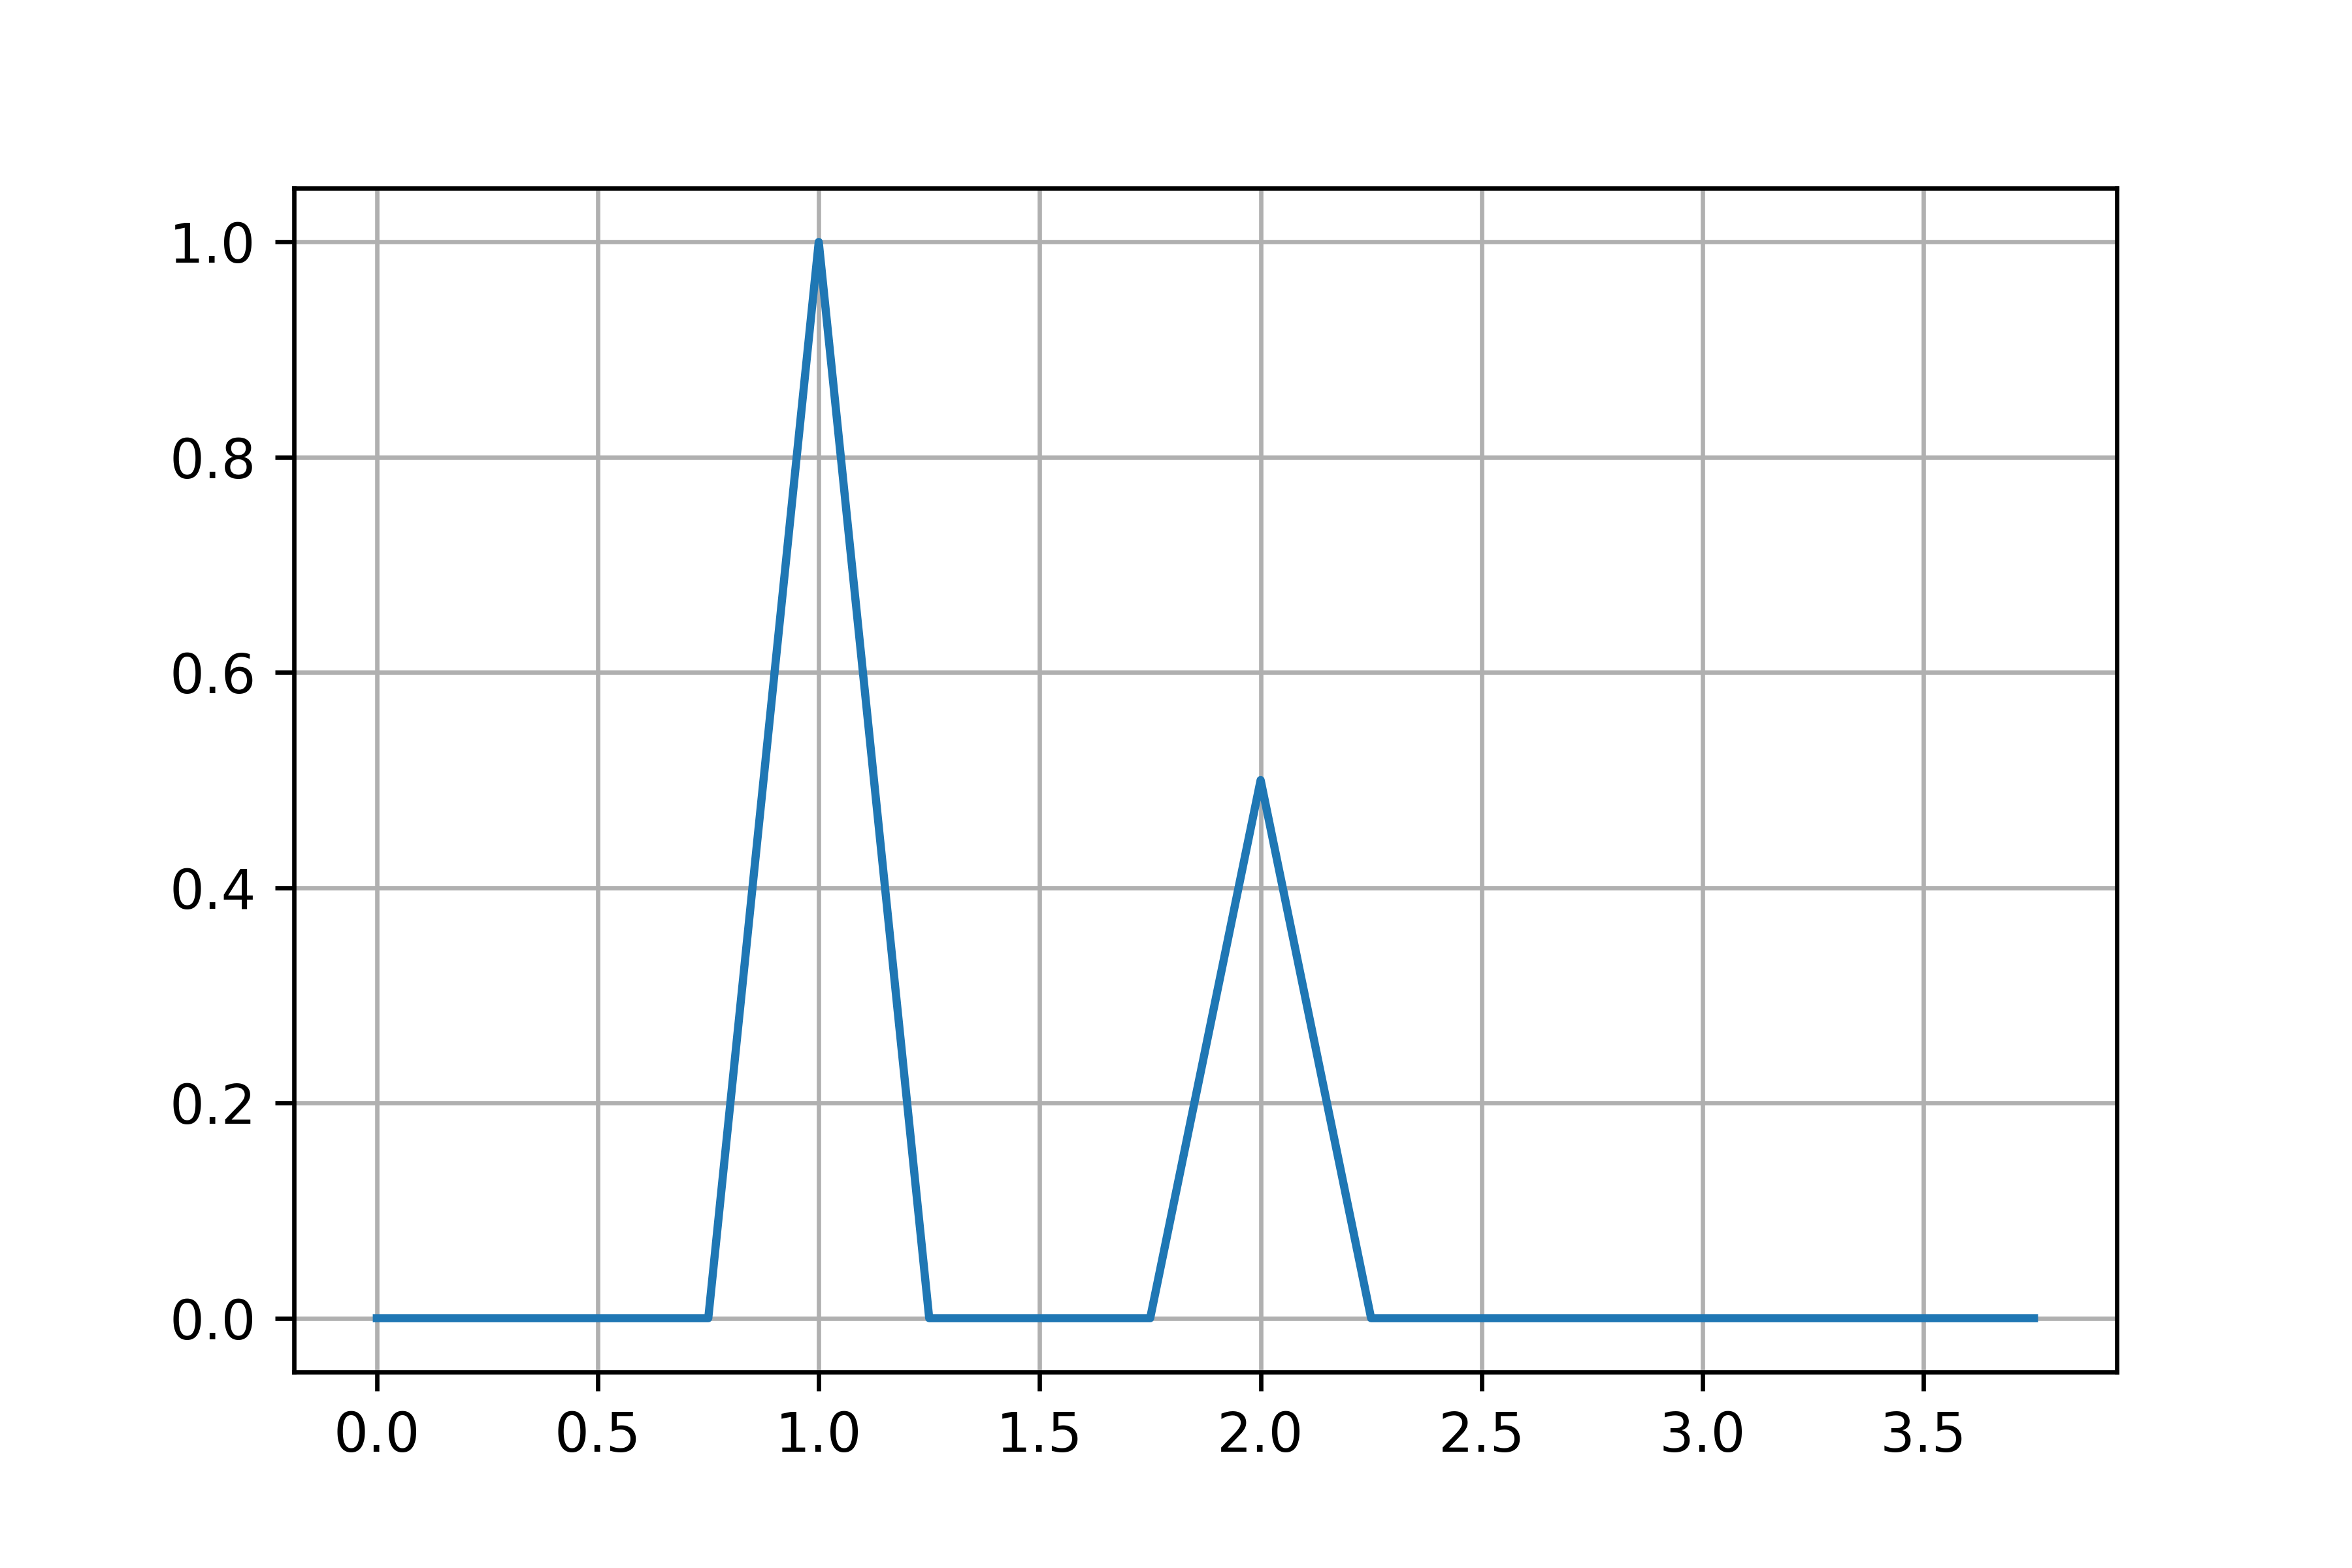
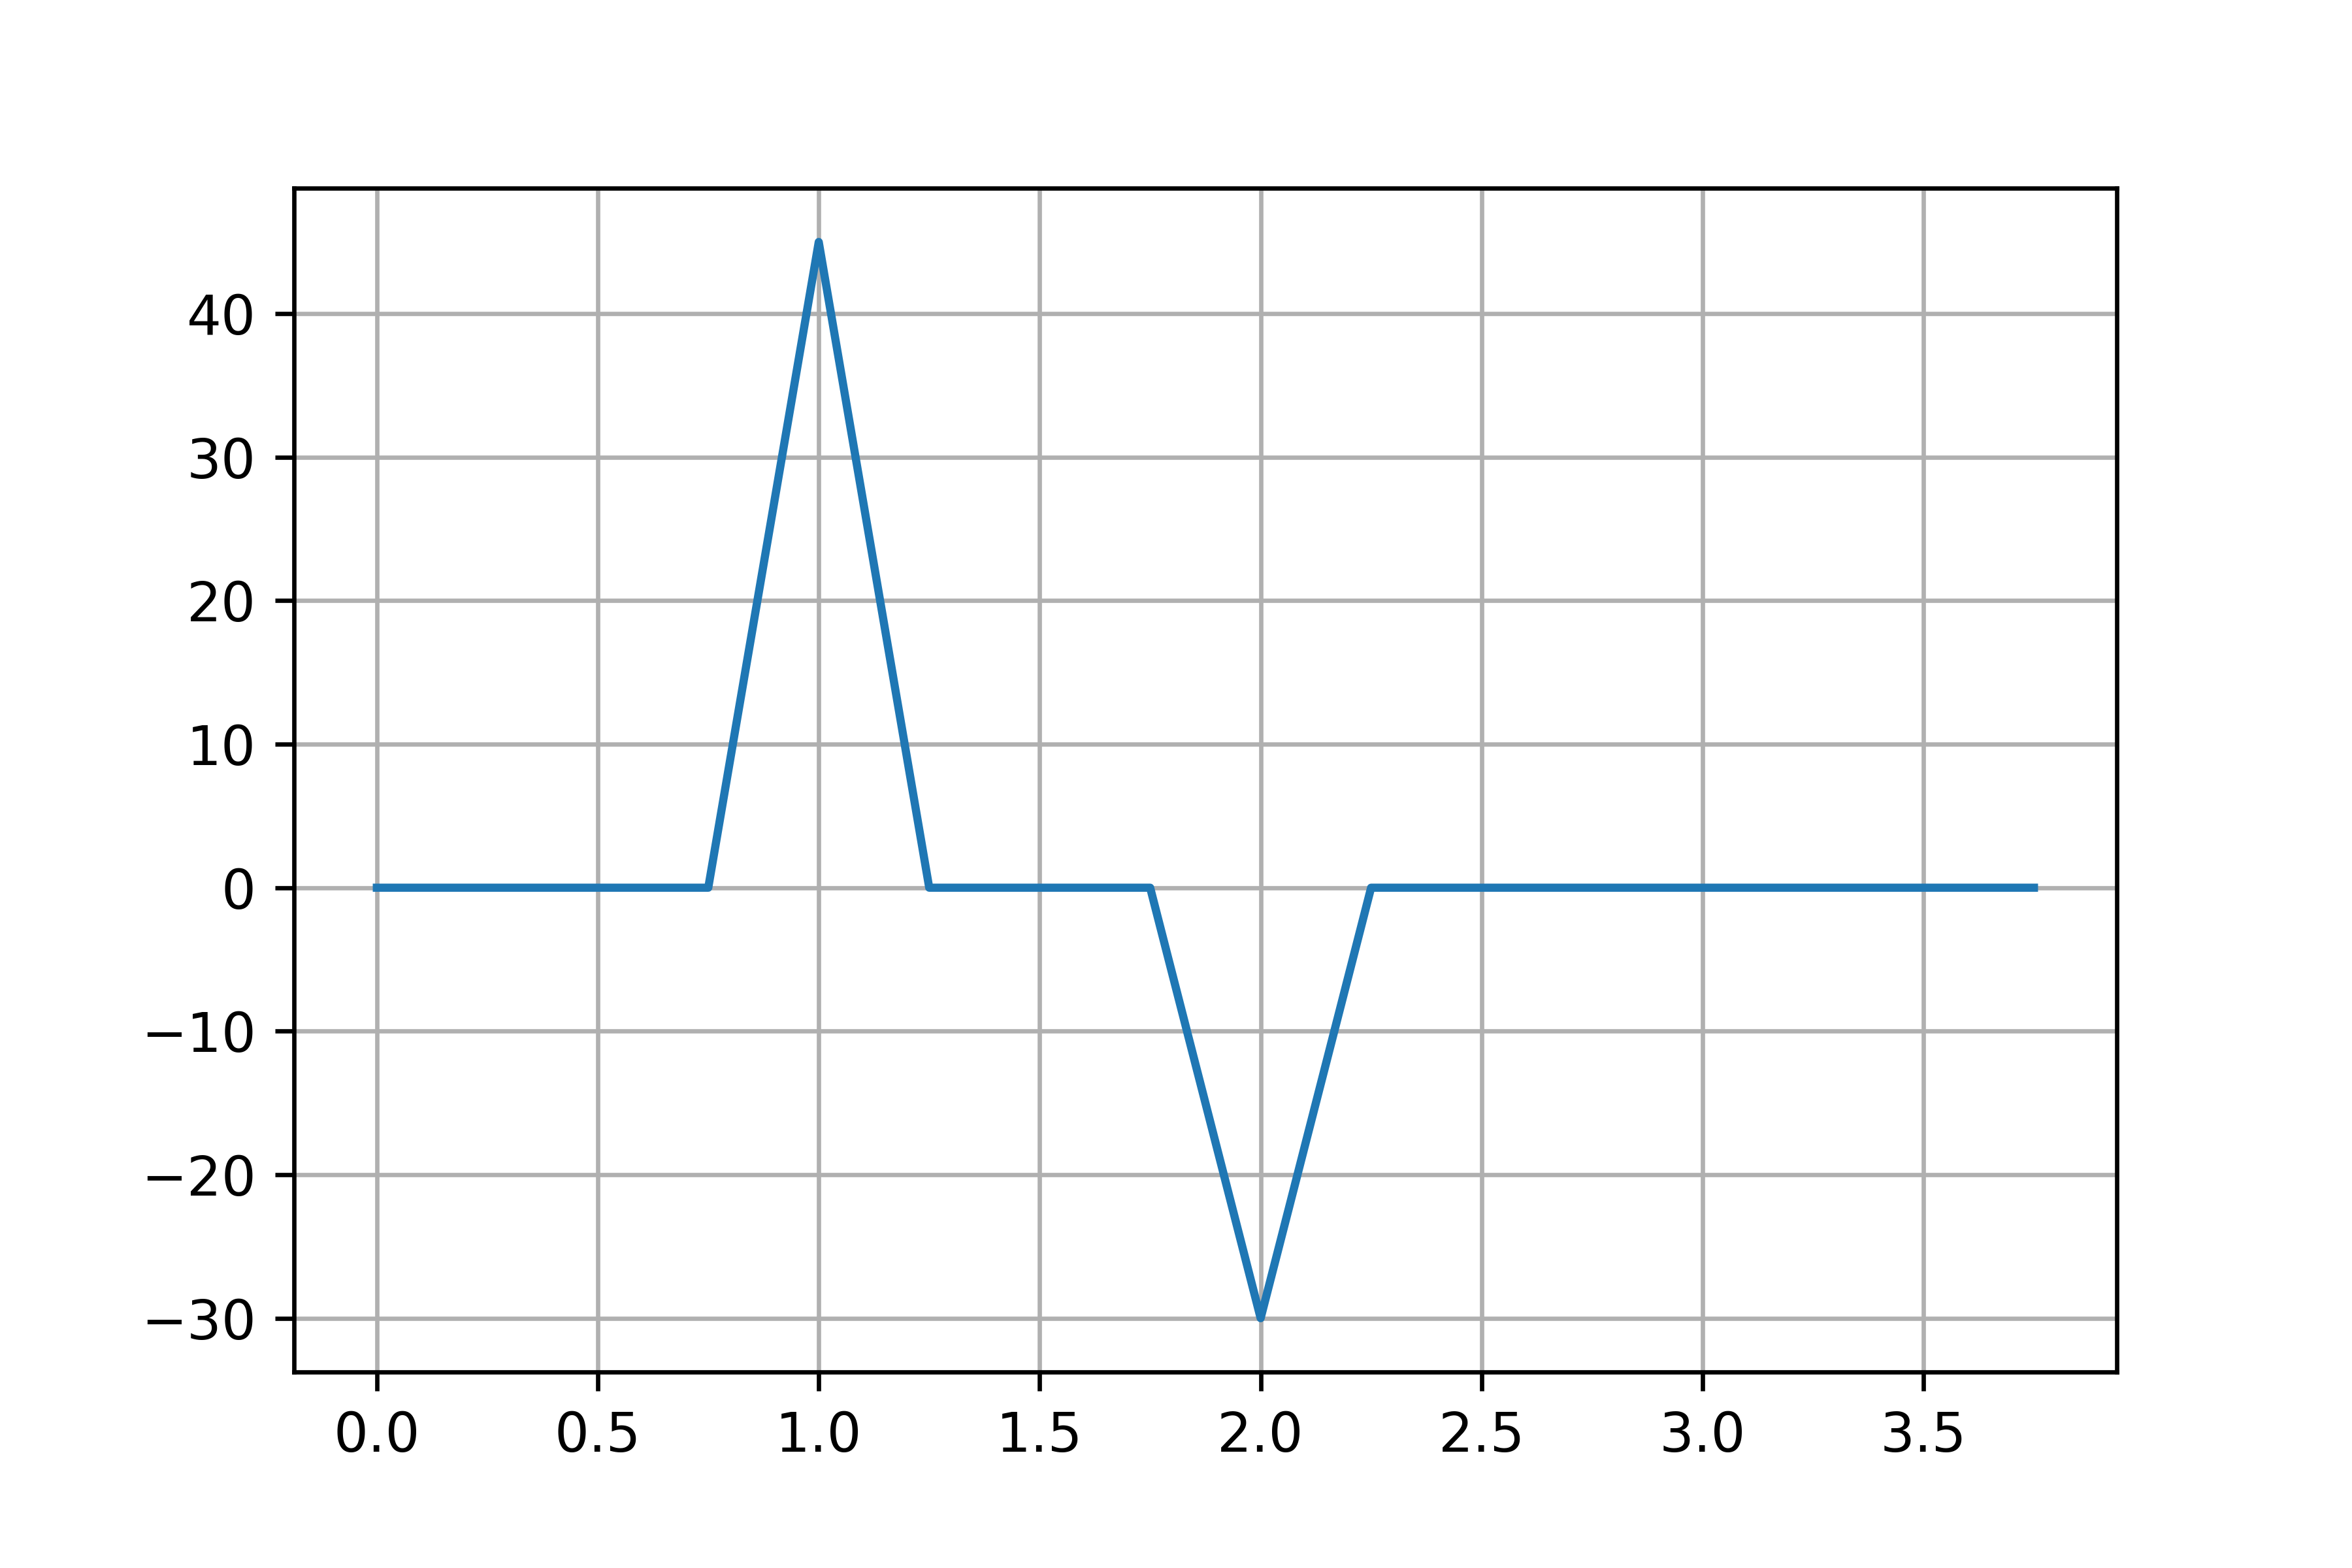
例えば,以下のようなコードを実行してみましょう.
from scipy.fft import fft, ifft, fftfreq
import numpy as np

T = 4
fs = 8

f1 = 1
f2 = 2

N = int(fs * T)
dT = 1.0 / fs

time_array = np.linspace(0.0, N*dT, N, endpoint=False)
signal = np.cos(f1 * 2.0*np.pi*time_array + np.pi/4 ) + 0.5*np.cos(f2 * 2.0*np.pi*time_array - np.pi/6 )

fft_result = fft(signal)

amp = 2*np.abs(fft_result / N)
deg = np.rad2deg(np.angle( fft_result ))
deg[amp < 1e-5] = 0

freq = fftfreq(N, dT)

import matplotlib.pyplot as plt
plt.plot(freq[0:N//2], amp[0:N//2])
plt.grid()
plt.show()

plt.plot(freq[0:N//2], deg[0:N//2])
plt.grid()
plt.show()
画像が生成されました,うれしいですね.
基本的なFFTに関することは,これで終わりです.
しかし,これだけど終わるのは少し悲しいですね.
振幅スペクトルと位相スペクトルが導出できれば学部一,二年の課題は大丈夫だと思います.
次回以降はIFFTの話や分解能の話をしたいと思います.
一応なぜ,deg[amp < 1e-5] = 0を行うのかという話をここで記述したいと思います.
deg[amp < 1e-5] = 0を実行しない状態のdeg[0:N//2]変数の中身は以下のようになっていると思います.
| Index | Value | Index | Value | Index | Value | Index | Value |
|---|---|---|---|---|---|---|---|
| 0 | -180.0 | 4 | 45.0 | 8 | -30.0 | 12 | 39.8 |
| 1 | -108.7 | 5 | -128.4 | 9 | -41.8 | 13 | -35.9 |
| 2 | -99.2 | 6 | 171.8 | 10 | 37.6 | 14 | 13.9 |
| 3 | 34.1 | 7 | -170.7 | 11 | -93.8 | 15 | -151.5 |
次に,amp[0:N//2]変数の中身は以下のようになっていると思います.
| Index | Value | Index | Value | Index | Value | Index | Value |
|---|---|---|---|---|---|---|---|
| 0 | 0.0 | 4 | 1.0 | 8 | 0.5 | 12 | 0.0 |
| 1 | 0.0 | 5 | 0.0 | 9 | 0.0 | 13 | 0.0 |
| 2 | 0.0 | 6 | 0.0 | 10 | 0.0 | 14 | 0.0 |
| 3 | 0.0 | 7 | 0.0 | 11 | 0.0 | 15 | 0.0 |
ここで,振幅が0に近い,位相の情報は不要なので,deg[amp < 1e-5] = 0を実行します.
そうすると,deg[0:N//2]変数の中身は以下のようになります.
| Index | Value | Index | Value | Index | Value | Index | Value |
|---|---|---|---|---|---|---|---|
| 0 | 0.0 | 4 | 45.0 | 8 | -30.0 | 12 | 0.0 |
| 1 | 0.0 | 5 | 0.0 | 9 | 0.0 | 13 | 0.0 |
| 2 | 0.0 | 6 | 0.0 | 10 | 0.0 | 14 | 0.0 |
| 3 | 0.0 | 7 | 0.0 | 11 | 0.0 | 15 | 0.0 |
以上がdeg[amp < 1e-5] = 0を実行する理由です.
グラフの表示に関して.
あまりにも,この情報量だと記事としてあんまりなので,少しだけ内容を補足しましょう.
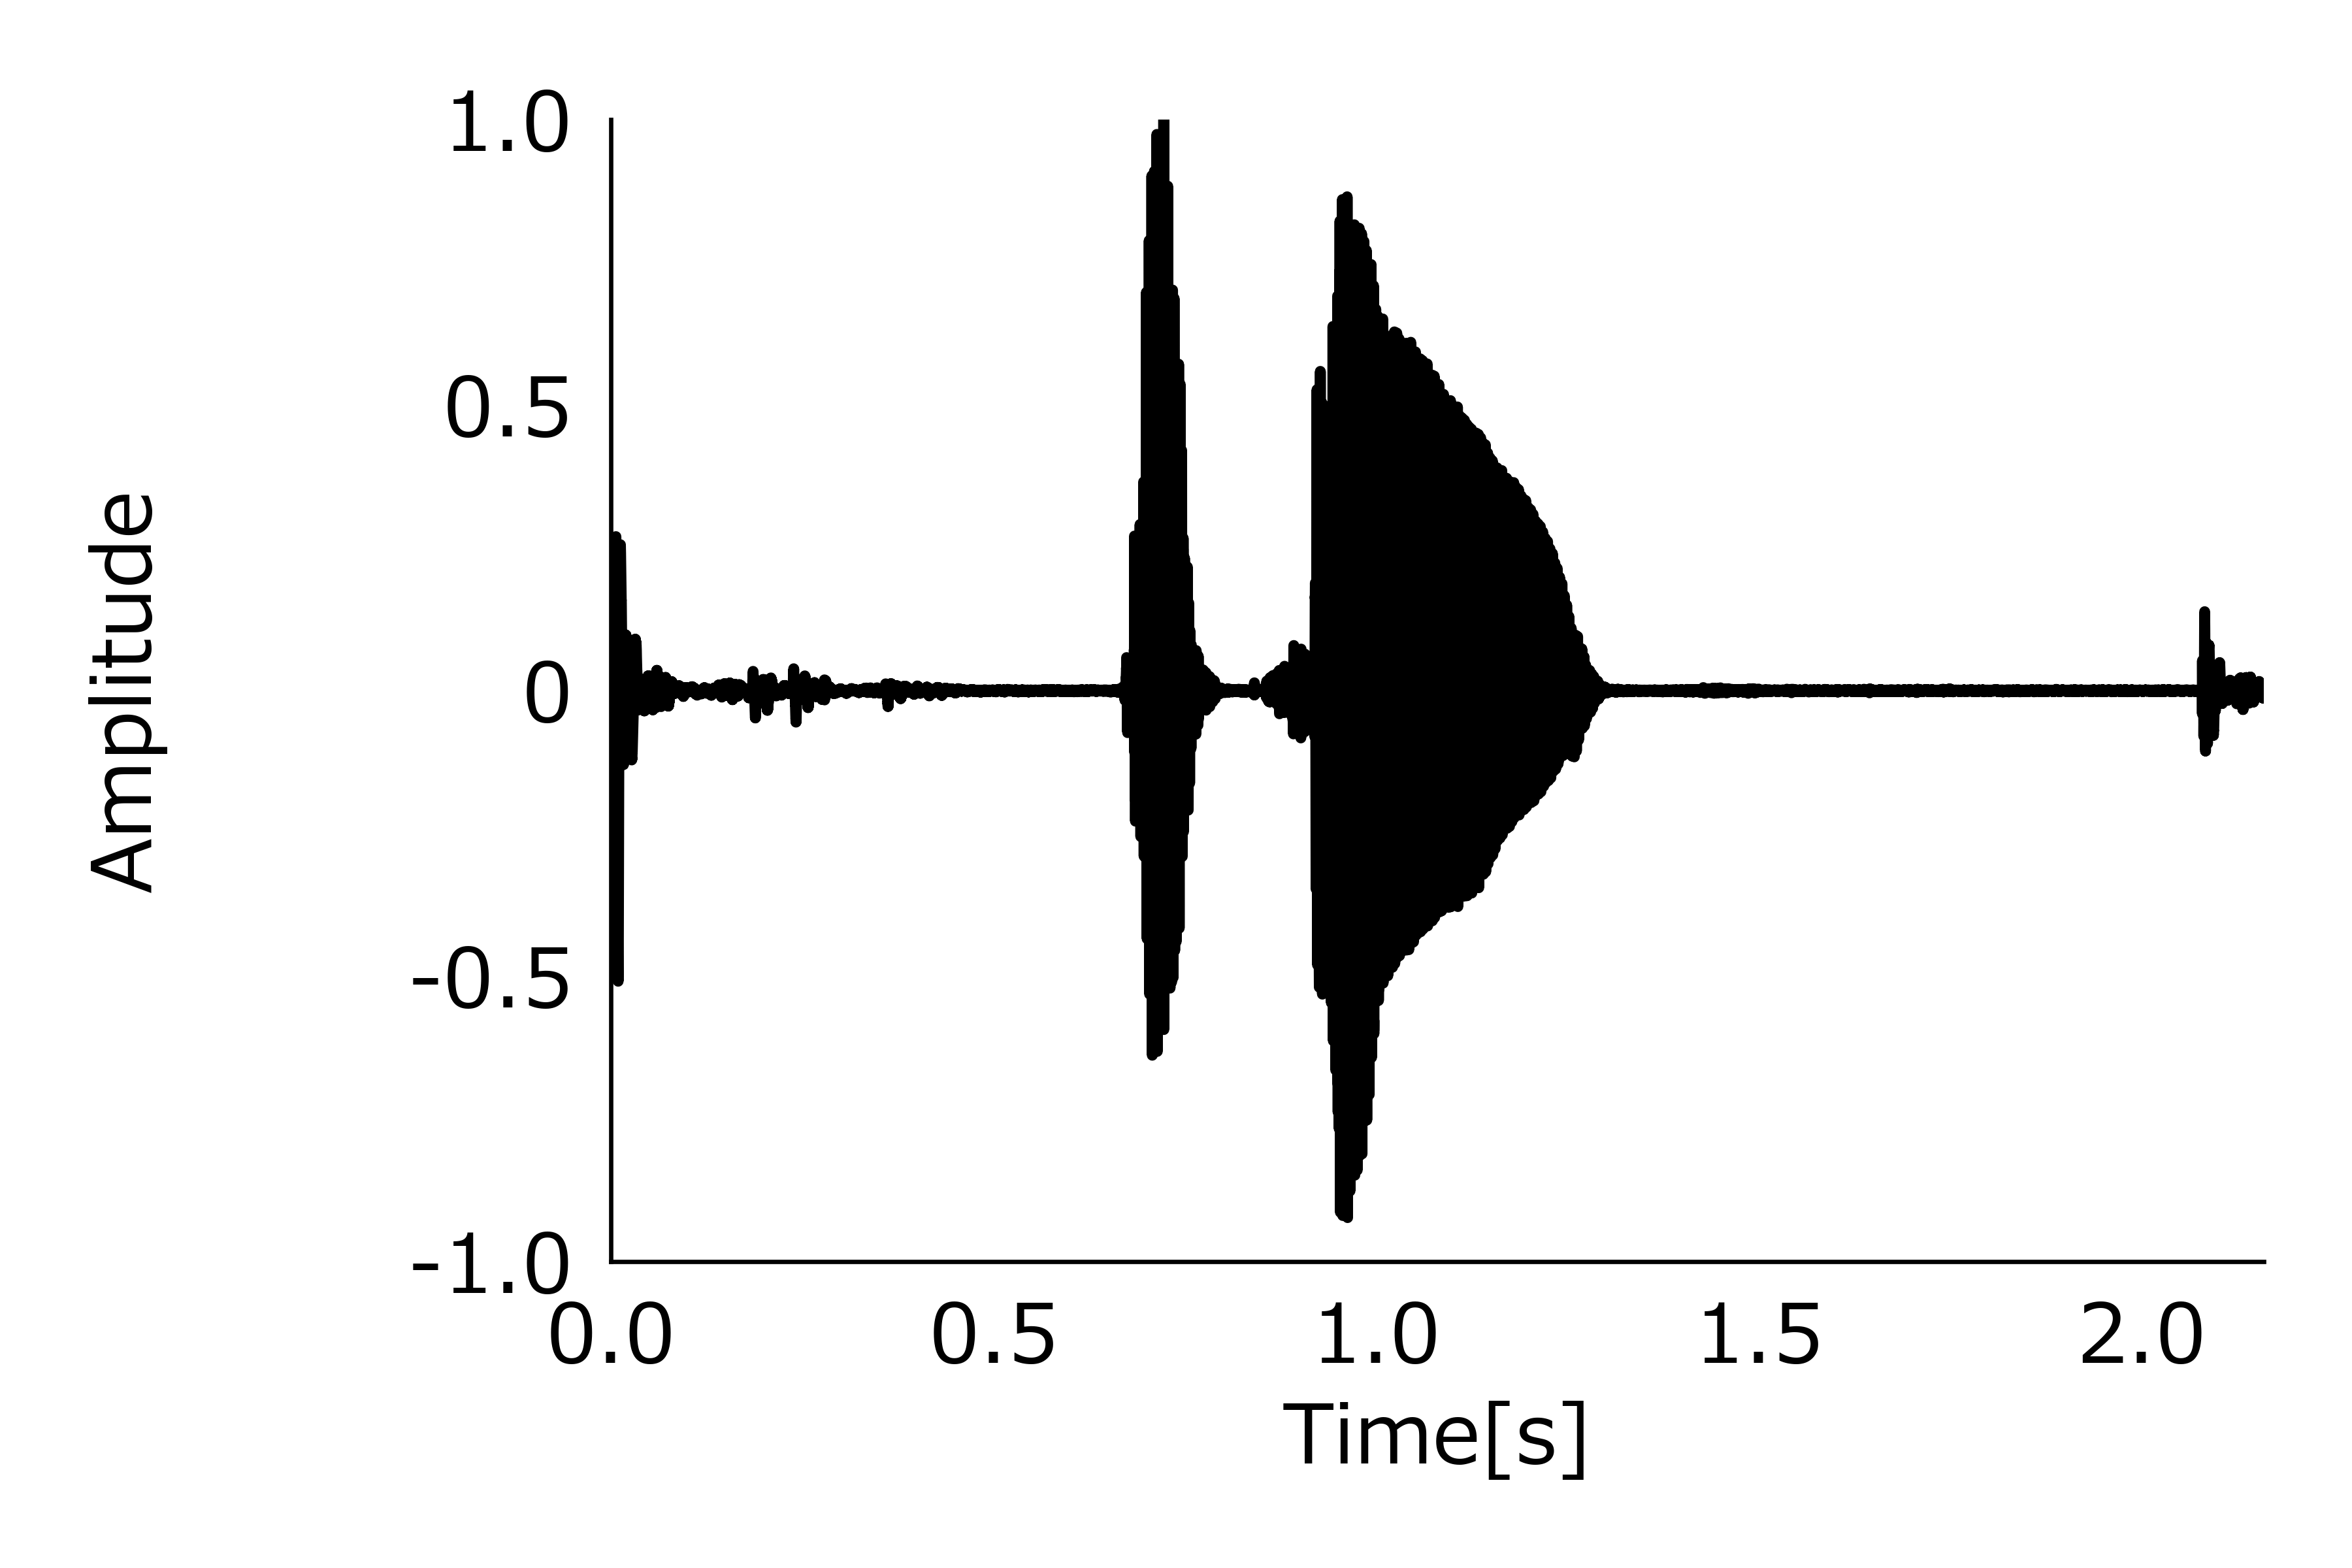
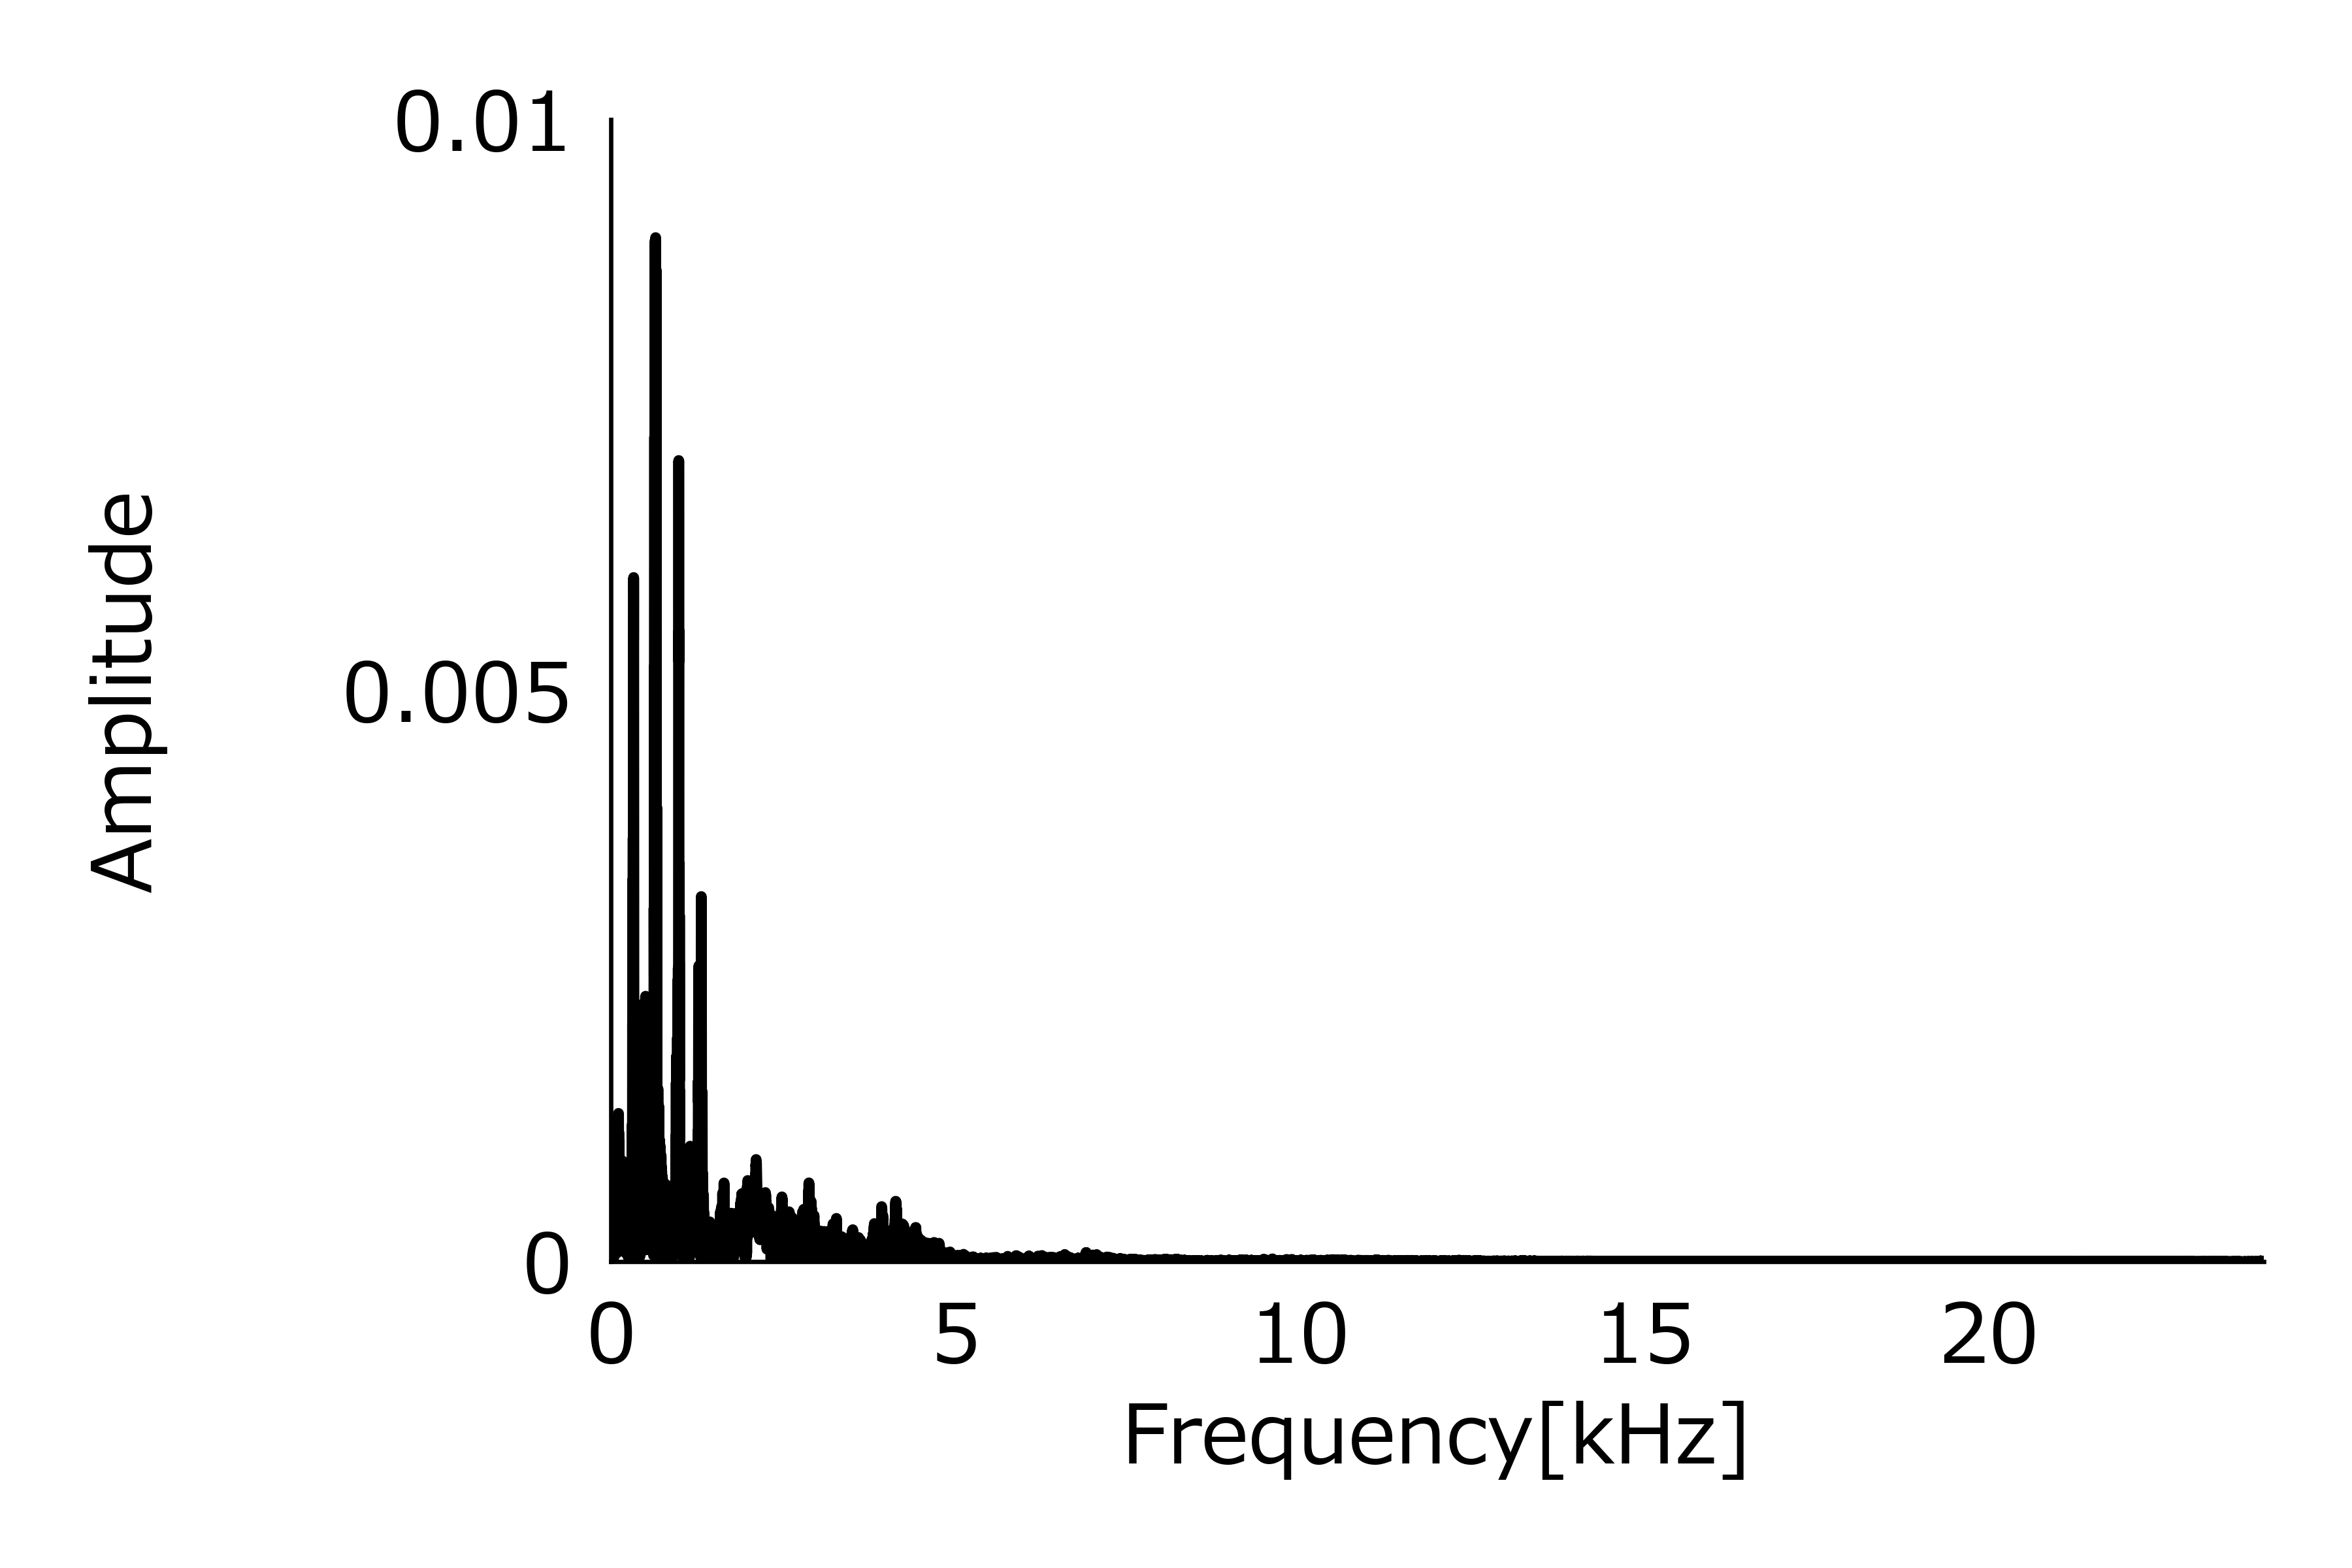
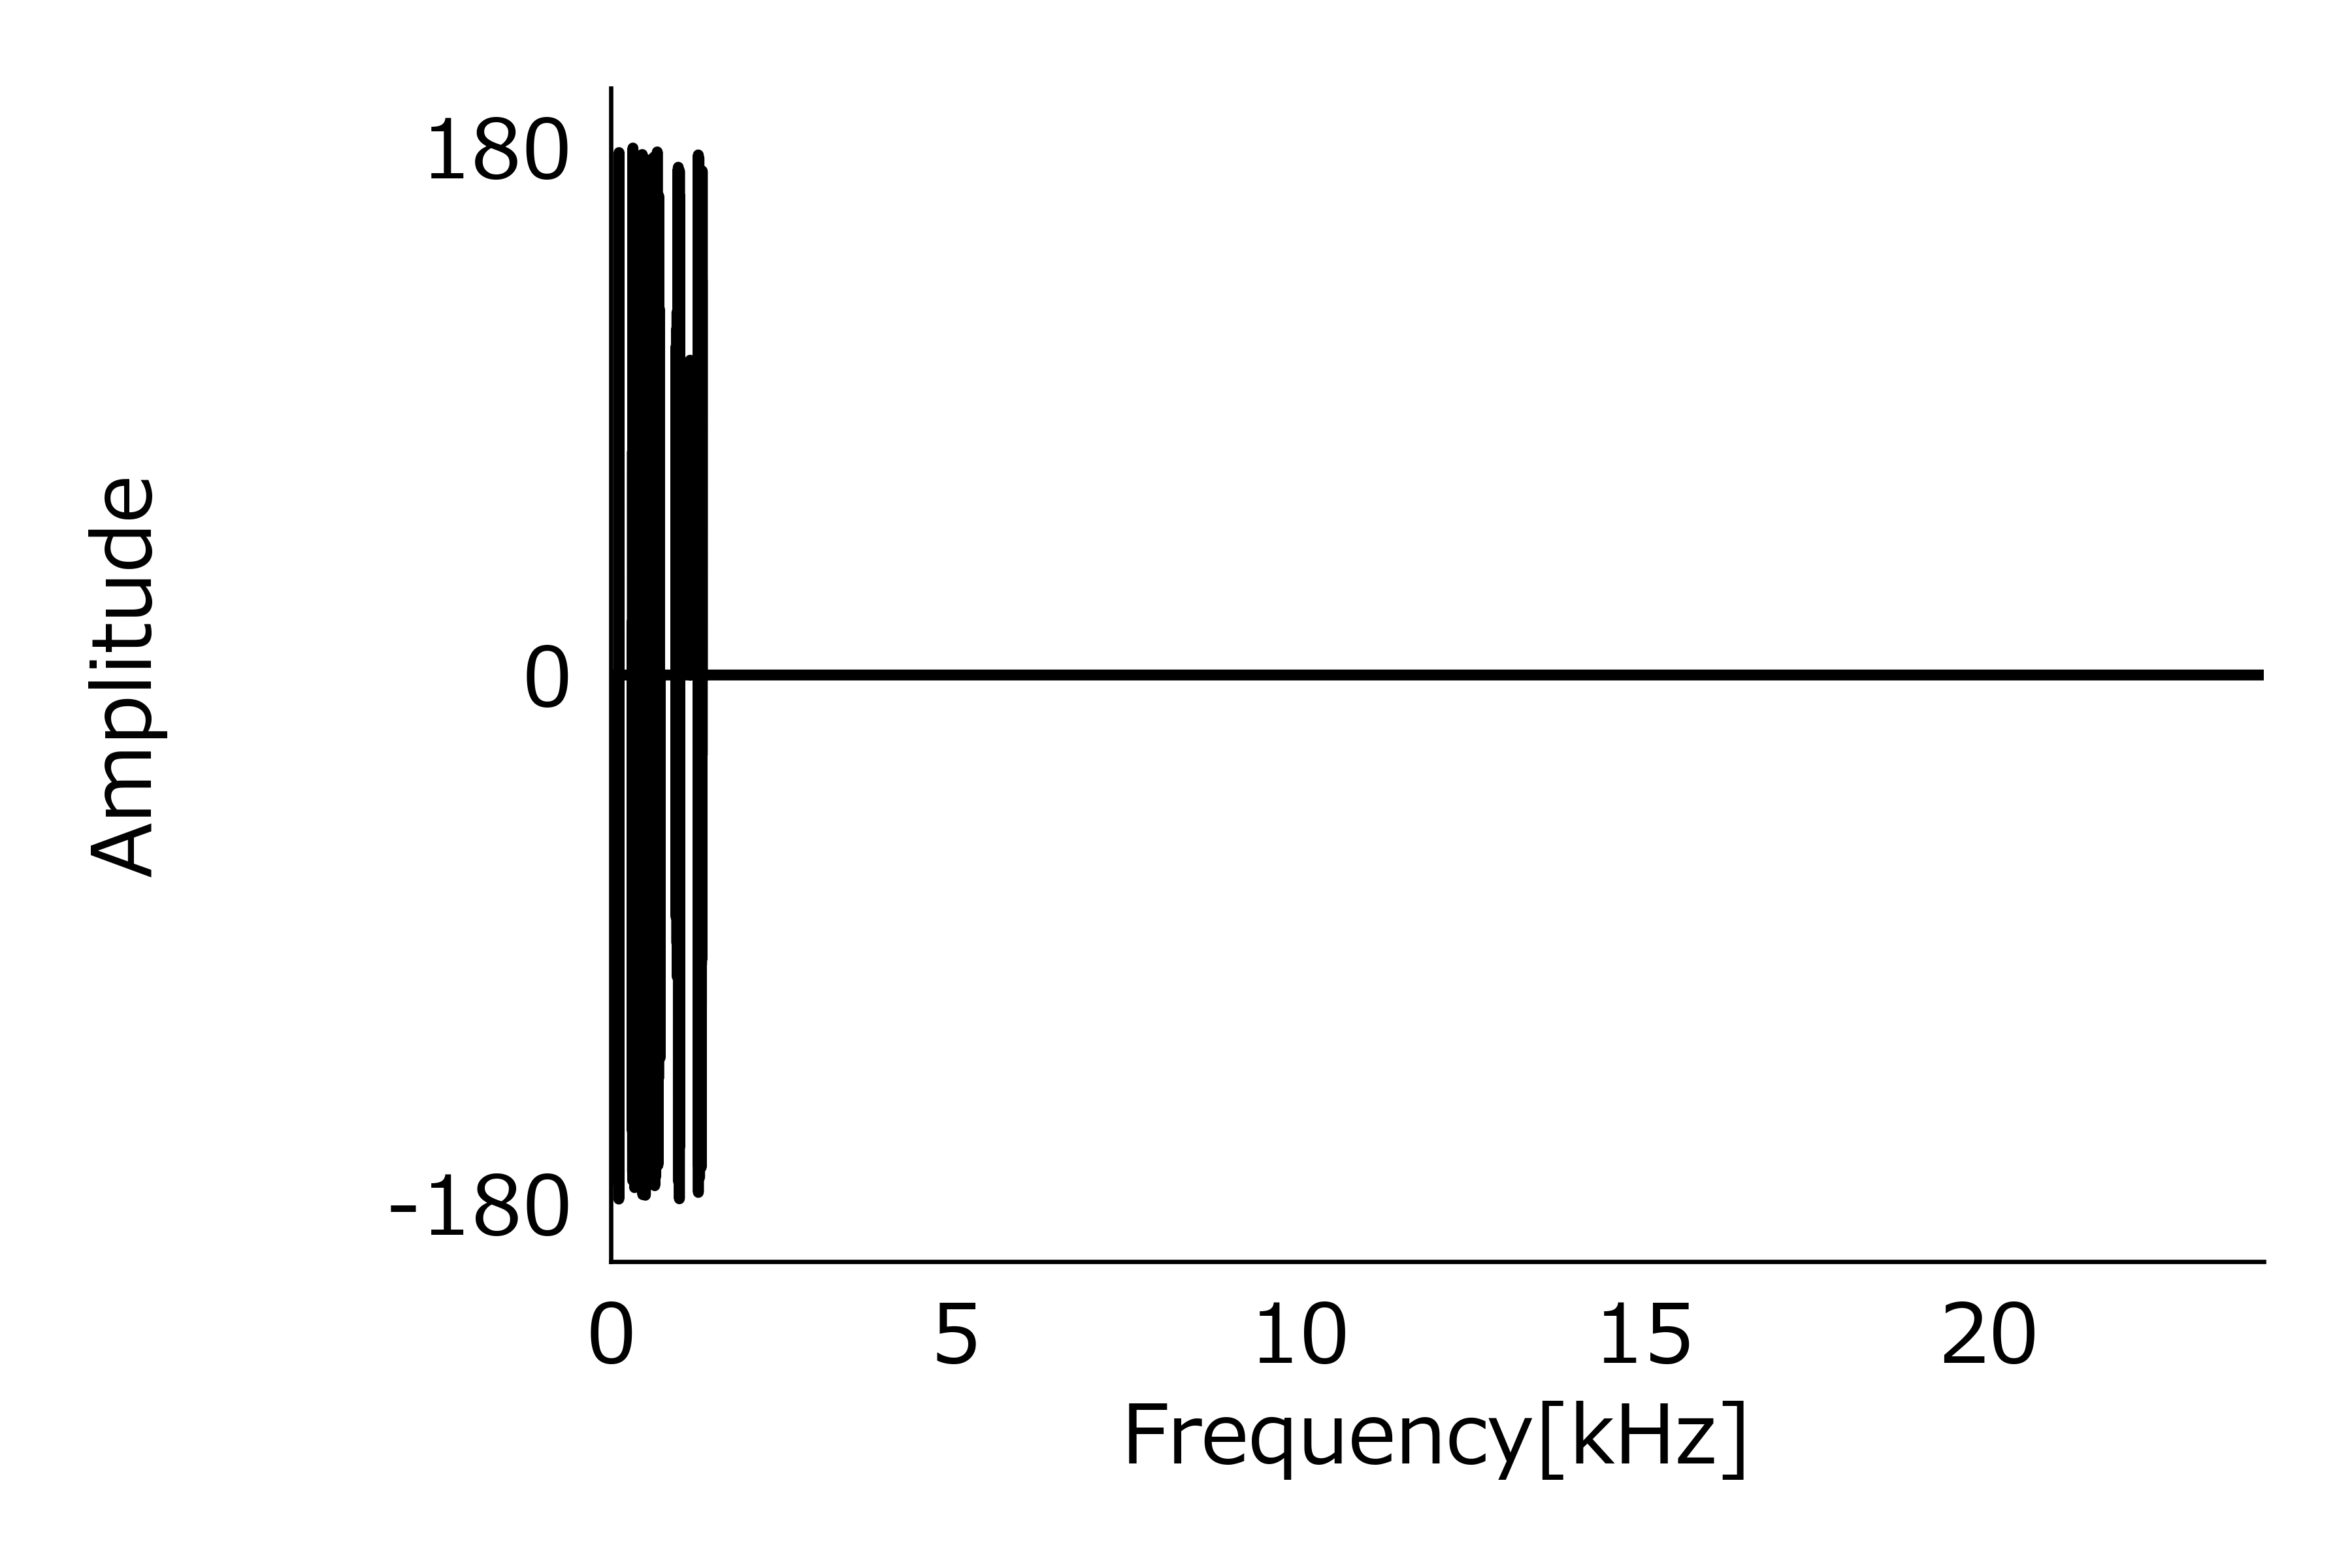
例えば,以下のようなコードを実行してみましょう.
from scipy.fft import fft, ifft, fftfreq
import numpy as np
import soundfile as sf


[signal, fs] = sf.read('F2_happy_15_R.wav')
signal = signal[:,1]
signal = signal / max(signal)

N = len(signal)
T = N / fs

dT = 1.0 / fs

time_array = np.linspace(0.0, N*dT, N, endpoint=False)

fft_result = fft(signal)

amp = np.abs(fft_result / N)

deg = np.rad2deg(np.angle( fft_result ))
deg[amp < 1e-3] = 0

freq = fftfreq(N, dT)

import matplotlib.pyplot as plt
import matplotlib as mpl
from matplotlib import cycler
colors = ['#000000', '#404040', '#808080', '#C0C0C0', '#FFFFFF']

with mpl.rc_context({'lines.linewidth': 2,
                     'lines.linestyle': '-',
                     'font.family': 'Meiryo',
                     'font.size': 15,
                     'axes.spines.left': True,
                     'axes.spines.bottom': True,
                     'axes.spines.top': False,
                     'axes.spines.right': False,
                     'axes.prop_cycle': cycler(color=colors),
                     'axes.xmargin': 0,
                     'axes.ymargin': 0,
                     'axes.autolimit_mode': 'round_numbers',
                     'xtick.top': False,
                     'xtick.bottom': False,
                     'ytick.left': False,
                     'ytick.right': False,
                     'figure.autolayout': True,
                     'figure.constrained_layout.use': False,
                     'figure.figsize': (6,4),
                     }):
    fig = plt.figure()
    ax = fig.add_subplot()
    ax.plot(time_array, signal)
    ax.set_aspect('auto')
    plt.xlabel('Time[s]')
    plt.ylabel('Amplitude')
    plt.xlim(0, max(time_array))
    plt.yticks([-1, -0.5, 0, 0.5, 1],
                ['-1.0', '-0.5', '            0', '0.5', '1.0'])
    plt.show()

    fig = plt.figure()
    ax = fig.add_subplot()
    ax.plot(freq[0:N//2]/1e3, amp[0:N//2])
    ax.set_aspect('auto')
    plt.xlabel('Frequency[kHz]')
    plt.ylabel('Amplitude')
    plt.xlim(0, max(freq[0:N//2]/1e3))
    plt.yticks([0, 0.005, 0.01],
                ['            0', '0.005', '0.01'])
    plt.show()

    fig = plt.figure()
    ax = fig.add_subplot()
    ax.plot(freq[0:N//2]/1e3, deg[0:N//2])
    ax.set_aspect('auto')
    plt.xlabel('Frequency[kHz]')
    plt.ylabel('Amplitude')
    plt.xlim(0, max(freq[0:N//2]/1e3))
    plt.yticks([-180, 0, 180],
                ['-180', '            0', '180'])
    plt.show()
たくさん画像が生成されました,うれしいですね.
Detai Xin, Detai Xin, Detai Xin, CC BY-SA 4.0(https://creativecommons.org/licenses/by-sa/4.0/), 'JNV: Japanese Nonverbal Vocalization corpus(日本語非言語音声コーパス)'の音源を用いて,
図の調整を行ってみました.
最後に.
次の記事でお会いしましょう!
失礼します.
