import yfinance as yf
import matplotlib.pyplot as plt
import mplfinance.original_flavor as mpl
import streamlit as st
import pandas as pd
# 銘柄指定
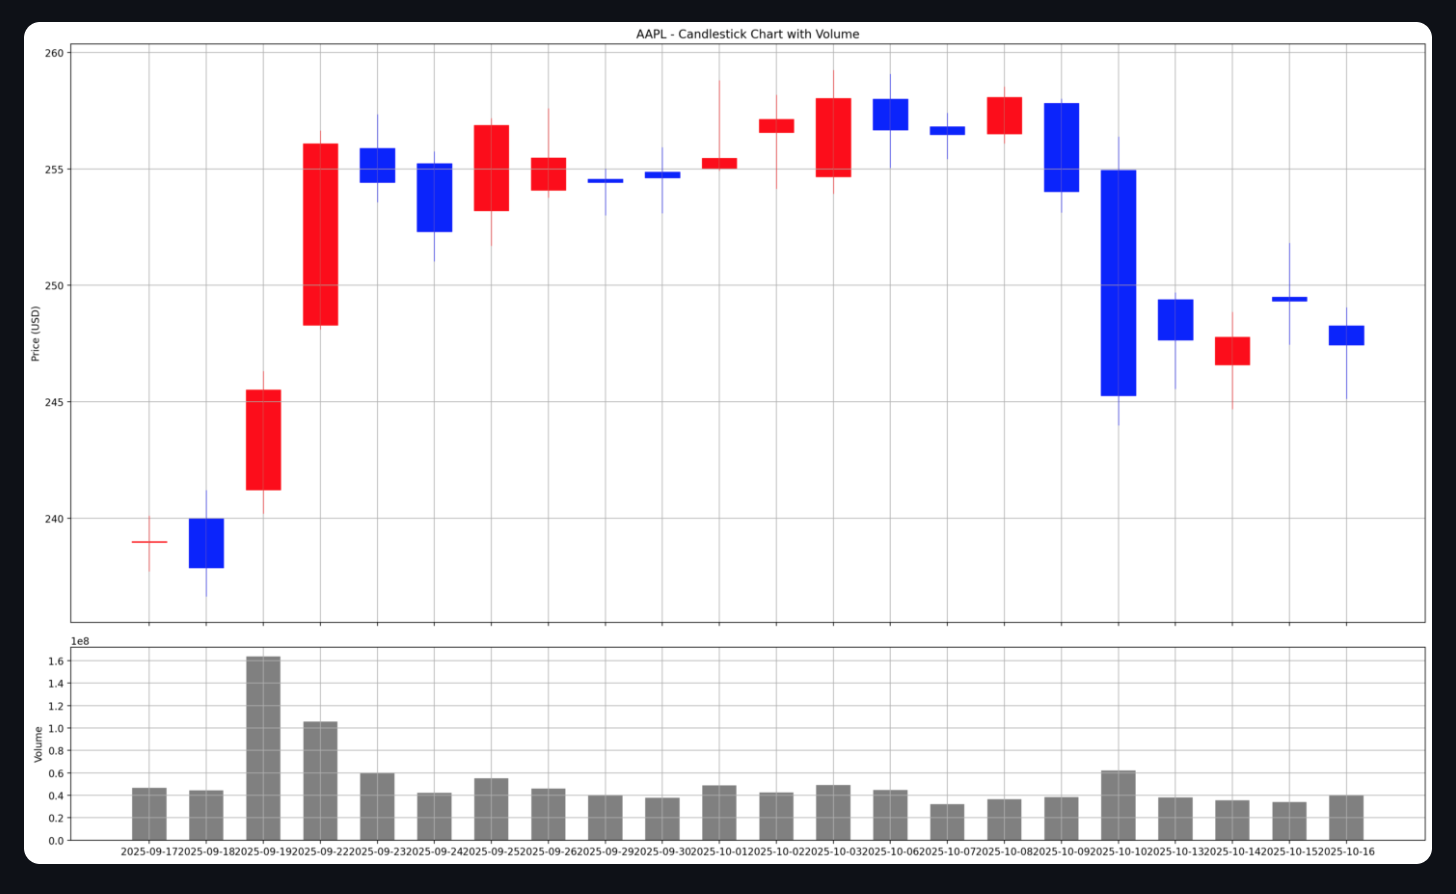
ticker = "AAPL"
stock = yf.download(ticker)
# データ取得チェック
if stock.empty:
st.error("データが取得できませんでした。")
st.stop()
# 必要な列のみ取得
ohlc = stock[['Open', 'High', 'Low', 'Close']].copy()
# Volume列は Series のまま別に処理
volume = stock['Volume'].squeeze()#S.fillna(0).astype(int)
print(type(volume)) # <class 'pandas.Series'> が出ればOK
# インデックス(日付)を列に戻す
ohlc.reset_index(inplace=True)
#volume = volume.reset_index(drop=True) # volume もリセット
#print(type(volume)) # <class 'pandas.Series'> が出ればOK
# X軸用インデックス列
ohlc['Index'] = range(len(ohlc))
# グラフ作成
fig, (ax1, ax2) = plt.subplots(2, 1, figsize=(20, 12), sharex=True, gridspec_kw={'height_ratios': [3, 1]})
# ローソク足
mpl.candlestick_ohlc(
ax1,
ohlc[['Index', 'Open', 'High', 'Low', 'Close']].values,
width=0.6,
colorup='r',
colordown='b'
)
# X軸(日付)ラベル設定
ax1.set_xticks(ohlc['Index'].tolist())
ax1.set_xticklabels(ohlc['Date'].dt.strftime('%Y-%m-%d').tolist(), rotation=90)
ax1.set_ylabel("Price (USD)")
ax1.set_title(f"{ticker} - Candlestick Chart with Volume")
ax1.grid(True)
# 出来高(Volume)バーグラフ
ax2.bar(
ohlc['Index'].tolist(),
volume.tolist(),
color='gray',
width=0.6
)
ax2.set_ylabel("Volume")
ax2.grid(True)
plt.tight_layout()
st.pyplot(fig)