

はじめに
本記事は OCI Compute のカスタムメトリクス取得方法 - Management Agent Plugin 編 です。
カスタムメトリクス取得方法の概要については以下記事を参照してみてください。
メトリクスを収集するサービスとしては Prometheus Node Exporter を使います。
使用方法(デモ)
検証構成
検証構成図は以下の通りです。
なお、以下リソースは作成済みで進めていきます。
- NWリソース
- OCI Bastion
- OCI Compute インスタンス
- IAM ポリシー
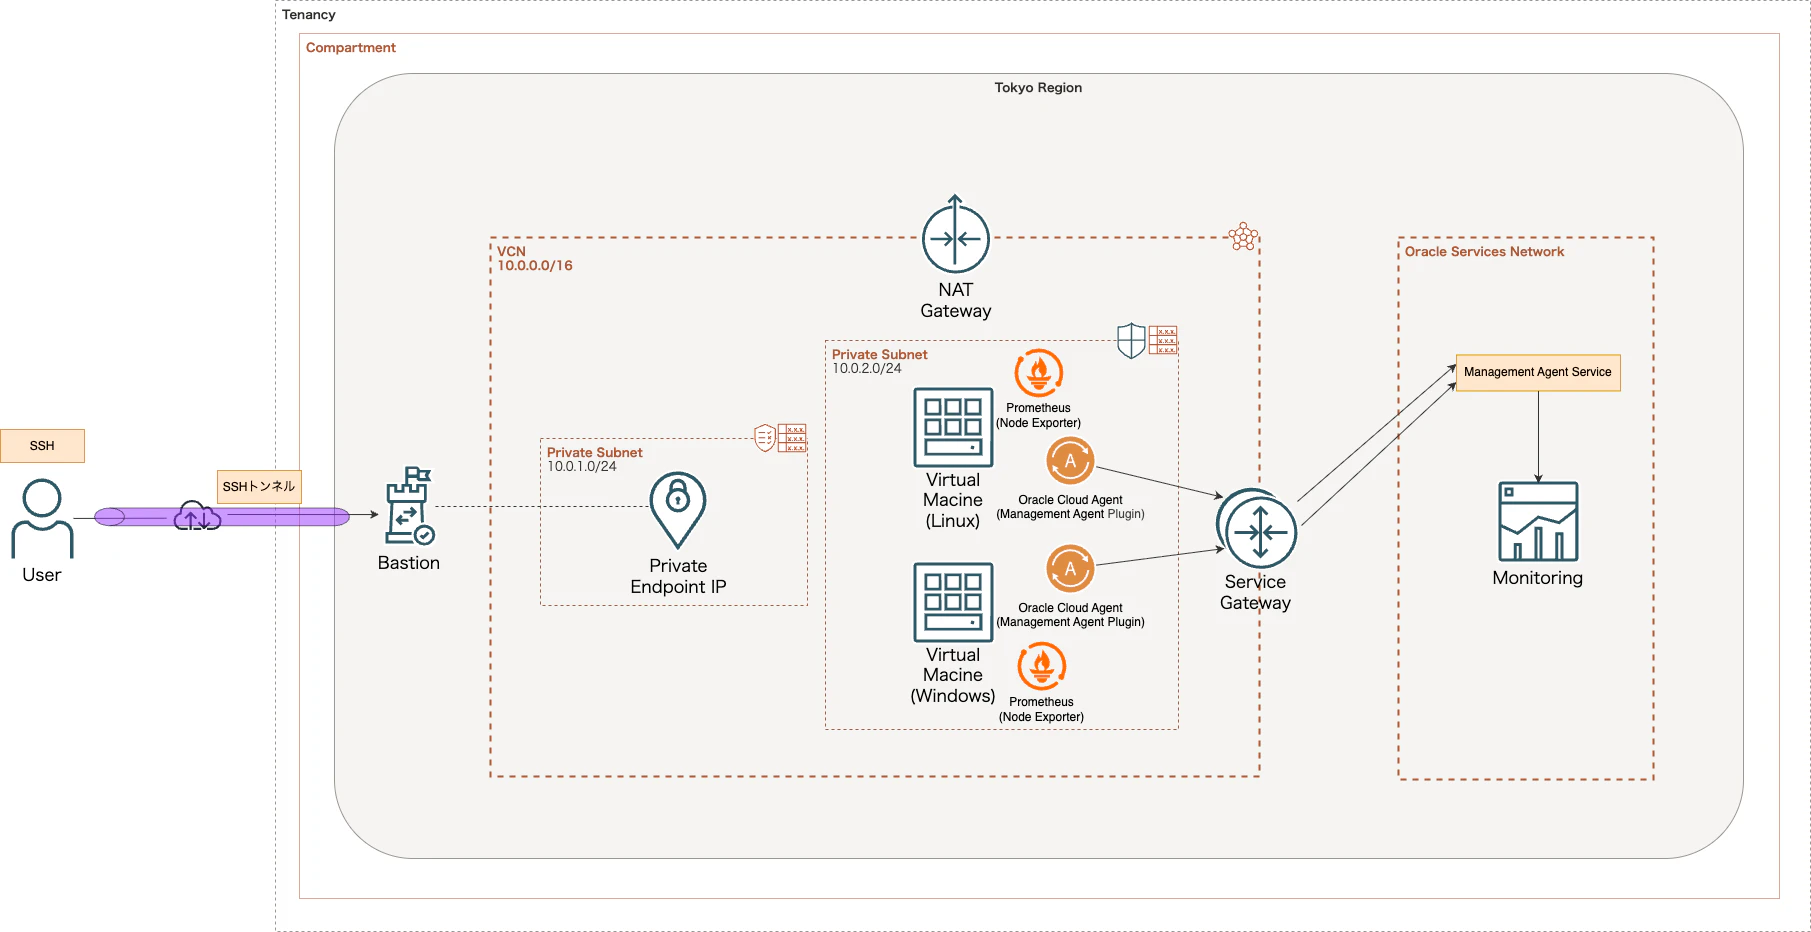
検証では、以下実施していきます。
- Prometheus Node Exporter セットアップ
- エージェントデータソース作成
- 環境コードは以下 GitHub にあげてますので、よかったら覗いてみてください
前提条件確認
以下設定項目は、後述するエージェント構成に加えて設定する必要があります。
- IAM ポリシー
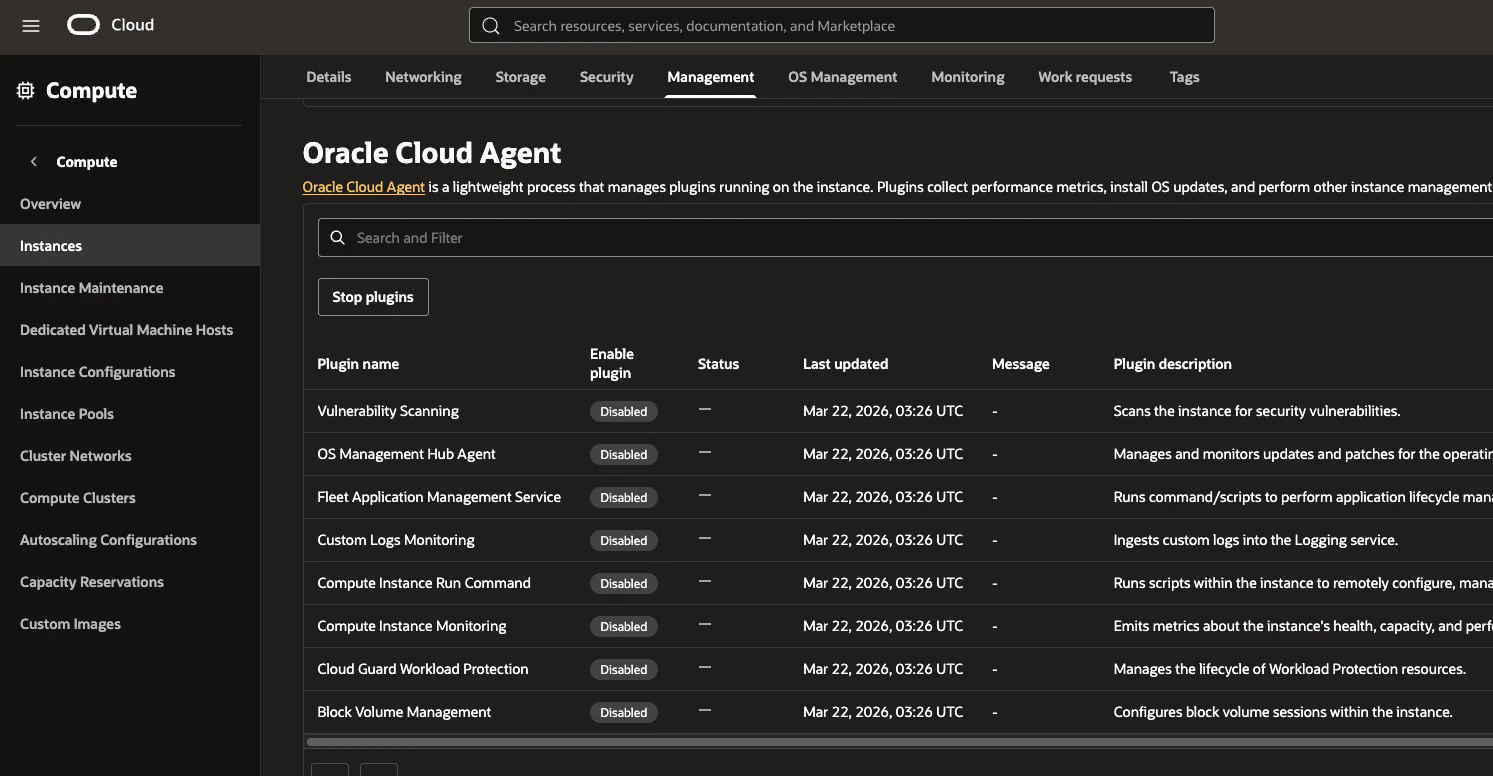
- Oracle Cloud Agent の Management Agent Plugin の有効化
- OCI Management Agents への疎通性
IAM ポリシー
動的グループ (Management Agents サービス) に、use metrics 権限を付与する必要があります。
本検証では以下のポリシーを作成しています。
allow dynamic-group Management_Agents_Dynamic_Group to use metrics in compartment oci-compute-custom-metrics-broadcast-management-agent-plugin
上記権限により、Management Agents Service が OCI Monitoring にメトリクスをプッシュすることが可能となります。
Oracle Cloud Agent の Management Agent Plugin の有効化
OS に関係なく、Management Agent Plugin が有効化されており、Running 状態である必要があります。
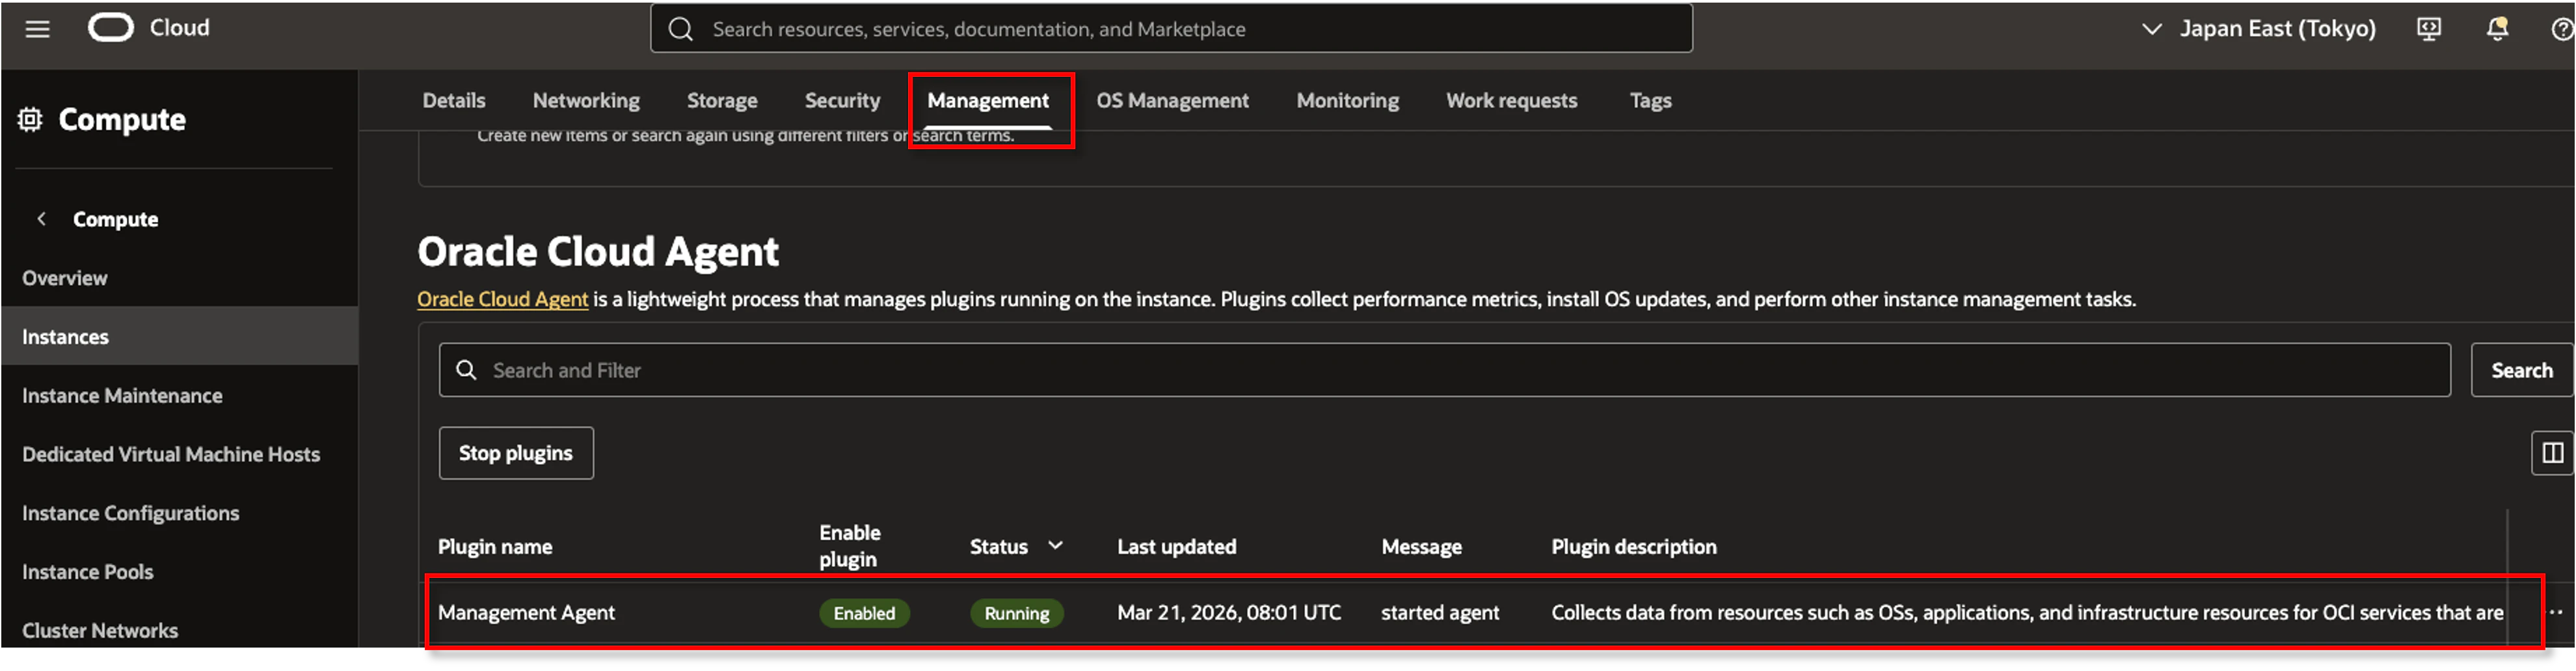
- Windows Server はデフォルトで該当プラグインが入っていないので、別途インストールする必要があります ( 番外編 に記載しています )
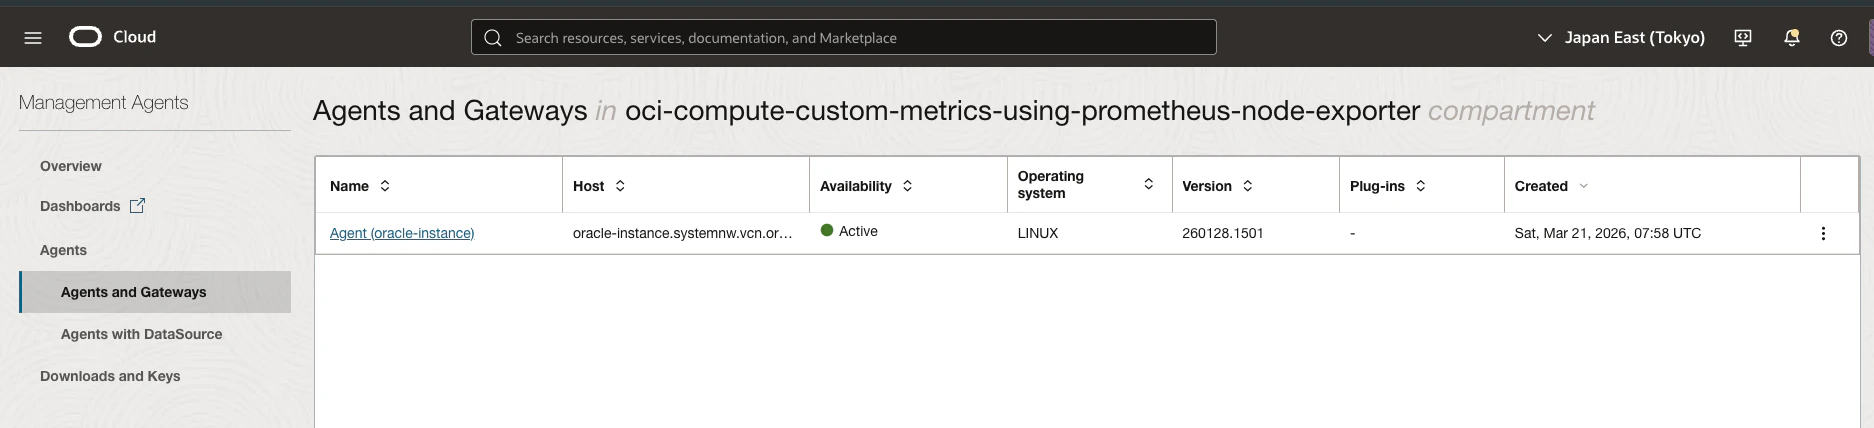
また、インスタンス内の Management Agent Plugin が Management Agents Service と疎通が取れていること (Active) も必要となります。
-
Management Agents Serviceへの疎通は、インスタンス内のManagement Agent PluginからOracle Services Networkへの通信が通るようになっていればOKです
- 上記疎通性以外にハマりポイントがあったので、番外編 に記載してます
OCI Management Agents への疎通性
インスタンス内で稼働している Management Agent Plugin からの カスタムメトリクス出力 には、プラグインから Oracle Services Network に所属する OCI Management Agents への疎通性が必要となります。
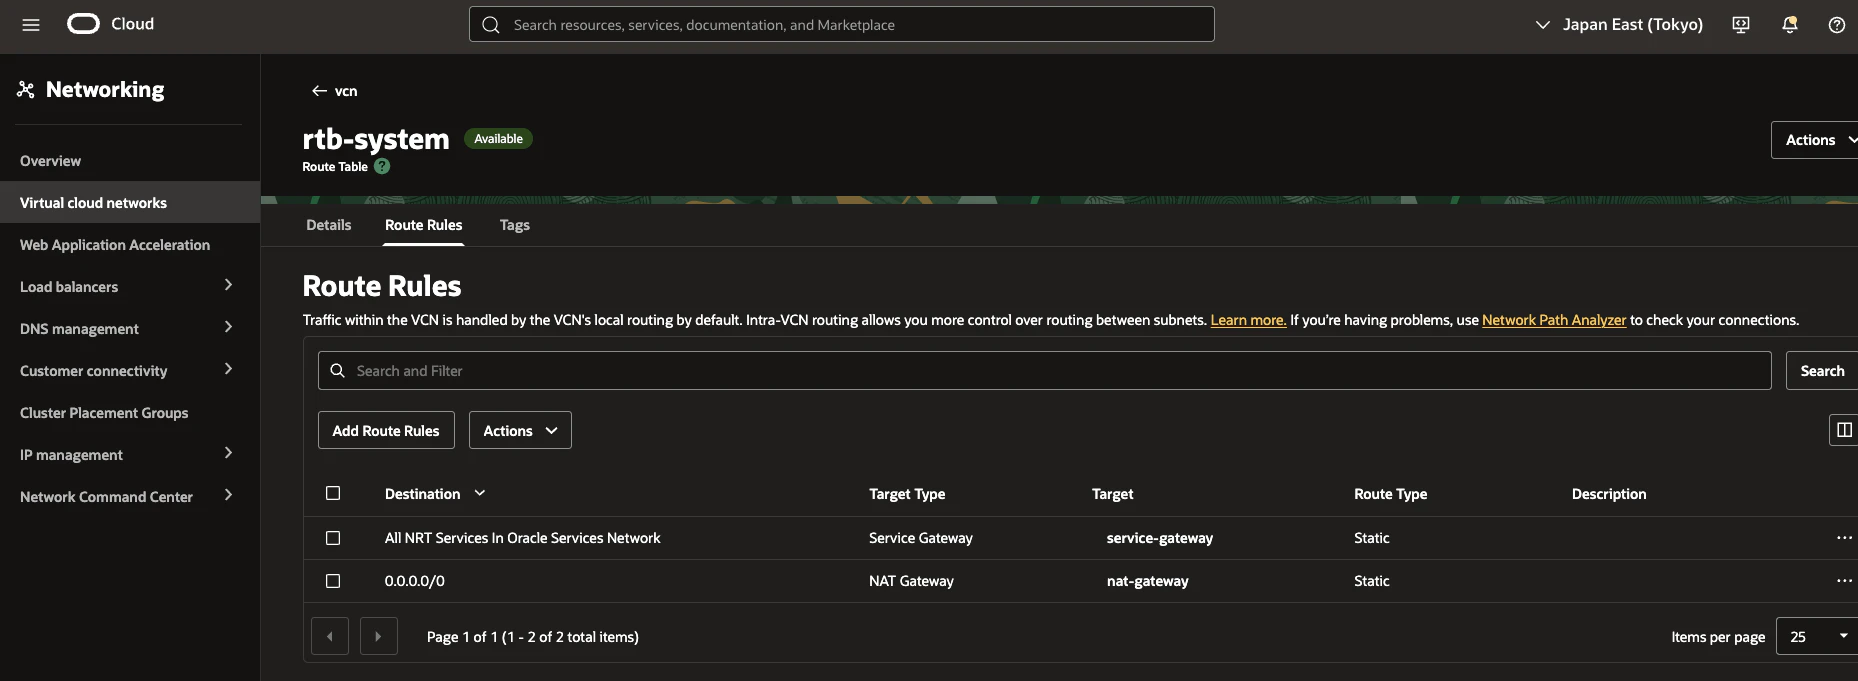
本構成は以下の通り、インスタンスが所属するプライベートネットワークのルートテーブルに Service Gateway をネクストホップとするルートを設定しています。
-
NAT Gateway宛もありますが、こちらは後述の手順にてインターネットと通信が必要なため追加しています - 正直、
NAT Gatewayで外に抜けられるのであれば、Oracle Services Network宛のTCP/443を個別に登録する必要はありません
Prometheus Node Exporter セットアップ
Linux 編
まず、インスタンス内に Prometheus Node Exporter を配置します。
以降は、root ユーザーで実施します。
以下リリースノートから最新版を取得します。
検証インスタンスは Oracle Linux で CPU が AMD なので node_exporter-1.10.2.linux-amd64.tar.gz を取得します。
# pwd
/root

# wget https://github.com/prometheus/node_exporter/releases/download/v1.10.2/node_exporter-1.10.2.linux-amd64.tar.gz

# ls -al
-rw-r--r--   1 root root 11686705 10月 26 05:10 node_exporter-1.10.2.linux-amd64.tar.gz
続いて解凍します。
# tar xvfz node_exporter-1.10.2.linux-amd64.tar.gz

# cd node_exporter-1.10.2.linux-amd64

# ls -al
合計 22404
drwxr-xr-x  2 1001 1002       56 10月 26 05:10 .
dr-xr-x---. 4 root root     4096  3月 22 15:23 ..
-rw-r--r--  1 1001 1002    11357 10月 26 05:10 LICENSE
-rw-r--r--  1 1001 1002      463 10月 26 05:10 NOTICE
-rwxr-xr-x  1 1001 1002 22919216 10月 26 05:06 node_exporter
node_exporter バイナリファイルがあるので、任意の場所に移動させます。
今回は /usr/local/bin 配下に移動させます。
# mv /root/node_exporter-1.10.2.linux-amd64/node_exporter /usr/local/bin/

# ls -al /usr/local/bin/
合計 22384
drwxr-xr-x.  2 root root       27  3月 22 15:31 .
drwxr-xr-x. 12 root root      131  1月  9 03:36 ..
-rwxr-xr-x   1 1001 1002 22919216 10月 26 05:06 node_exporter
続いて専用のシステムユーザーを作成し、先程のバイナリファイルの所有権を変更します。
# useradd -s /sbin/nologin -M node_exporter
# chown node_exporter:node_exporter /usr/local/bin/node_exporter
# ls -al /usr/local/bin/node_exporter
-rwxr-xr-x 1 node_exporter node_exporter 22919216 10月 26 05:06 /usr/local/bin/node_exporter
今回はあえて、Socket ファイルでの起動にします。
まず socket ファイルを作成します。
[Unit]
# このソケットユニットの説明(systemctl status で表示される)
Description=Node Exporter

[Socket]
# TCPポート9100番(デフォルト)で待ち受けする設定
# systemd自身がこのポートをlistenする(node_exporterではない)
# 接続が来たタイミングで対応する .service を起動する(socket activation)
ListenStream=9100

# (補足)
# ListenStream は TCP 用
# UNIXソケットの場合は ListenStream=/path/to/socket も指定可能

[Install]
# sockets.target が起動するタイミングでこのソケットを有効化する
# → systemctl enable すると OS起動時に自動でlisten開始される
WantedBy=sockets.target
続いてソケットがリクエストを受信したら起動させるサービスを作成します。
[Unit]
# サービスの説明(systemctl status などで表示される)
Description=Node Exporter

# node_exporter.socket が必ず一緒に起動/停止されるようにする
Requires=node_exporter.socket

[Service]
# 実行ユーザー(rootではなく専用ユーザーでセキュアに動かす)
User=node_exporter

# OPTIONS という環境変数を空で初期化(EnvironmentFileが無い場合の保険)
Environment=OPTIONS=

# 環境変数ファイルを読み込む(無くてもエラーにしない「-」付き)
# 例:OPTIONS="--web.listen-address=:9100"
EnvironmentFile=-/etc/sysconfig/node_exporter

# 起動コマンド
# --web.systemd-socket を指定すると、systemdのsocketユニット経由で待ち受けする
# $OPTIONS は上記の環境変数から展開される
ExecStart=/usr/local/bin/node_exporter --web.systemd-socket $OPTIONS

[Install]
# 通常のターゲット(multi-user.target)で有効化される設定
# ただし socket activation の場合は .socket 側を enable するのが一般的
WantedBy=multi-user.target
続いて OPTIONS を指定するための、sysconfig ファイルを作成します。
一旦デフォルトで取得するメトリクスを無効化し、CPU / メモリ / ファイルシステム / ユニット を取得するようにしています。
ユニットは数が多いので、Nginx のみにフィルタリングしています。
OPTIONS="--collector.disable-defaults --collector.cpu --collector.meminfo --collector.filesystem --collector.systemd --collector.systemd.unit-include=(nginx)\.service"
ソケットを自動起動設定にします。
# systemctl enable --now node_exporter.socket
Created symlink /etc/systemd/system/sockets.target.wants/node_exporter.socket → /etc/systemd/system/node_exporter.socket.

# systemctl status node_exporter.socket
● node_exporter.socket - Node Exporter
     Loaded: loaded (/etc/systemd/system/node_exporter.socket; enabled; preset: disabled)
     Active: active (listening) since Sun 2026-03-22 17:05:43 JST; 1min 11s ago
      Until: Sun 2026-03-22 17:05:43 JST; 1min 11s ago
   Triggers: ● node_exporter.service
     Listen: [::]:9100 (Stream)
      Tasks: 0 (limit: 46977)
     Memory: 8.0K (peak: 256.0K)
        CPU: 336us
     CGroup: /system.slice/node_exporter.socket

 3月 22 17:05:43 oracle-instance systemd[1]: Listening on Node Exporter.
最後、メトリクスを収集しているか確認します。
# curl http://localhost:9100/metrics | grep "node_"

  % Total    % Received % Xferd  Average Speed   Time    Time     Time  Current
                                 Dload  Upload   Total   Spent    Left  Speed
  0     0    0     0    0     0      0      0 --:--:-- --:--:-- --:--:--     0# HELP node_disk_device_mapper_info Info about disk device mapper.
# TYPE node_disk_device_mapper_info gauge
node_disk_device_mapper_info{device="dm-0",lv_layer="",lv_name="root",name="ocivolume-root",uuid="LVM-hV0yiIbjEPQ6SFXIWkwyzL0L9mHvOjIktaKk8dxTp94d960fxPCr2t25hlJff5tf",vg_name="ocivolume"} 1
10node_disk_device_mapper_info{device="dm-1",lv_layer="",lv_name="oled",name="ocivolume-oled",uuid="LVM-hV0yiIbjEPQ6SFXIWkwyzL0L9mHvOjIkK3x1Q6MqEUPW0dTrod7DWvLVzSAXTofd",vg_name="ocivolume"} 1
~~~省略~~~
Windows Server 編
まず、インスタンス内に Prometheus Node Exporter を配置します。
Windows は正確に言うと、Windows Exporter を配置します。
以下リリースノートから最新版を取得します。
検証インスタンスは CPU が AMD なので windows_exporter-0.31.5-amd64.msi を取得します。
管理者権限で Powershell を起動し、以下コマンドを実行します。
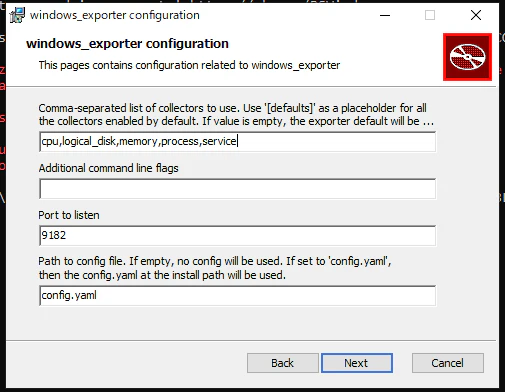
PS C:\Windows\system32> msiexec.exe /i <path-to-msi-file> --% ENABLED_COLLECTORS=cpu,logical_disk,memory,process,service
するとポップアップが出るので次に進みます。
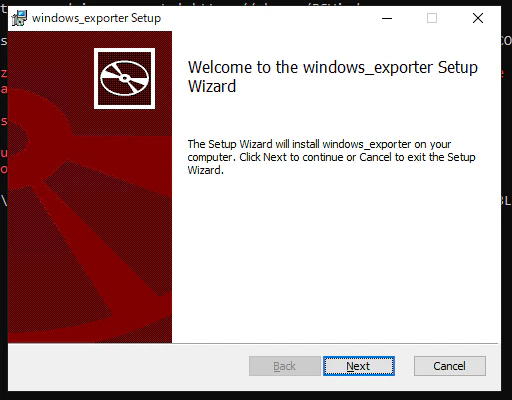
インストール先はデフォルトで進みます。

先程プロンプトで入力したコレクターが入力されていますので、そのまま次へ進み、インストールします。
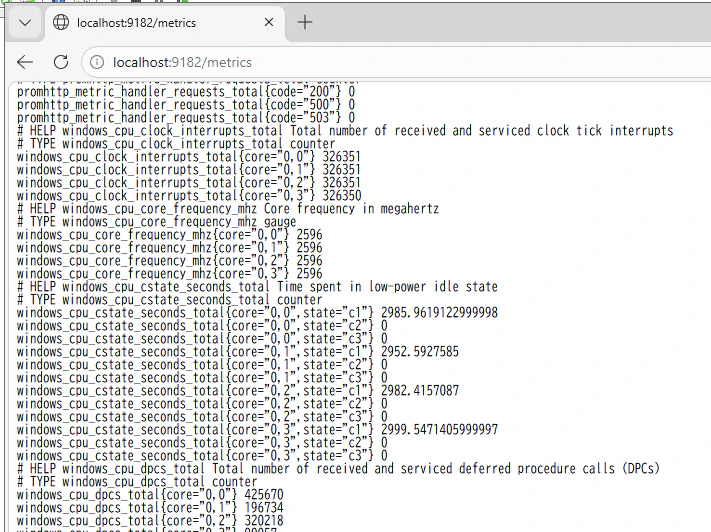
その後、ブラウザにて http://localhost:9182/metrics で呼び出して windows_* が表示されていればOKです。
ちなみに、サービス化されているのが確認できます。

エージェントデータソース作成
Linux 編
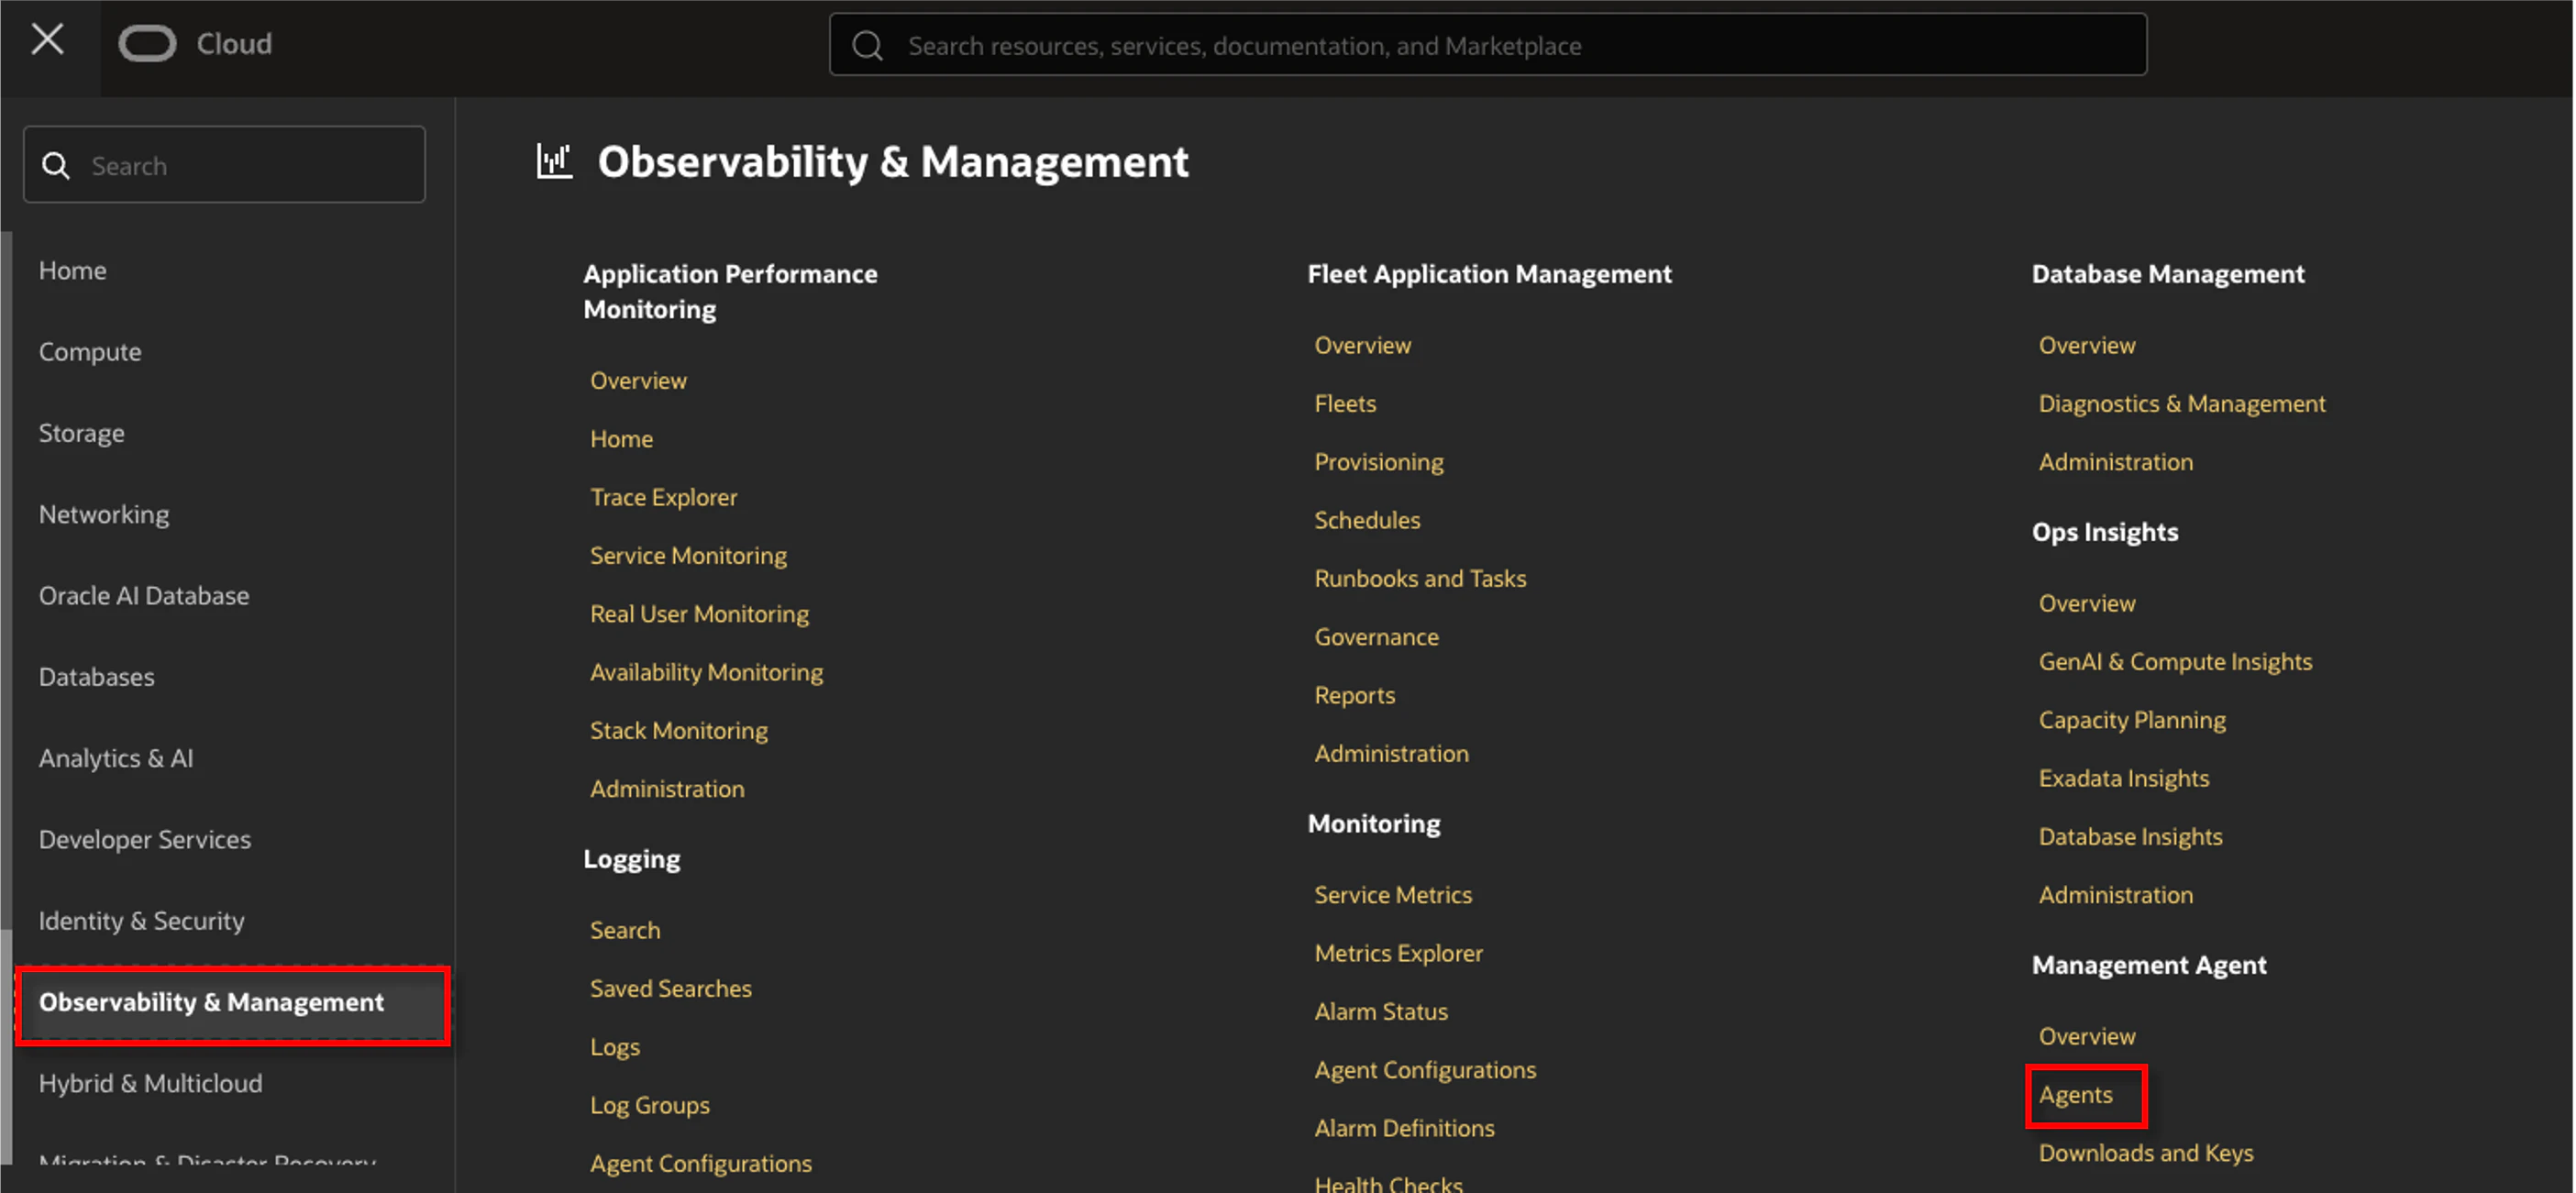
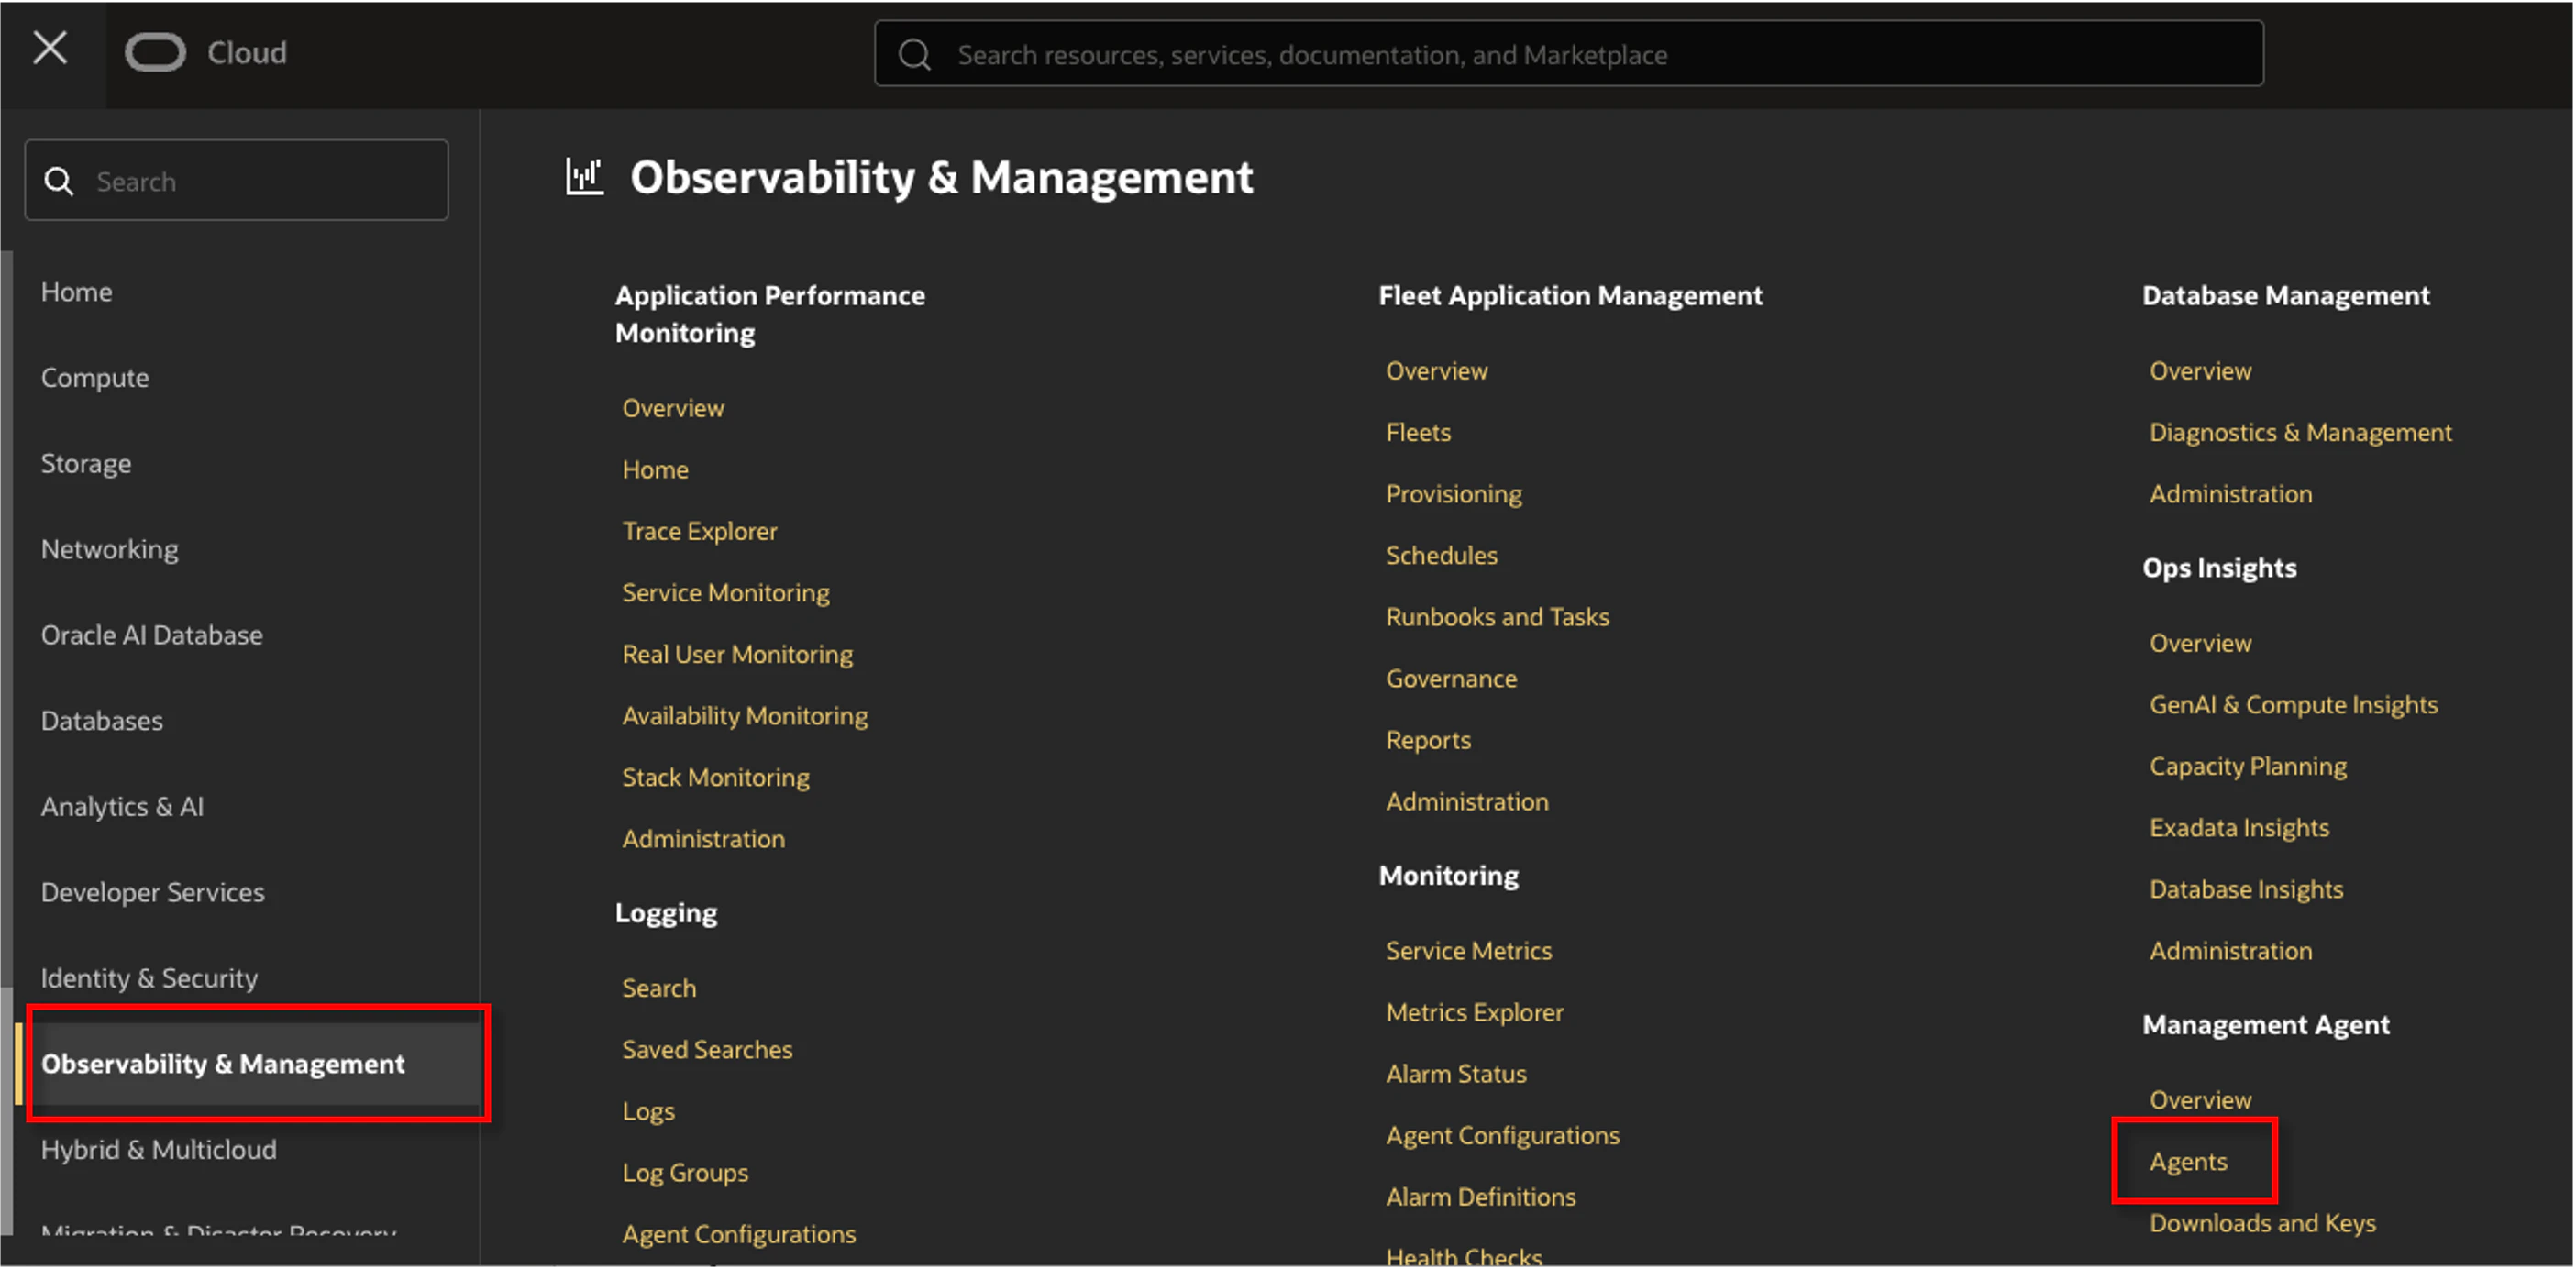
OCI コンソール左上のハンバーガーマークをクリックし、Observability & Management → Agents をクリックします。
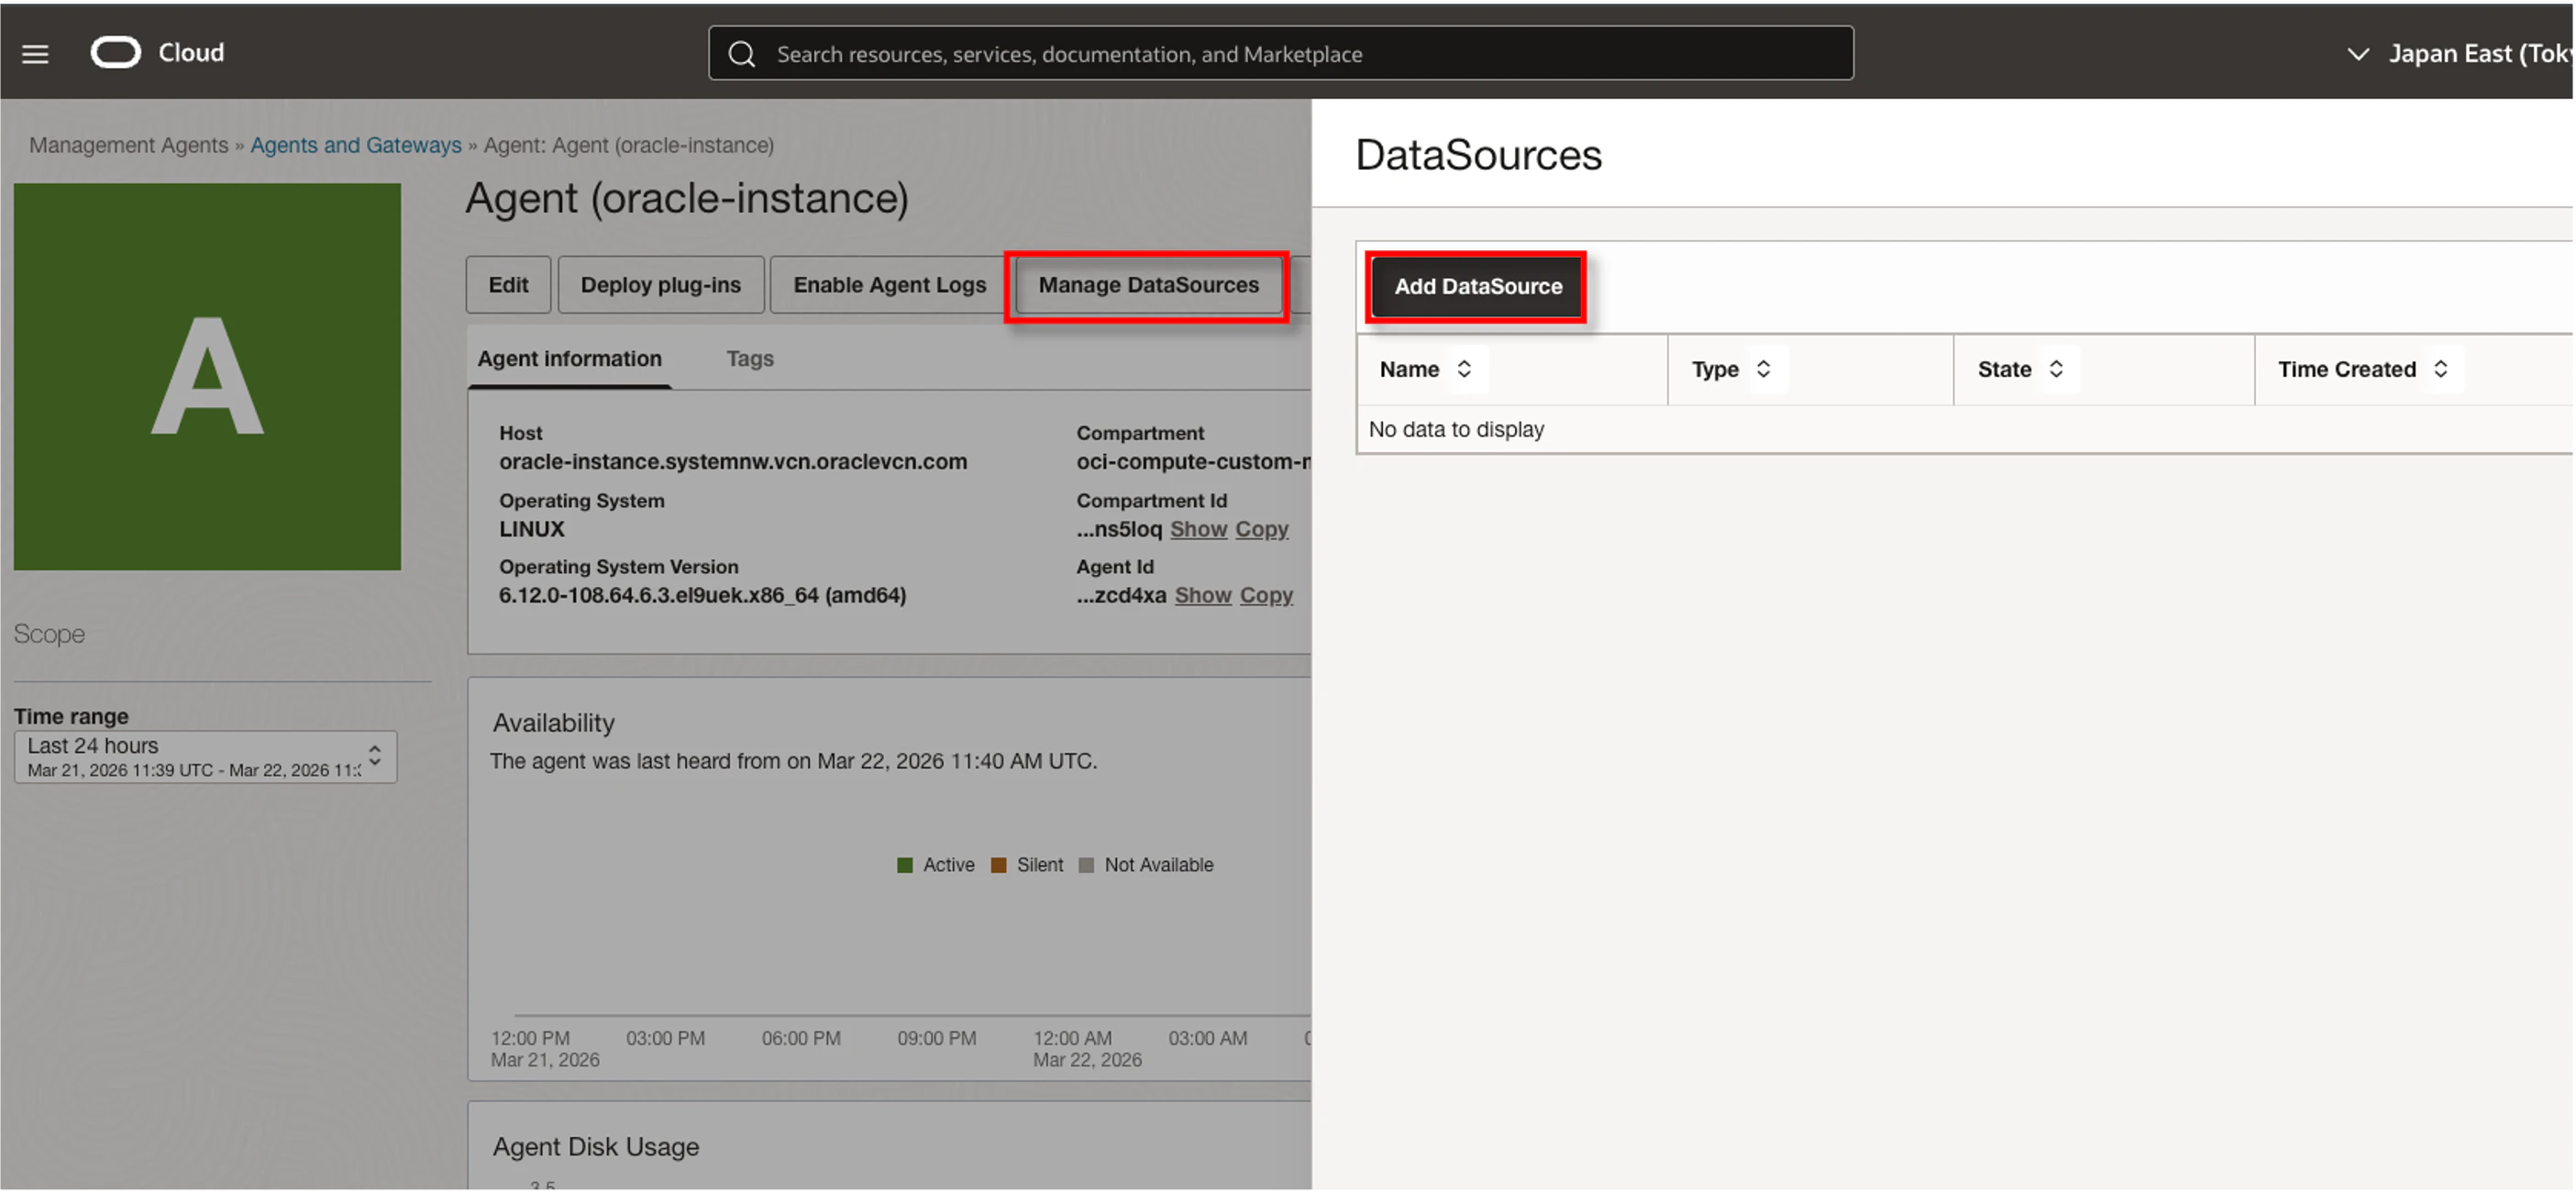
対象のエージェントをクリックします。

Manage DataSources → Add DataSources をクリックします。
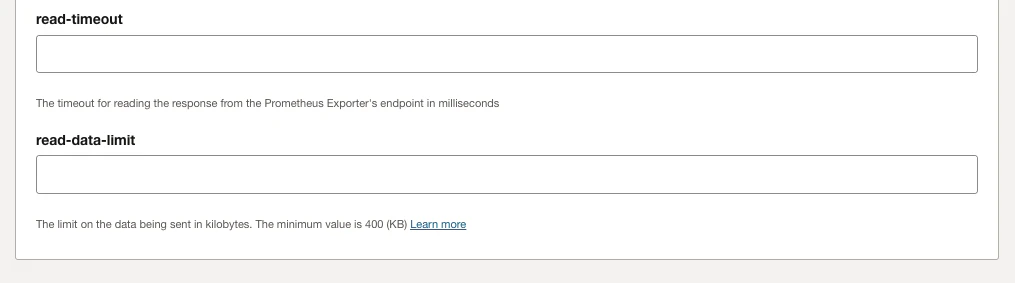
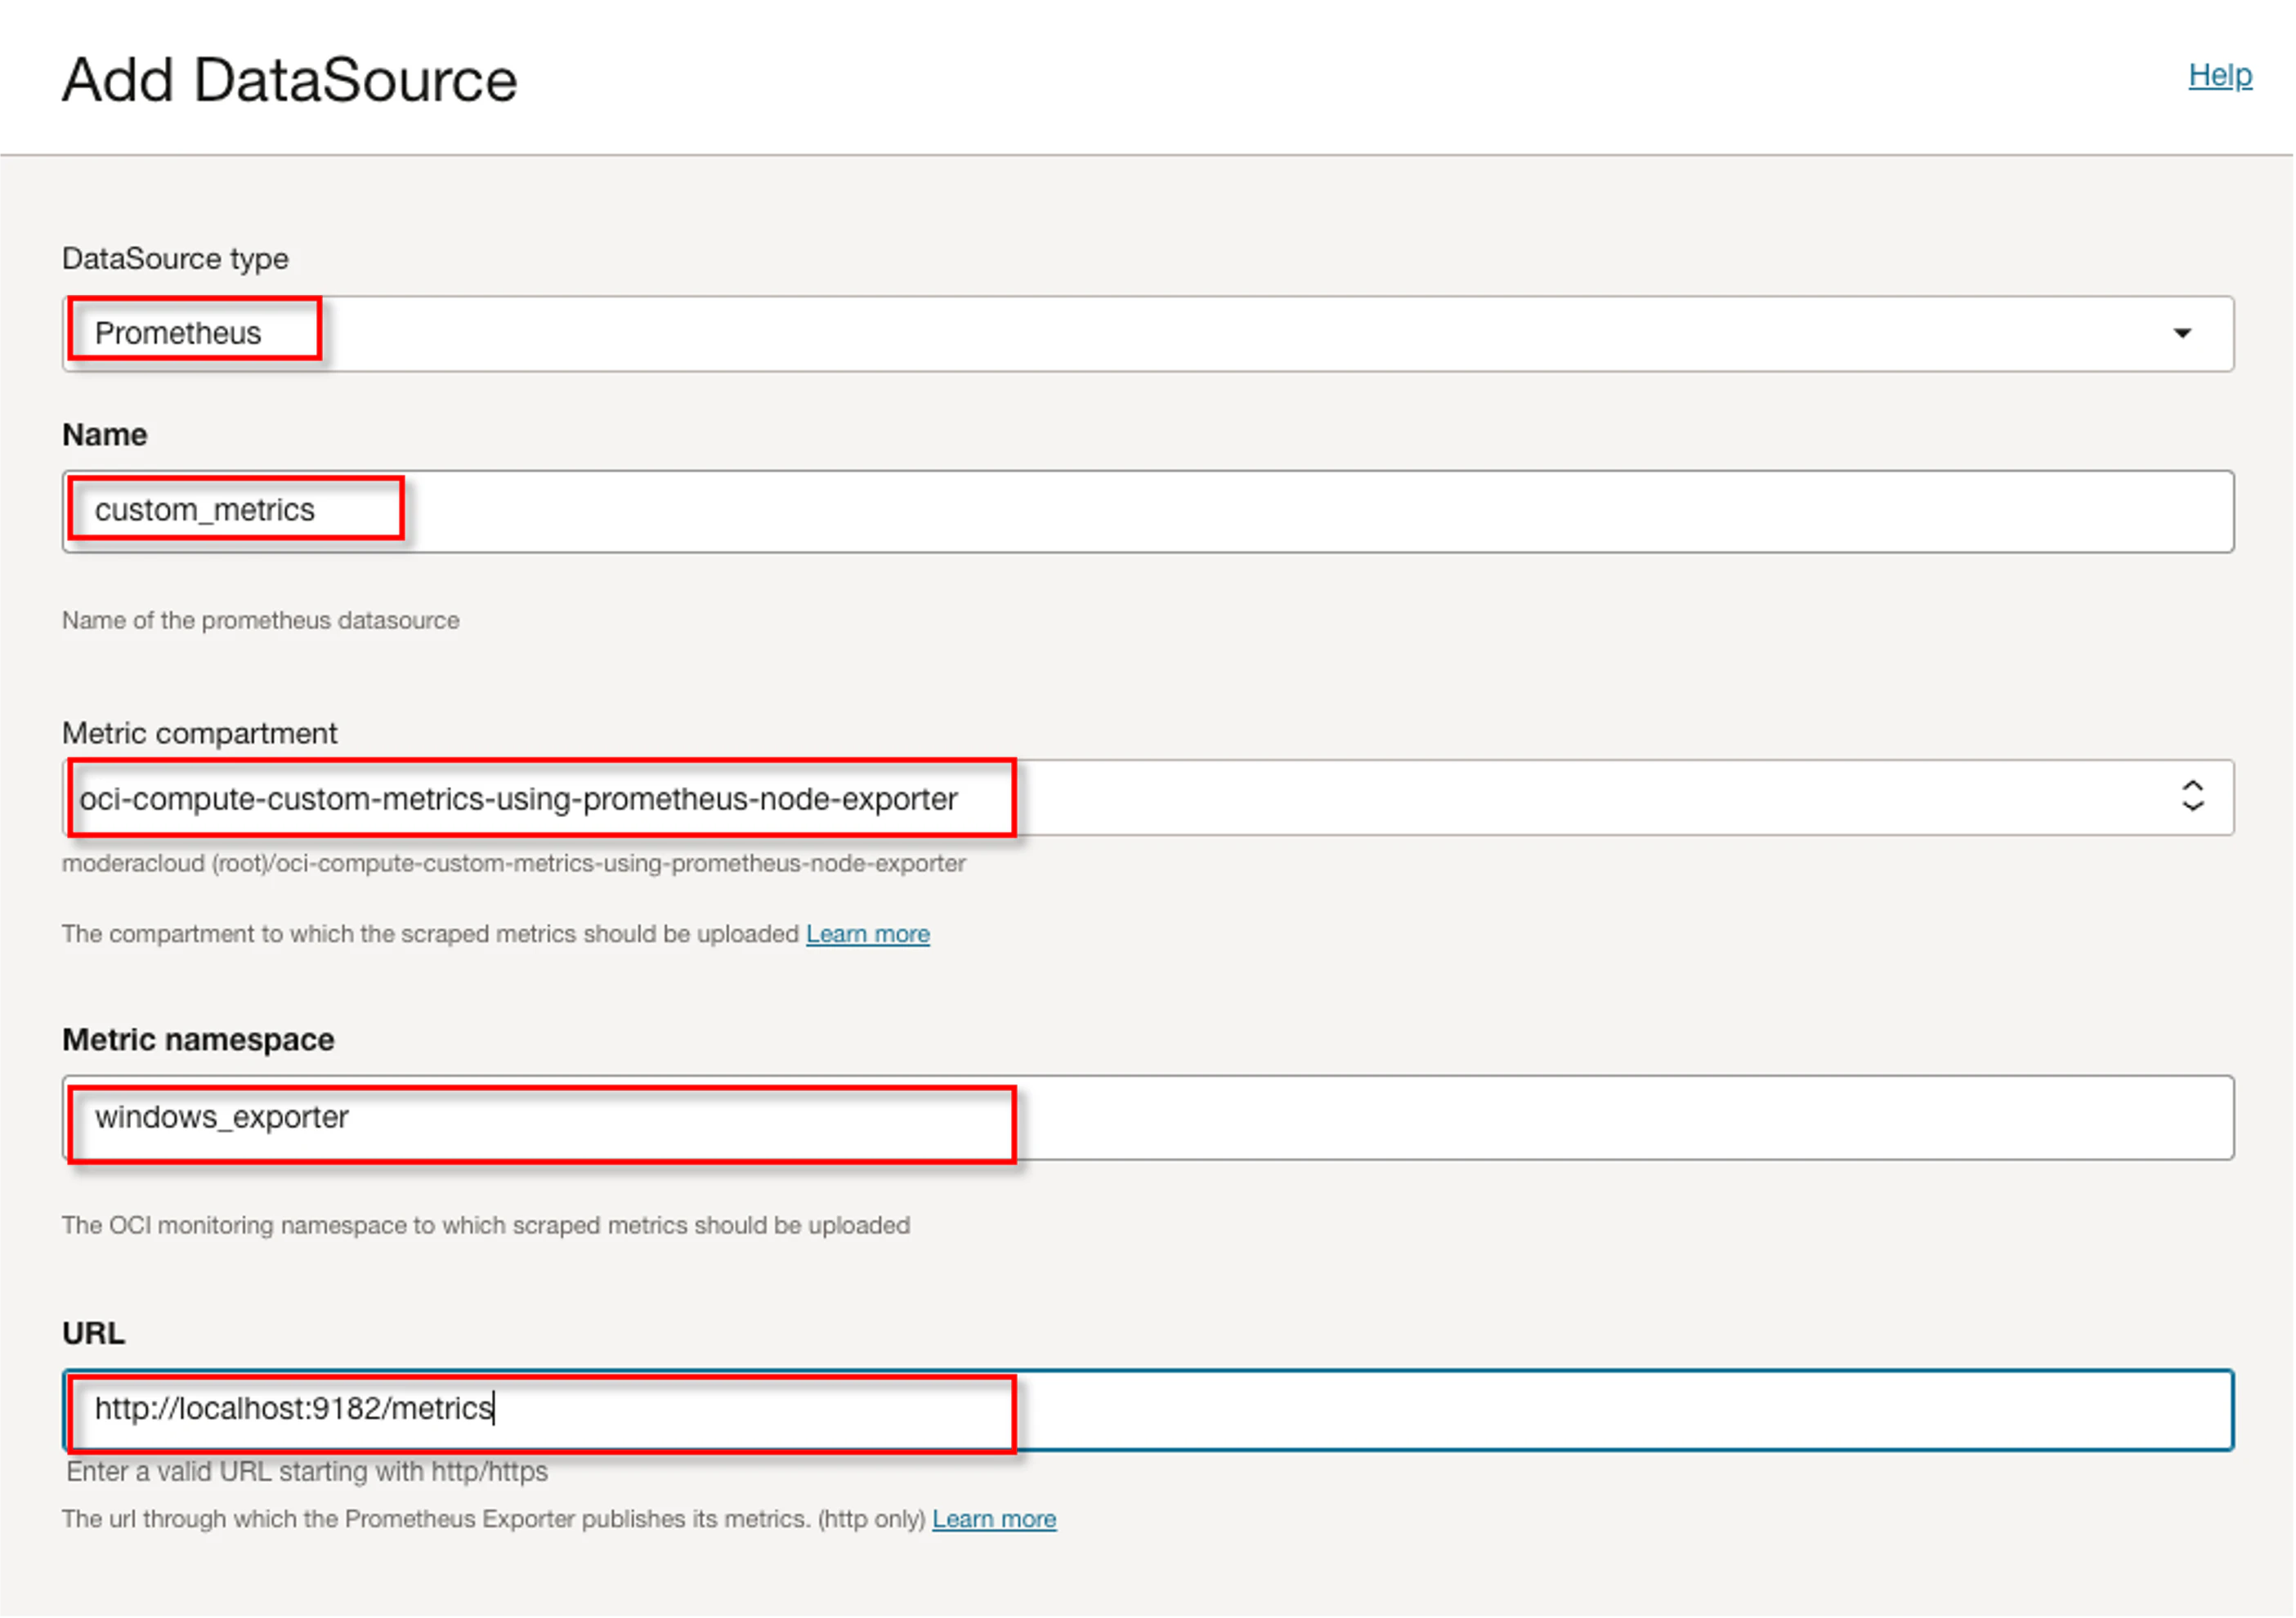
各種設定項目を入力します。
Metrics namespace に設定する値は、予約接頭辞 (oci_, oracle_) は使えません。
allowMetrics にて、OCI Monitoring にプッシュするメトリクスをフィルタできます。今回、Node_Exporter 側で取得するメトリクスはフィルタリングしていますが、それでも Go のメトリクスや不要なメトリクスが多いので以下メトリクスのみプッシュするようにフィルタリングします。
- node_memory_MemFree_bytes: メモリ空き容量
- node_memory_SwapFree_bytes: スワップメモリ空き容量
- node_filesystem_free_bytes: ファイルシステム空き容量 (ディスク空き容量)
- node_systemd_unit_state: ユニットの各ステータス情報
- CPUを取っていないのは、コア毎のCPU使用時間しか取れなかったので不要と判断しました
- プロセスに関しても、プロセスを判別できないので不要と判断しました
URL はインスタンス内で稼働している Node_Exporter を呼び出すURLを指定します。



Add クリック後、Active になっていればOKです。

Windows Server 編
OCI コンソール左上のハンバーガーマークをクリックし、Observability & Management → Agents をクリックします。
対象のエージェントをクリックします。

Manage DataSources → Add DataSources をクリックします。

各種設定項目を入力します。
Metrics namespace に設定する値は、予約接頭辞 (oci_, oracle_) は使えません。
allowMetrics にて、OCI Monitoring にプッシュするメトリクスをフィルタできます。今回、Windows_Exporter 側で取得するメトリクスはフィルタリングしていますが、それでも Go のメトリクスや不要なメトリクスが多いので以下メトリクスのみプッシュするようにフィルタリングします。
- windows_memory_available_bytes: メモリ空き容量
- windows_logical_disk_free_bytes: 論理ボリューム空き容量 (ディスク空き容量)
- windows_service_state: サービスの各ステータス情報
- CPUを取っていないのは、コア毎の情報などめぼしいものがなく不要と判断しました
URL はインスタンス内で稼働している Windows_Exporter を呼び出すURLを指定します。


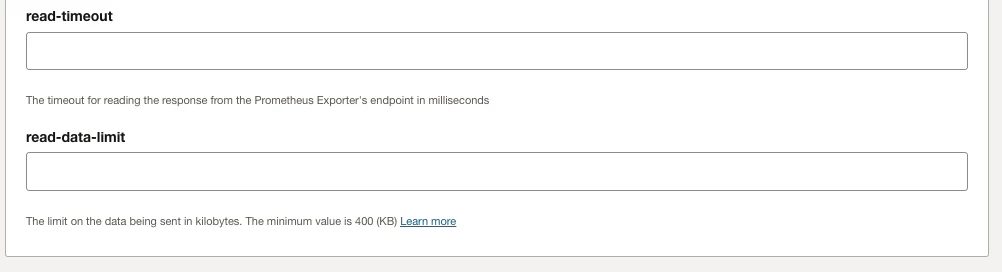
Add クリック後、Active になっていればOKです。
動作確認
最後、出力されたメトリクスを確認していきましょう。
確認方法は共通なので、適宜入力内容を置き換えてください。
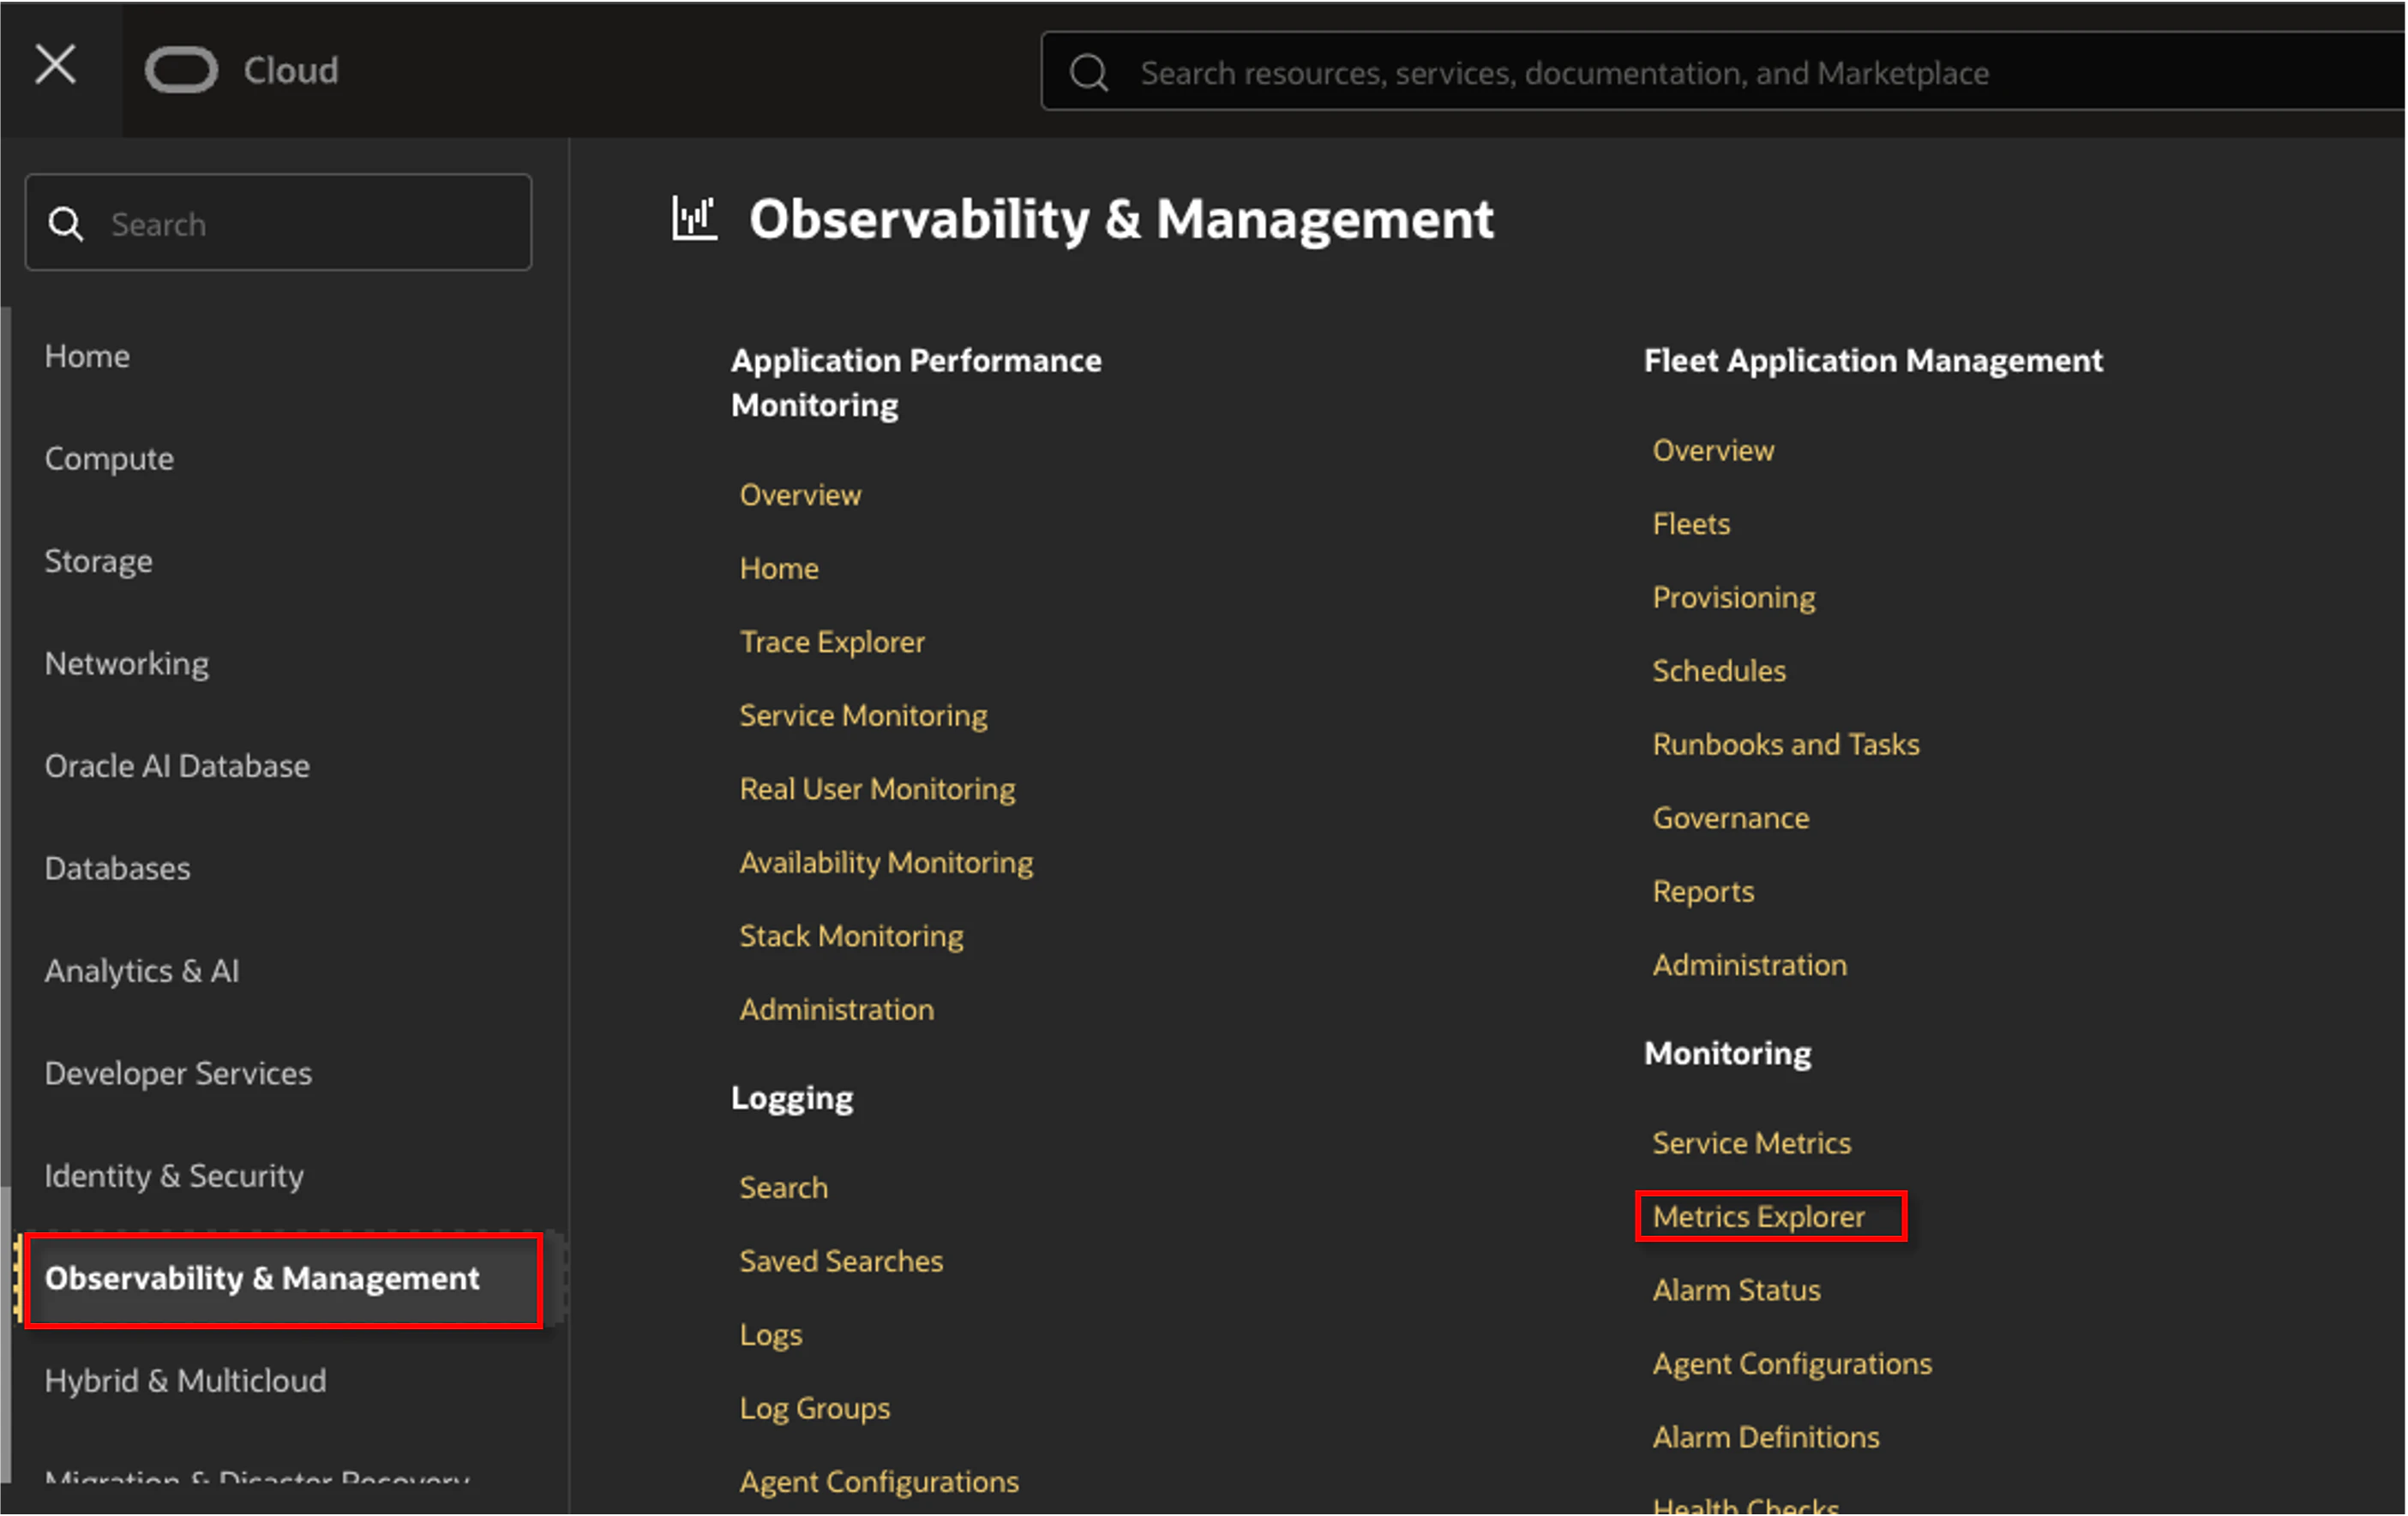
OCI コンソール左上のハンバーガーマークをクリックし、Observability & Management → Metrics Explorer をクリックします。
-
Service Metricsは、OCIサービスが出力するメトリクスのみ確認できる機能です -
Metrics Explorerは、OCIサービスのメトリクス及びカスタムメトリクスが確認できる機能です
各種項目を入力し、Update Chart をクリックします。
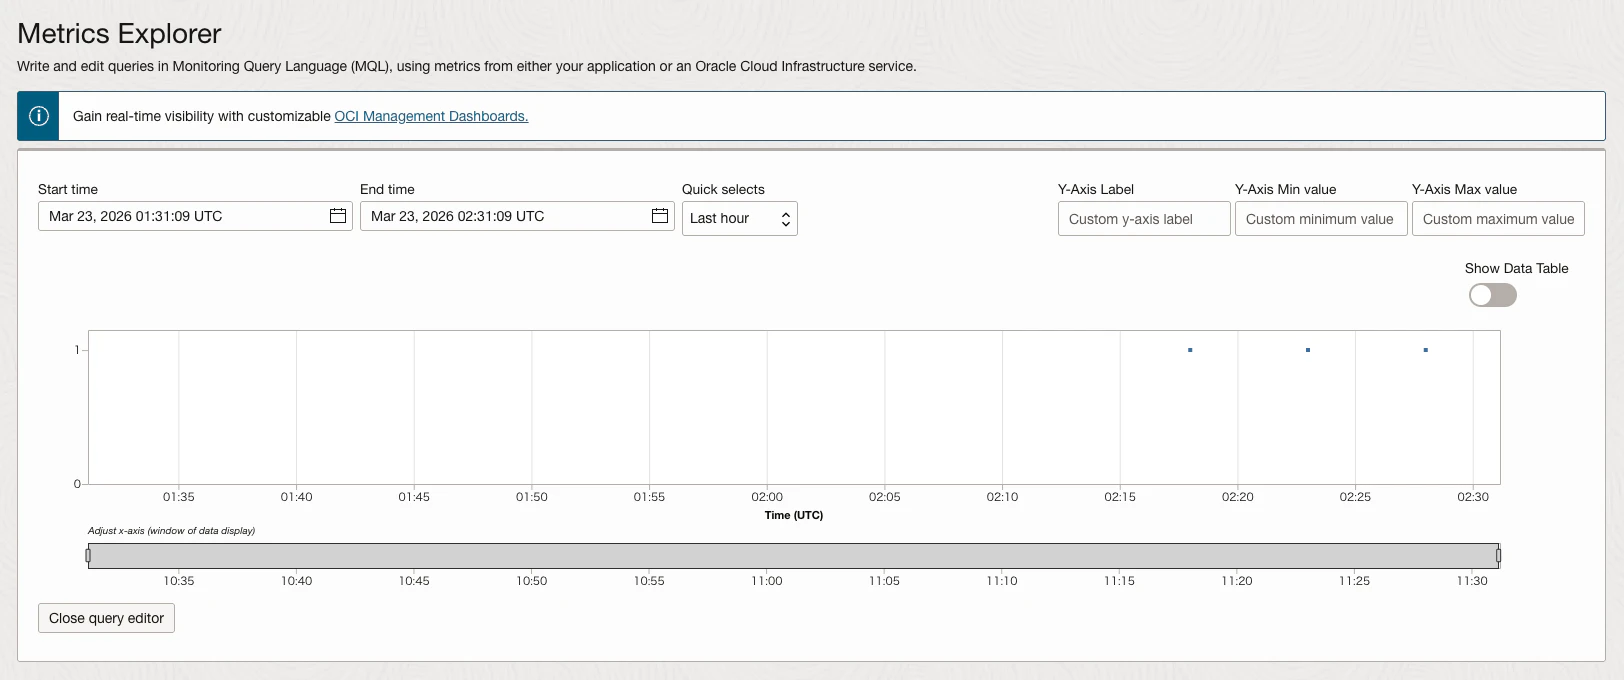
今回は、Windows Server インスタンス内で事前にサービス化した Nginx のステータスが running のメトリクスを確認します。
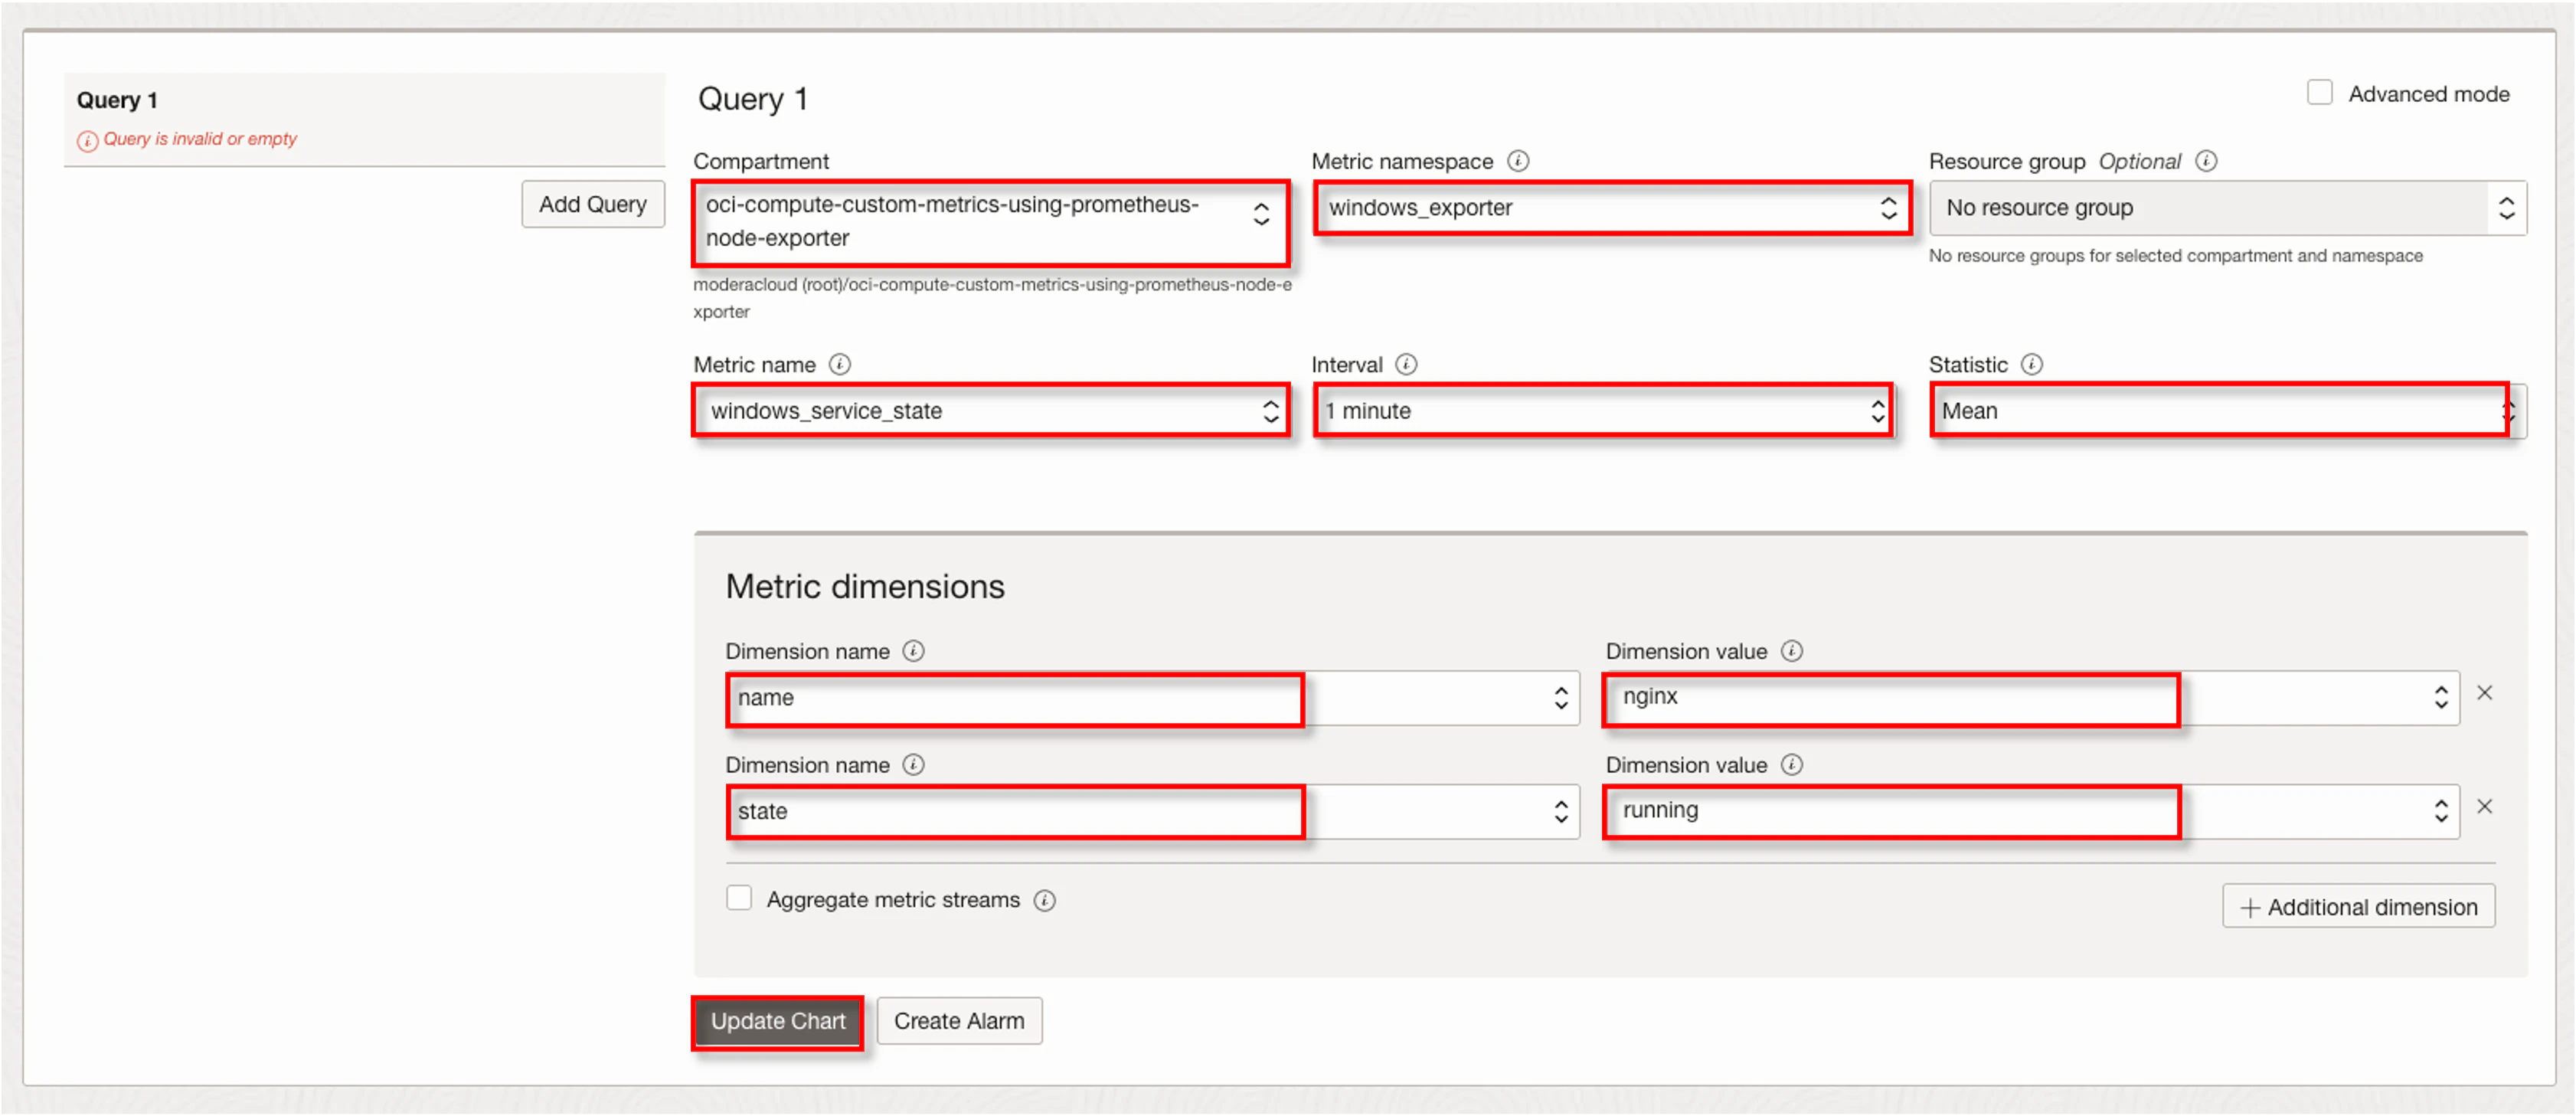
クリック後、画面上部に移動すると、問題なく取得できているのが確認できます。
おわりに
本記事では、OCI Compute のカスタムメトリクスを Prometheus Node Exporter で取得する方法についてまとめました。
次回は Oracle Cloud Agent (Custom Logs Monitoring Plugin) 方式をまとめたいと思います。
🌟この記事が誰かの役に立てば幸いです!
また、ご質問やフィードバックもお待ちしています。
番外編
コンパートメントの定義済みタグには要注意
こちら に記載した通り、Management Agents Service がインスタンス内の Management Agent Plugin を認識するには疎通性が必要と記載しました。
実際に疎通性は問題なく、Management Agent Plugin も Running なのにずっと Not Available でつまりました。
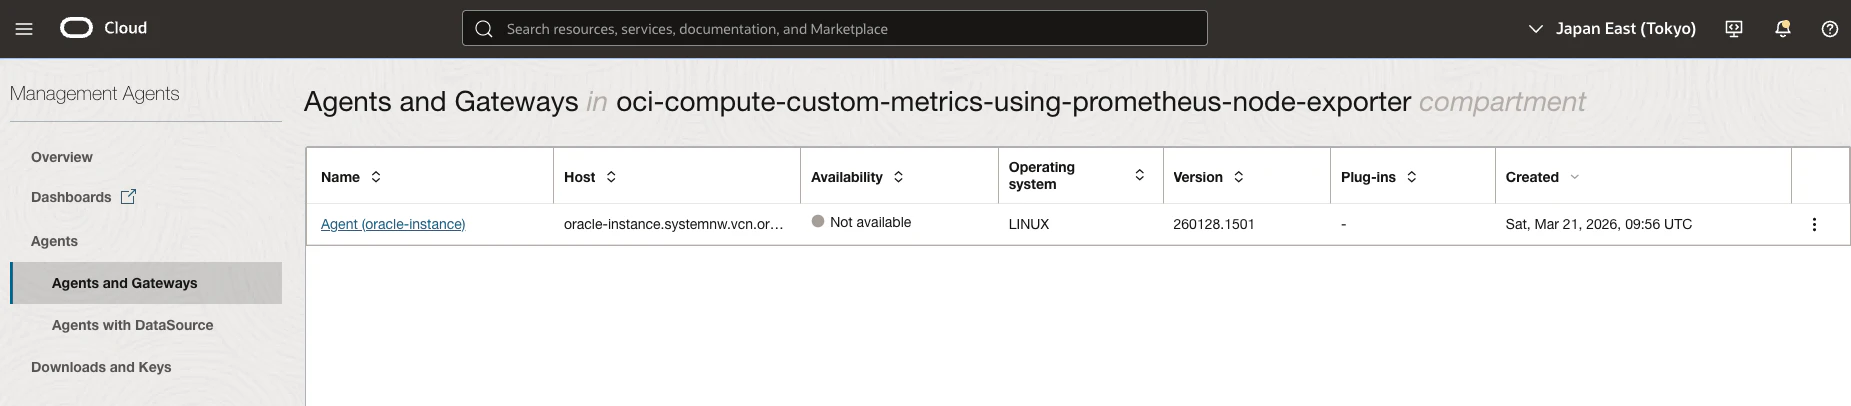
なので実際にプラグインのログを確認したところ、以下のようなエラーがありました。
[root@oracle-instance ~]# cat /var/lib/oracle-cloud-agent/plugins/oci-managementagent/polaris/agent_inst/log/mgmt_agent.log
~~~ 省略 ~~~
     ErrorBody:
{
  "code" : "InvalidParameter",
  "message" : "Invalid tags"
}
これは以下ドキュメント記載の理由で、コンパートメントに設定した定義済みタグの仕業 です。
定義済みタグには、デフォルト値 と ユーザー適用値 を設定でき、前者の場合は、リソース作成時に指定したデフォルト値が自動で適用されます。一方後者は、リソース作成時にユーザー自身が値を指定しなければいけません。(指定しないと作成に失敗します)

本検証環境は上図のように定義済みタグ (User-applied value) を指定しており、本事象が発生しました。
- 子コンパートメントは親コンパートメントの定義済みタグを継承するので、その点も考慮する必要あり
Not Available となる理由をもう少し深堀りすると、処理観点で見ると、該当リソースは Management Agent Plugin から Management Agents Service にプッシュする形で認識されます。
その際、定義済みタグ (User-applied value) を指定できず作成に失敗したということになります。
そのため、ドキュメントに記載がありますが、Management Agent Plugin がプッシュする情報に定義済みタグ (User-applied value) を付与する必要があります。
実際の対応方法は以下の通り です。
/var/lib/oracle-cloud-agent/plugins/oci-managementagent/polaris/agent_inst/config/security/resource/ 配下に新規で agent.definedtags を作成し、本環境に合わせて以下追記します。
[{"Common":{"Env":"prd","ManagedByTerraform":"true"}}]
その後、作成したファイルの権限を変更します。
[root@oracle-instance resource]# pwd
/var/lib/oracle-cloud-agent/plugins/oci-managementagent/polaris/agent_inst/config/security/resource

[root@oracle-instance resource]# chown oracle-cloud-agent:oracle-cloud-agent agent.definedtags

[root@oracle-instance resource]# ls -al agent.definedtags
-rw-r--r-- 1 oracle-cloud-agent oracle-cloud-agent 55  3月 21 22:10 agent.definedtags
その後、oracle-cloud-agent.service を再起動します。
[root@oracle-instance ~]# systemctl restart oracle-cloud-agent
コンソールを確認すると Active になりました。
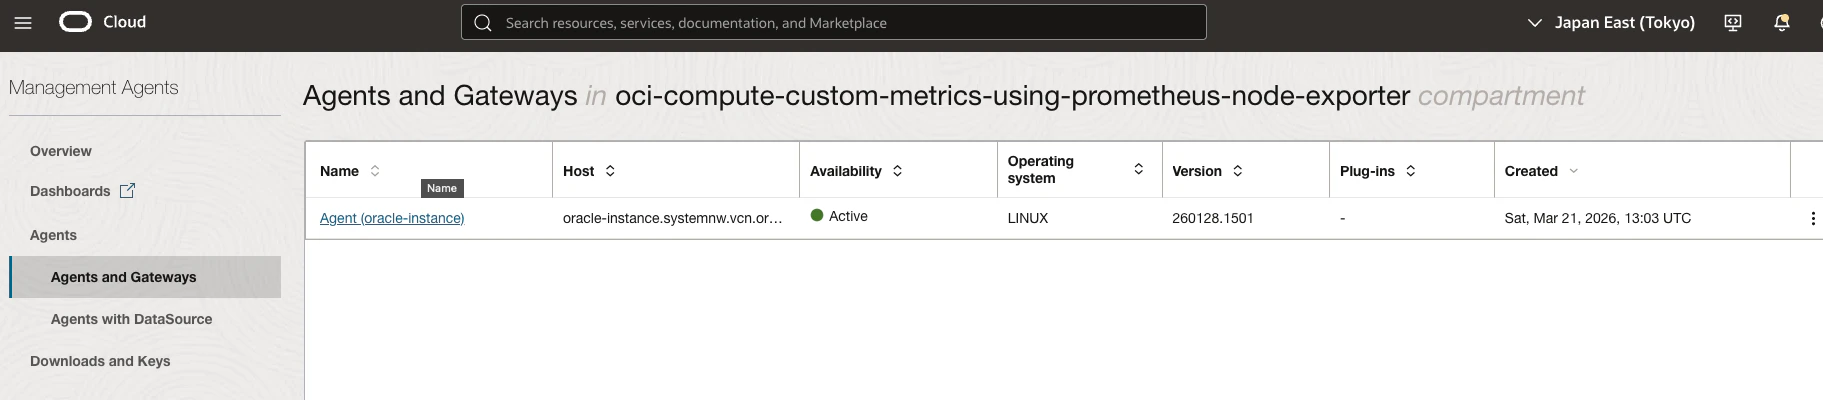
-
Activeになった後作成したファイルは消えてました
[root@oracle-instance resource]# ll
合計 32
-rwxr-x---. 1 oracle-cloud-agent oracle-cloud-agent  119  3月 21 22:03 agent.ocid
-rwxr-x---. 1 oracle-cloud-agent oracle-cloud-agent   46  3月 21 22:03 agent.package
-rwxr-x---. 1 oracle-cloud-agent oracle-cloud-agent  306  3月 21 22:03 compute.resource
-rw-------. 1 oracle-cloud-agent oracle-cloud-agent 1722  3月 21 22:03 encryption.pem
-rwxr-x---. 1 oracle-cloud-agent oracle-cloud-agent  456  3月 21 22:03 encryption_pub.pem
-rwxr-x---. 1 oracle-cloud-agent oracle-cloud-agent  287  3月 21 22:03 keys.lst
-rw-------. 1 oracle-cloud-agent oracle-cloud-agent 1722  3月 21 22:03 rp.pem
-rwxr-x---. 1 oracle-cloud-agent oracle-cloud-agent  456  3月 21 22:03 rp_pub.pem
Windows Server に管理エージェントをインストール
Windows Server にはデフォルトで管理エージェントがインストールされていないので、以下ドキュメントに従いインストールしていきます。
インストーラー準備
OCI コンソール左上のハンバーガーマークをクリックし、Observability & Management → Agents をクリックします。
Download and Keys から、Agent for WINDOWS (X86_64) をクリックしてローカルPCにダウンロードします。
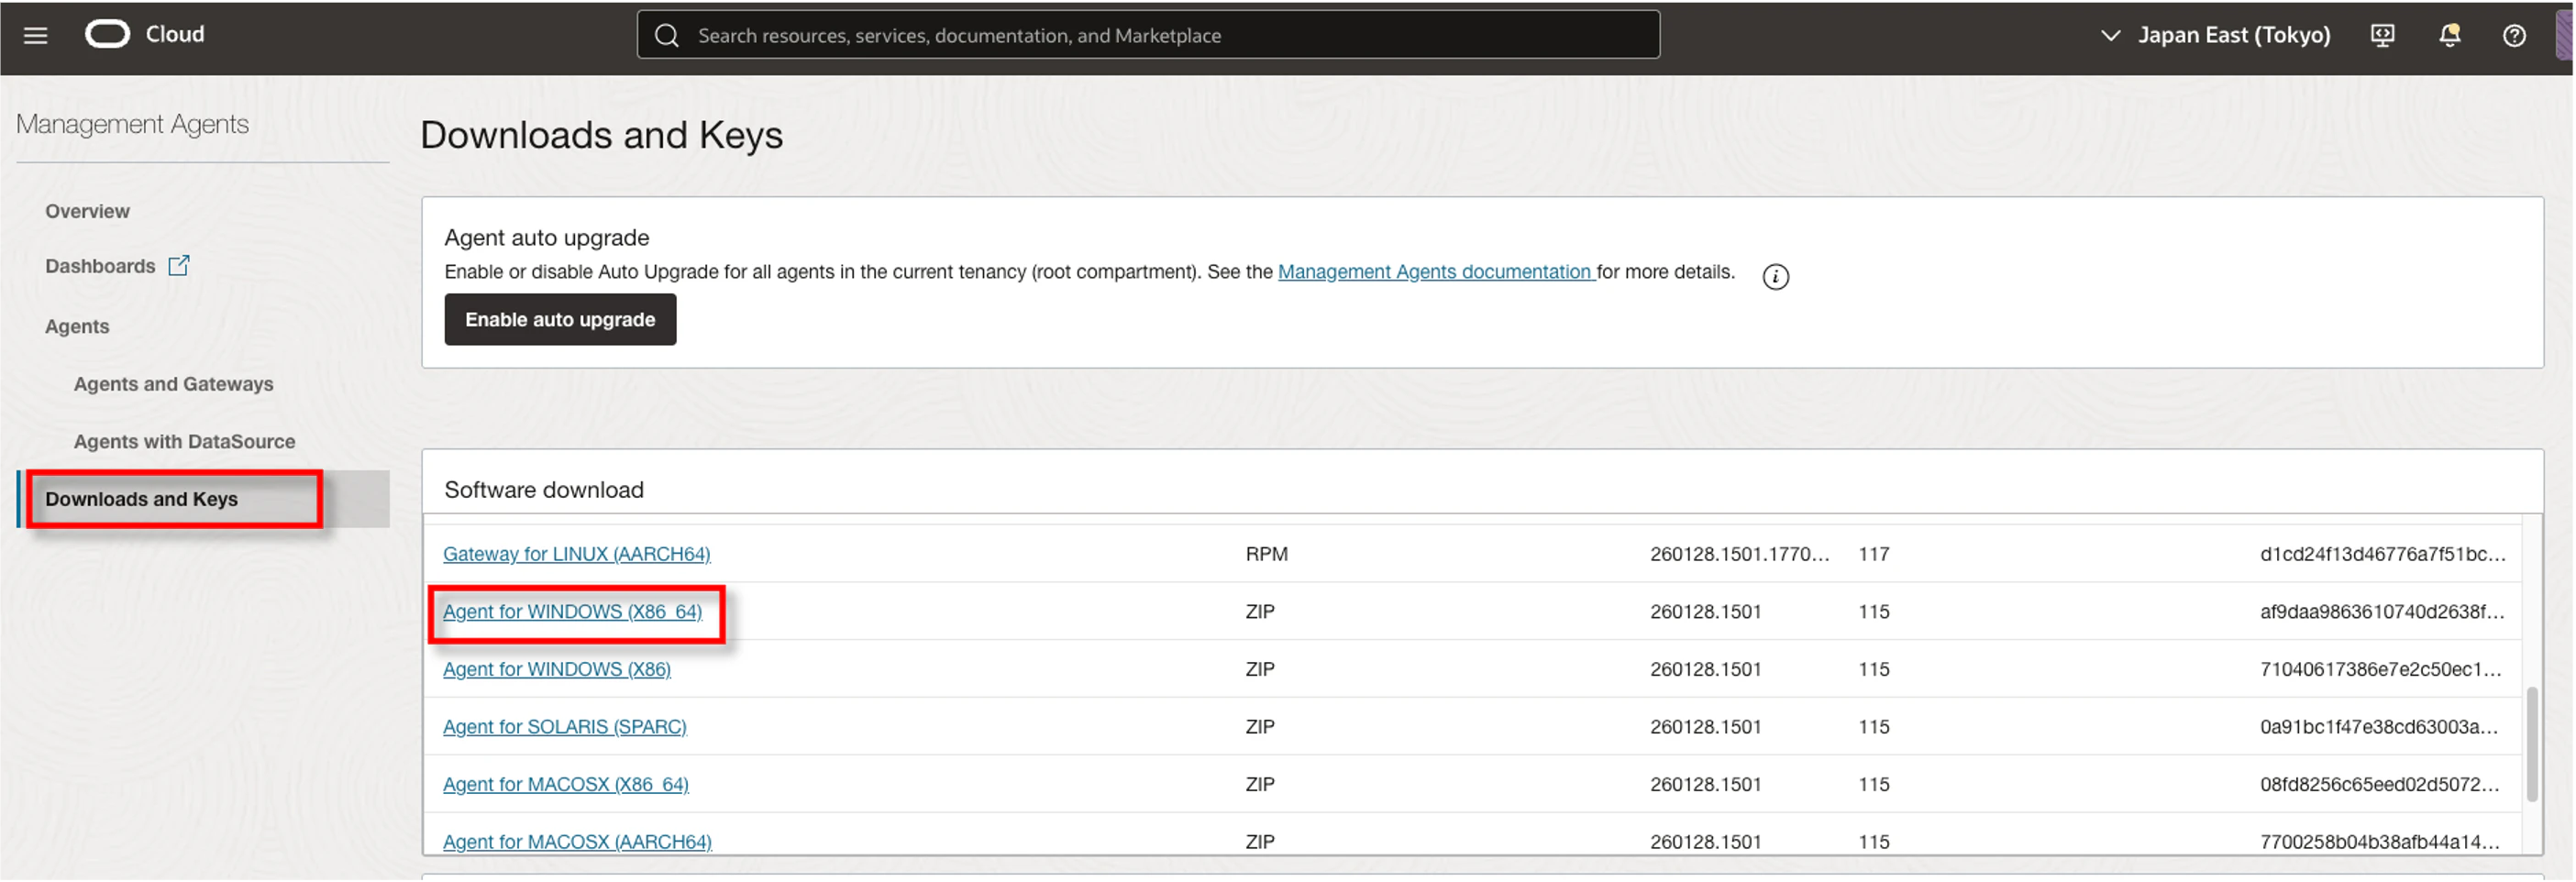
ダウンロードしたら、対象のインスタンスに持ち込みます。
インストールキー作成
先程の同じ画面にて Create key をクリックします。

各種情報を入力し Create をクリックします。

作成したインストールキーの情報が含まれる レスポンス・ファイル をダウンロードします。

キー名.rsp ファイルがローカルPCにダウンロードされるため、デフォルトから今回の構成に合わせて以下修正します。
########################################################################
# Please refer the following Management Agent Installation Guide for more details.
#
# https://docs.cloud.oracle.com/iaas/management-agents/index.html
#
# Since this file has sensitive information, please make sure that after
# executing setup.sh you either delete this file or store it in a secure
# location.
#
########################################################################
ManagementAgentInstallKey = hogehoge
AgentDisplayName =
#Please uncomment the below tags properties and provide values as needed
#FreeFormTags = [{"<key1>":"<value1>"}, {"<key2>":"<value2>"}]
- #DefinedTags = [{"namespace1":{"<key1>":"<value1>"}}, {"namespace2":{"<key2>":"<value2>"}}]
+ DefinedTags = [{"Common":{"Env":"prd","ManagedByTerraform":"true"}}]
- CredentialWalletPassword =
+ #CredentialWalletPassword =
#Service.plugin.jm-container.download=true
#Service.plugin.mds.download=true
#Service.plugin.osmh.download=true
#Service.plugin.appmgmt.download=true
#Service.plugin.logan.download=true
#Service.plugin.dbaas.download=true
#Service.plugin.jms.download=true
#Service.plugin.opsiHost.download=true
#Service.plugin.jm.download=true
修正後、対象インスタンスに持ち込みます。
JDK インストール
前提条件に JDK のインストールが必要なので、インストールします。
-
JDK 8のみサポートされています - それ以外でやろうとするとエラーになります
C:\Users\opc\Desktop\oracle.mgmt_agent.260128.1501.Windows-x86_64\mgmt_agent>installer.bat c:\Users\opc\Desktop\windows-key.rsp
Checking pre-requisites

        Checking if previous agent service exists
        Checking if C:\Oracle\mgmt_agent\agent_inst directory exists
        Checking Java version
"Agent only supports 64 bit and 32 bit JDK 8 (with a minimum upgrade version JDK 8u281). Please set your preferred path in JAVA_HOME"
以下リンクから jdk-8u281-windows-x64.exe をインスタンスにダウンロードする。
※ 事前にOracleアカウントが必要です
- 商用利用の場合は、ライセンスが必要になるので注意
ダウンロード後、exe ファイルを実行し、設定はデフォルトでインストールします。
インストール完了後、インストールした java の情報をシステム環境変数に追加したいので、 Powershell を管理者権限で起動し、以下コマンドを実行してシステムプロパティを起動します。
PS C:\Windows\system32> SystemPropertiesAdvanced
新規で 変数名:JAVA_HOME / 変数値:C:\Program Files\Java\jdk1.8.0_281 を追加、環境変数 Path に %JAVA_HOME%\bin を追加します。
インストール実行
インストーラーを解凍し、installer.bat があるディレクトリをカレントディレクトリとするターミナルを管理者権限で起動します。
c:\Users\opc\Desktop\oracle.mgmt_agent.260128.1501.Windows-x86_64\mgmt_agent>dir
 Volume in drive C is Windows
 Volume Serial Number is 1E1A-BD1A

 Directory of c:\Users\opc\Desktop\oracle.mgmt_agent.260128.1501.Windows-x86_64\mgmt_agent

2026/03/22  02:21    <DIR>          .
2026/03/22  02:21    <DIR>          ..
2026/01/28  15:07            11,184 installer.bat
2026/03/22  02:21    <DIR>          zip
               1 File(s)         11,184 bytes
               3 Dir(s)  11,103,694,848 bytes free
レスポンス・ファイルのパスを指定しつつ、installer.bat を実行します。
c:\Users\opc\Desktop\oracle.mgmt_agent.260128.1501.Windows-x86_64\mgmt_agent>installer.bat c:\Users\opc\Desktop\windows-key.rsp
Checking pre-requisites

        Checking if previous agent service exists
        Checking if C:\Oracle\mgmt_agent\agent_inst directory exists
        Checking Java version
                Java version: 1.8.0_281 found at C:\Program Files\Java\jdk1.8.0_281
        Checking if C:\Oracle\mgmt_agent\260128.1501 directory exists

Executing install
        Unpacking software zip
        Copying files to destination dir (C:\Oracle\mgmt_agent)
        Initializing software from template
        Checking if JavaScript engine is available to use
        Creating mgmt_agent service

Agent install successful

Executing configure

        Parsing input response file
        Validating install key
        Generating communication wallet
        Generating security artifacts
        Registering Management Agent

The Oracle Management Agent service is starting.....
The Oracle Management Agent service was started successfully.


Agent setup completed and the agent is running
In the future agent can be started by directly running: NET START mgmt_agent
Please use OCI CLI or OCI Management Agent console to validate the successful activation of your agent."

Please make sure that you delete c:\Users\opc\Desktop\windows-key.rsp or store it in secure location.
- 試しにサポートされていない
Windows Server 2025で実行したら以下のエラーが出ました
'wmic' is not recognized as an internal or external command, operable program or batch file. is not supported by Management Agent for all plugins. Please check the documentation for supported versions. Java Management Service users should check the documentation and if the plugin is supported, then set "OVERRIDE_VERSION_CHECK=true" in your environment variables before attempting the installation.
その後、サービスページで確認すると登録されていました。

サービスとしても登録されているのが確認できました。
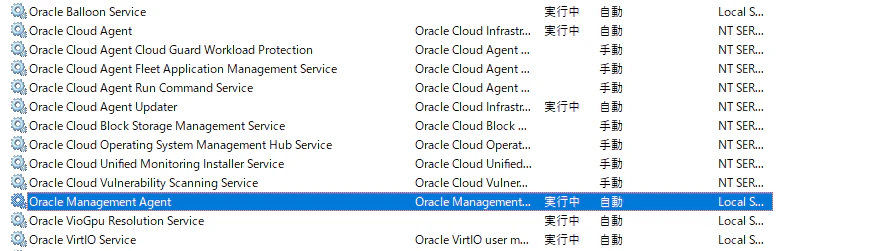
- インスタンスコンソールからは起動停止の制御ができないため注意
参考資料
リファレンス
- APIを使用したカスタム・メトリックの公開 - Oracle Cloud Infrastructureドキュメント
- エージェント構成の管理 - Oracle Cloud Infrastructureドキュメント
- Prometheus Node Exporterを利用した管理エージェントによるOCIインスタンスのモニタリング
- prometheus/node_exporter - GitHub
- prometheus/node_exporter/releases - GitHub
- prometheus-community/windows_exporter - GitHub
- prometheus-community/windows_exporter/releases - GitHub