はじめに
Go言語の機械学習パッケージを使って異常検知する方法の紹介です。数値データーの配列から異常値(外れ値)を見つける2つのアルゴリズムを実装したパッケージの使い方を紹介します。
Local Outlier Factor(LOF)
日本語では「局所外れ値因子法」というらしいです。
LOFのGo言語実装
メンテナンスされていないようなのとログの出力が多いのでパッケージとして使いやすようにForkしたのが
です。
サンプルプログラム
package main

import (
	"image/color"
	"log"

	"github.com/twsnmp/golof/lof"
	"gonum.org/v1/plot"
	"gonum.org/v1/plot/plotter"
	"gonum.org/v1/plot/vg"
)

func main() {
	// テストデータ
	points := [][]float64{
		{-4.8447532242074978, -5.6869538132901658},
		{1.7265577109364076, -2.5446963280374302},
		{-1.9885982441038819, 1.705719643962865},
		{-1.999050026772494, -4.0367551415711844},
		{-2.0550860126898964, -3.6247409893236426},
		{-1.4456945632547327, -3.7669258809535102},
		{-4.6676062022635554, 1.4925324371089148},
		{-3.6526420667796877, -3.5582661345085662},
		{6.4551493172954029, -0.45434966683144573},
		{-0.56730591589443669, -5.5859532963153349},
		{-5.1400897823762239, -1.3359248994019064},
		{5.2586932439960243, 0.032431285797532586},
		{6.3610915734502838, -0.99059648246991894},
		{-0.31086913190231447, -2.8352818694180644},
		{1.2288582719783967, -1.1362795178325829},
		{-0.17986204466346614, -0.32813130288006365},
		{2.2532002509929216, -0.5142311840491649},
		{-0.75397166138399296, 2.2465141276038754},
		{1.9382517648161239, -1.7276112460593251},
		{1.6809250808549676, -2.3433636210337503},
		{0.68466572523884783, 1.4374914487477481},
		{2.0032364431791514, -2.9191062023123635},
		{-1.7565895138024741, 0.96995712544043267},
		{3.3809644295064505, 6.7497121359292684},
		{-4.2764152718650896, 5.6551328734397766},
		{-3.6347215445083019, -0.85149861984875741},
		{-5.6249411288060385, -3.9251965527768755},
		{4.6033708001912093, 1.3375110154658127},
		{-0.685421751407983, -0.73115552984211407},
		{-2.3744241805625044, 1.3443896265777866},
	}
	log.Println("start")
	// LOFの計算
	samples := lof.GetSamplesFromFloat64s(points)
	lofGetter := lof.NewLOF(5)
	lofGetter.Train(samples)
	mapping := lofGetter.GetLOFs(samples, "fast")
	// グラフの作成
	pts1 := plotter.XYs{}
	pts2 := plotter.XYs{}
	for sample, factor := range mapping {
		point := sample.GetPoint()
		if factor > 1.5 {
			pts1 = append(pts1, plotter.XY{X: point[0], Y: point[1]})
			log.Printf("anomaly: %v,  \tLOF: %f\n", point, factor)
		} else {
			pts2 = append(pts2, plotter.XY{X: point[0], Y: point[1]})
		}
	}
	lofGetter.Reset()
	p := plot.New()
	p.Title.Text = "golof Example"
	p.X.Label.Text = "X"
	p.Y.Label.Text = "Y"
	p.Add(plotter.NewGrid())
	s1, err := plotter.NewScatter(pts1)
	if err != nil {
		log.Fatal(err)
	}
	s2, err := plotter.NewScatter(pts2)
	if err != nil {
		log.Fatal(err)
	}
	p.Add(s1, s2)
	p.Legend.Add("anomaly", s1)
	p.Legend.Add("normal", s2)
	s1.GlyphStyle.Color = color.RGBA{R: 255, B: 128, A: 255}
	s2.GlyphStyle.Color = color.RGBA{R: 0, B: 255, A: 255}
	if err := p.Save(4*vg.Inch, 4*vg.Inch, "points.png"); err != nil {
		log.Fatal(err)
	}
	log.Println("end")
}
実行結果
$go run main.go
2024/11/02 05:01:57 start
2024/11/02 05:01:57 anomaly: [-4.27641527186509 5.6551328734397766],  	LOF: 1.768054
2024/11/02 05:01:57 anomaly: [3.3809644295064505 6.749712135929268],  	LOF: 1.932724
2024/11/02 05:01:57 end
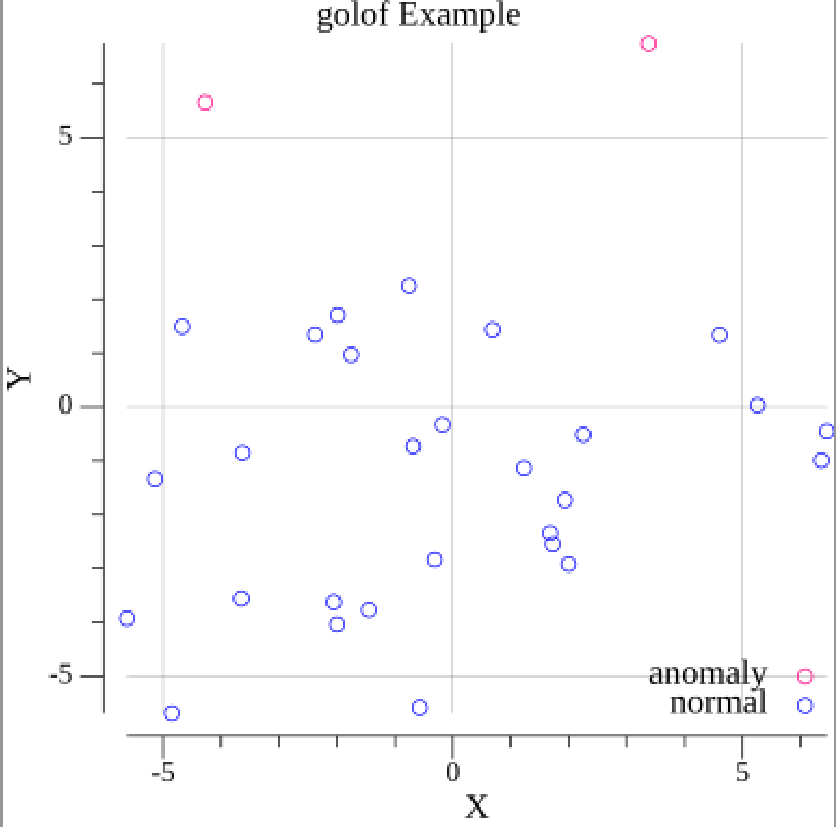
出力されたグラフ
赤い点が異常値です。外れている感じがわかります。
Isolation Forest
Isolation ForestのGo言語実装
サンプルコード
GitHUBのリポジトリにあるサンプルは不完全なので動作しません。
LOFのサンプルを移植してみました。
package main

import (
	"image/color"
	"log"

	go_iforest "github.com/codegaudi/go-iforest"
	"gonum.org/v1/plot"
	"gonum.org/v1/plot/plotter"
	"gonum.org/v1/plot/vg"
)

func main() {
	// テストデータ
	points := [][]float64{
		{-4.8447532242074978, -5.6869538132901658},
		{1.7265577109364076, -2.5446963280374302},
		{-1.9885982441038819, 1.705719643962865},
		{-1.999050026772494, -4.0367551415711844},
		{-2.0550860126898964, -3.6247409893236426},
		{-1.4456945632547327, -3.7669258809535102},
		{-4.6676062022635554, 1.4925324371089148},
		{-3.6526420667796877, -3.5582661345085662},
		{6.4551493172954029, -0.45434966683144573},
		{-0.56730591589443669, -5.5859532963153349},
		{-5.1400897823762239, -1.3359248994019064},
		{5.2586932439960243, 0.032431285797532586},
		{6.3610915734502838, -0.99059648246991894},
		{-0.31086913190231447, -2.8352818694180644},
		{1.2288582719783967, -1.1362795178325829},
		{-0.17986204466346614, -0.32813130288006365},
		{2.2532002509929216, -0.5142311840491649},
		{-0.75397166138399296, 2.2465141276038754},
		{1.9382517648161239, -1.7276112460593251},
		{1.6809250808549676, -2.3433636210337503},
		{0.68466572523884783, 1.4374914487477481},
		{2.0032364431791514, -2.9191062023123635},
		{-1.7565895138024741, 0.96995712544043267},
		{3.3809644295064505, 6.7497121359292684},
		{-4.2764152718650896, 5.6551328734397766},
		{-3.6347215445083019, -0.85149861984875741},
		{-5.6249411288060385, -3.9251965527768755},
		{4.6033708001912093, 1.3375110154658127},
		{-0.685421751407983, -0.73115552984211407},
		{-2.3744241805625044, 1.3443896265777866},
	}
	log.Println("start")
	/// Isolation Forestの計算
	f, err := go_iforest.NewIForest(points, 10000, 20)
	if err != nil {
		log.Fatal(err)
	}
	// グラフの作成
	ptsA := plotter.XYs{}
	ptsN := plotter.XYs{}
	for i := 0; i < len(points); i++ {
		score := f.CalculateAnomalyScore(points[i])
		if score > 0.6 {
			log.Printf("anomaly: %v, \tScore: %f", points[i], score)
			ptsA = append(ptsA, plotter.XY{X: points[i][0], Y: points[i][1]})
		} else {
			ptsN = append(ptsN, plotter.XY{X: points[i][0], Y: points[i][1]})
		}
	}
	p := plot.New()
	p.Title.Text = "Isolation Forest Example"
	p.X.Label.Text = "X"
	p.Y.Label.Text = "Y"
	p.Add(plotter.NewGrid())
	s1, err := plotter.NewScatter(ptsA)
	if err != nil {
		log.Fatal(err)
	}
	s2, err := plotter.NewScatter(ptsN)
	if err != nil {
		log.Fatal(err)
	}
	p.Add(s1, s2)
	p.Legend.Add("anomaly", s1)
	p.Legend.Add("normal", s2)
	s1.GlyphStyle.Color = color.RGBA{R: 255, B: 128, A: 255}
	s2.GlyphStyle.Color = color.RGBA{R: 0, B: 255, A: 255}
	if err := p.Save(4*vg.Inch, 4*vg.Inch, "points.png"); err != nil {
		log.Fatal(err)
	}
	log.Println("end")
}
実行結果
$go run main.go
2024/11/02 05:01:57 start
2024/11/02 05:01:57 Anomary: [-4.27641527186509 5.6551328734397766],  	LOF: 1.768054
2024/11/02 05:01:57 Anomary: [3.3809644295064505 6.749712135929268],  	LOF: 1.932724
2024/11/02 05:01:57 end
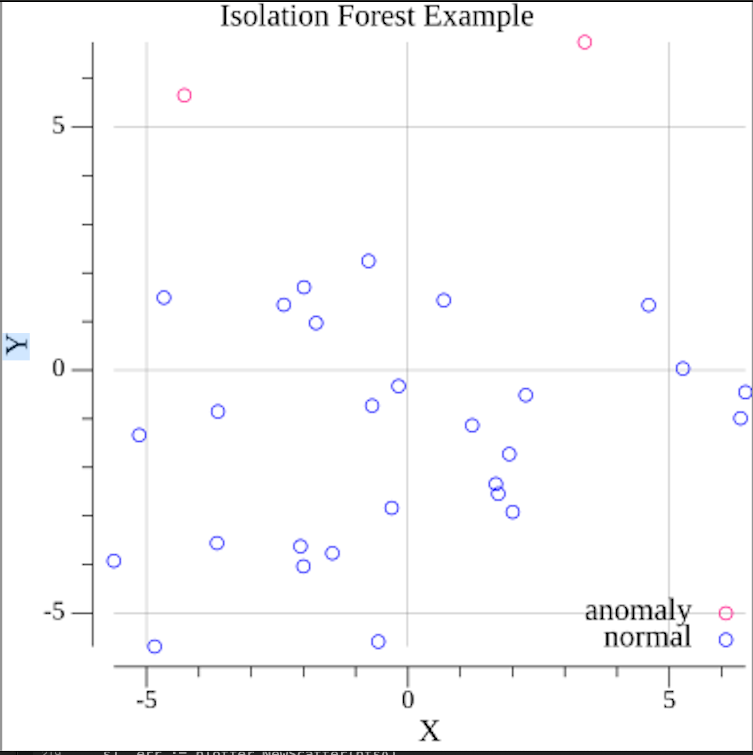
判定するスコアのしきい値を調整すれば、同じ結果になりました。
グラフ出力
余談
この2つの異常検知のパッケージは、TWSNMPシリーズで使っています。
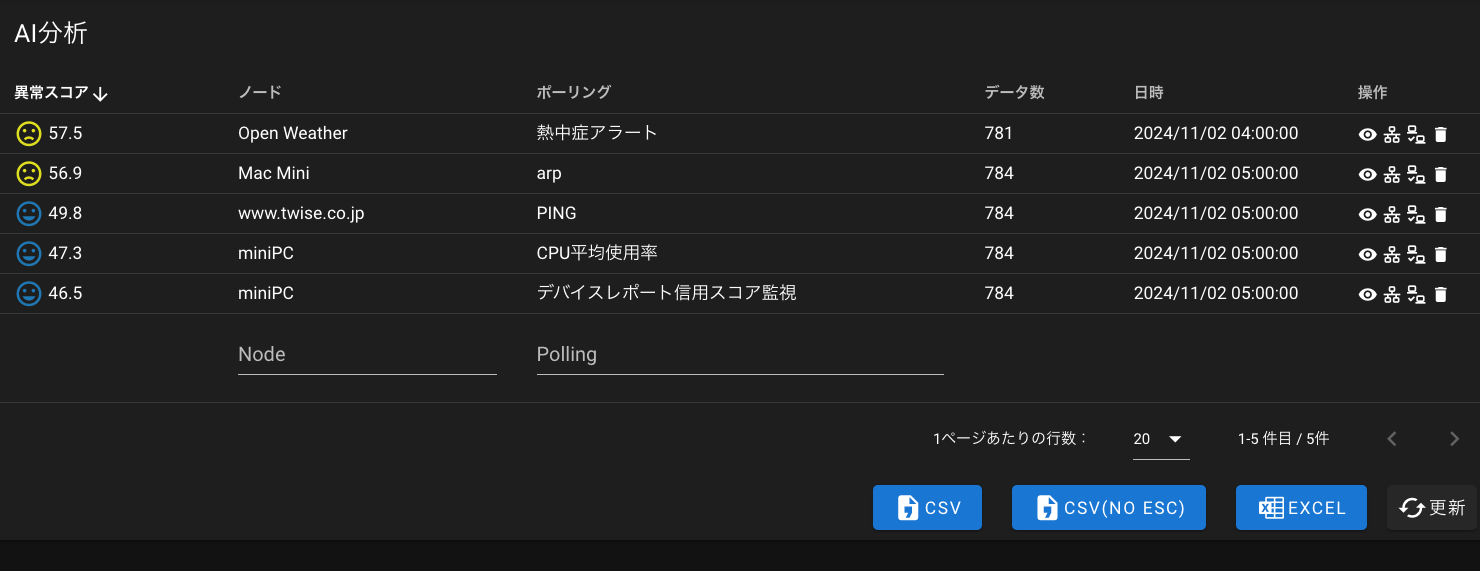
ポーリングの結果の数値から異常を検知するAI分析という名前にしています。
TWSNMP FCでは両方のアルゴリズムに対応しています。(最初は、LOFだけだったのですが、Isolation Forestを知ってから追加しました。
切り替えできます。
同じデータでテストするとLOFはIsolation Forestの40倍もメモリーを使用しました。
Isolation Forestを使ったほうがよいと思います。


