はじめに
MATLAB のグラフのプロットは、特別な事情がなければ、 CameraViewAngleMode を既定の auto モードにしたままで行うのが普通です。この auto モードのお陰で、図のスケーリングなどの細かいことに気を遣わなくても、常に自動的に、ちょうど良い大きさのグラフが描かれるので大変助かっています。私もつい最近まで、このモードを manual にして使ったことはありませんでした。
ところが、CameraViewAngleMode が manual になるように、 camva コマンド(CameraViewAngle プロパティ)を意図的に使ってみたところ、意外に役立つ場面があることが分かりました。そこで、その数例についてここで紹介してみたいと思います。(環境:MATLAB R2019a)
応用例その1
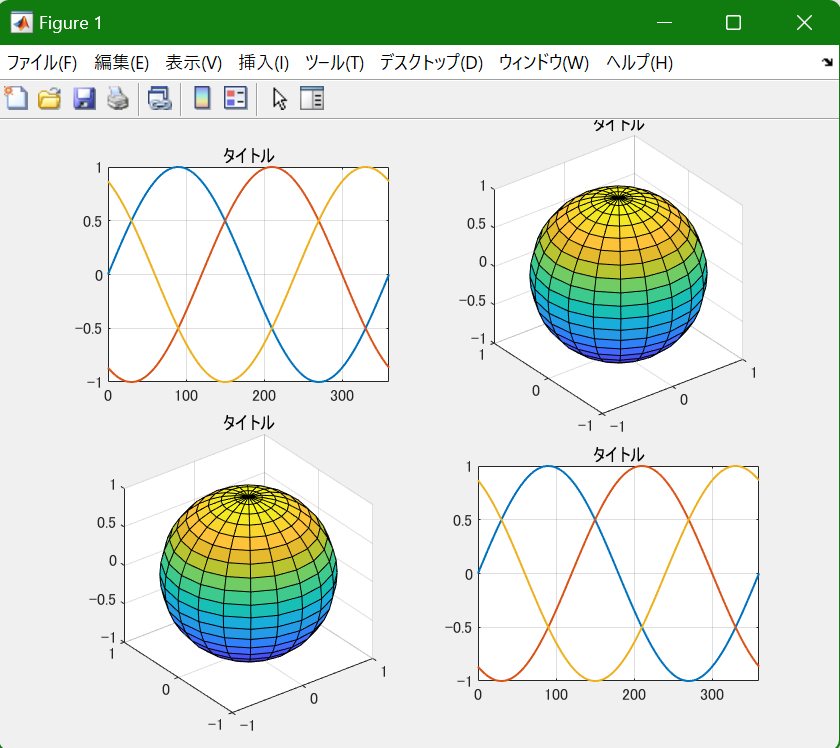
subplot コマンドで複数の図を並べて描いたとき、下図のように、2D 図に比べて 3D 図が小さめに表示されることが多く、物足りなさを感じることがあります。
このようなときには、次の4行を追加することでスッキリと改善することができます。camva の引数の 8 は、作図結果を見ながら調整して適当に決めた値です。小さな値にするほど図のサイズは大きくなります。
for n=2:3
  subplot(2,2,n);
  camva(8);         % 2番目、3番目の axes を拡大
end
応用例その2
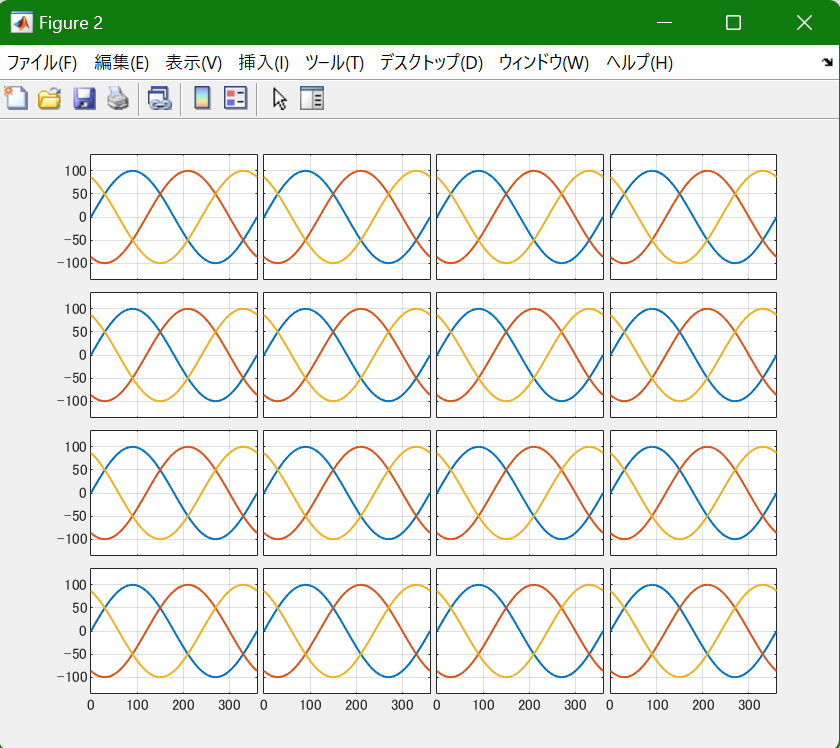
subplot で多数の図を描くと、どうしても一つ一つの図が小さくなってしまいます。これは、タイトルや軸の数値ラベル用のスペースを確保するためで仕方がないことです。しかし、これらのスペースが不要な場合には、肝心の図の領域をもっと大きくとりたくなります。
このようなときにも、次の4行を加えることで簡単に解決することができます。この4行以外にも、軸の目盛り数値の一部を削除するなどの小細工はしていますが、中心的な部分は camva(5.5); だけです。
実は、この効果を得るためには、他にも配慮が必要な面倒なことがあります。しかし、詳細は「おわりに」の項まで持ち越します![]() 。
。
for n=1:16
  subplot(4,4,n);
  camva(5.5);         % 全 axes 拡大
end
応用例その3
これで物足りなければ、さらに下記を加えて、一部の図だけを強調したりすることもできます。
subplot(4,4,10);
camva(2.3);           % 10番目を拡大
応用例その4
下図は CameraViewAngleMode が auto の状態で描いた球体です。
これでも十分に美しい図ですが、次の1行を加えれば、もう美術品の域に達します。
camva(3.5); % 拡大
おわりに
先に、「図4の作図には、その他の面倒な配慮も必要」と勿体ぶったことを書きましたが、その内容は次のとおりです。
- camva コマンドを適用する 2D 図には、axis equal が設定されていること。
axis equal でない 2D 図では、拡大縮小が不安定になります。これを避けるため、図3や4では、縦軸のスケールを無理やり 100 倍にして、axis equal でも自然な形に見えるように小細工しています。もし、本来のスケールで目盛りたいのであれば、yticklabels コマンドを使って修正する必要があります。
ここには書きませんでしたが、裸眼立体視図を描く場合にも camva コマンドは必須になります。これを使わずに描くと、左右の図の大きさを揃えることができなくなり、困ったことになります。
なお、camva の引数は思考錯誤の結果で行き着いた適当な値のように書きましたが、定量的な根拠を示されなければ満足できない場合には、下記の弊記事を参考にしてください。
【MATLAB】今更ながら、三次元プロットの視線関連コマンドを探究してみた
プログラム
参考までに、図1~7を描いたプログラムを添付しておきます。
なお、記事の本題とは直接の関係はありませんが、【タイトルバーまで含めた figure の全体を png 画像化】のために作った【ローカル関数 fig_full_capture() 】も自慢できる労作です。
% view_point40.m

% camva コマンド (CameraViewAngle プロパティ) の応用例

clear
close all

th=[0:1:360];

% ■■■■■■■
% subplot(2,2,*)
% ■■■■■■■

hf1=figure(1);

subplot(2,2,1);
plot(th,sind(th),'LineWidth',1);
hold on
plot(th,sind(th-120),'LineWidth',1);
plot(th,sind(th+120),'LineWidth',1);
grid on
axis tight
title('タイトル');

subplot(2,2,2);
[X,Y,Z]=sphere;
surf(X,Y,Z);
axis equal
title('タイトル');

subplot(2,2,3);
surf(X,Y,Z);
axis equal
title('タイトル');

subplot(2,2,4);
plot(th,sind(th),'LineWidth',1);
hold on
plot(th,sind(th-120),'LineWidth',1);
plot(th,sind(th+120),'LineWidth',1);
grid on
axis tight
title('タイトル');

% ========== 図01出力(ローカル関数呼び出し) ==========
fig_full_capture(hf1,1);

for n=2:3
  subplot(2,2,n);
  camva(8);           % 2番目、3番目の axes を拡大
end

% ========== 図02出力 ==========
fig_full_capture(hf1,2);

% ■■■■■■■
% subplot(4,4,*)
% ■■■■■■■

hf2=figure(2);

for n=1:16
  subplot(4,4,n);
  plot(th,100*sind(th),'LineWidth',1);
  hold on
  plot(th,100*sind(th-120),'LineWidth',1);
  plot(th,100*sind(th+120),'LineWidth',1);
  grid on
  axis equal
end

% ========== 図03出力 ==========
fig_full_capture(hf2,3);

for n=1:16
  subplot(4,4,n);
  camva(5.5);         % 全 axes 拡大
end

for n=[2 3 4 6 7 8 10 11 12 14 15 16]
  subplot(4,4,n);
  yticklabels('');
end
for n=1:12
  subplot(4,4,n);
  xticklabels('');
end

% ========== 図04出力 ==========
fig_full_capture(hf2,4);

hs=subplot(4,4,10);
camva(2.3);           % 10番目を拡大
set(gca,'Color','#ffd');
title('タイトル');

axes(hs);   % (4,4,10) を最上層に。

% ========== 図05出力 ==========
fig_full_capture(hf2,5);

% ■■■■■■■
% plot  (1行1列)
% ■■■■■■■

hf3=figure(3);

surf(X,Y,Z);
axis equal
title('タイトル');

% ========== 図06出力 ==========
fig_full_capture(hf3,6);

camva(3.5);           % 拡大

% ========== 図07出力 ==========
fig_full_capture(hf3,7);

% =============================
% ローカル関数
% =============================

% MATLAB figure のタイトルバーなどまで含めた画像の png ファイル化
% ===============================================================

function fig_full_capture(hf,Nr)

  % 【入力】
  %  hf: png 画像化する figure のハンドル
  %  Nr: ファイル名 view_point40_ の後に付ける識別番号(1~99の数値)
  % 【出力】
  %  png ファイル(返り値は無し)

  figure(hf);
  drawnow
  pause(0.2);               % これがないと未完成図を取り込んでしまう

  Ss=get(0,'ScreenSize');   % モニタのサイズ [0 0 幅 高さ] [px]
  Posi=hf.Position;         % 横幅は inner で丁度良い [px]
  Poso=hf.OuterPosition;    % 高さは inner では小さすぎる。
                            %  outer でほぼOKだが、やや大き目。
  dh=-8;                    % その大き目を補正する量 [px]。
                            %  旧バージョンに存在した縁取りの幅?

  % スクリーンキャプチャする範囲。
  %   MATLAB は左下が [0 0]、JAVA は左上が [0 0]。
  %  また、1920×1200[px] ディスプレイを 150% 倍率の 1280×800[px]
  %  として使っているが、
  %  MATLAB は 1280×800[px] 、JAVA は 1920×1200[px] と見なしている。
  pos=[Posi(1) ...
       Ss(4)-Posi(2)-(Poso(4)+dh) ...
       Posi(3) ...
       (Poso(4)+dh)]*1.5;

  % スクリーンキャプチャ
  robot = java.awt.Robot();                                % JAVA
  rect = java.awt.Rectangle(pos(1),pos(2),pos(3),pos(4));  % JAVA
  cap = robot.createScreenCapture(rect);                   % JAVA

  WW=cap.getWidth;                               % MATLAB ← JAVA
  HH=cap.getHeight;                              % MATLAB ← JAVA
  % RGB イメージの取り出し
  aaa=cap.getRGB(0,0,cap.getWidth,cap.getHeight, ...
                            [],0,cap.getWidth);  % MATLAB ← JAVA
         % 画素数分の要素を持つ int32 形式の列ベクトル
  rgb = typecast(aaa,'uint8');
         % 画素数の4倍の要素を持つ uint8 形式の列ベクトル

  % MATLAB の画像形式に合うように並べ替え。
  %  4 個ごとにあるダミーデータ(alpha かも)は捨てる。
  imgData = zeros(HH,WW,3,'uint8');
  imgData(:,:,1) = reshape(rgb(3:4:end),WW,[])';
  imgData(:,:,2) = reshape(rgb(2:4:end),WW,[])';
  imgData(:,:,3) = reshape(rgb(1:4:end),WW,[])';

  % 画像の png ファイル化

  %{
  hf2=figure(100);   % 確認用の取得画像表示
  hf2.Color='w';     %  通常はコメント化
  imshow(imgData)    %  通常はコメント化
  %}

  fname=['view_point40_' num2str(Nr,'%02u') '.png'];
  imwrite(imgData,fname);  % 取得画像の png ファイル化
end


