概要
Kibana6.2.0がリリースされました。
https://www.elastic.co/blog/kibana-6-2-0-released
We’ve made it easier for you to create interactive visualizations by adding support for Vega, a data visualization language. Now you can concentrate on the visualizations you need, and not on the integration plumbing and plugin maintenance.
Vegaがサポートされました、と。
これまでVegaプラグインを別途入れる必要がありましたが、本体で出来ると素晴らしいですね。
まだExperimentalとありますが、さっそくやってみましょう。
再利用
以前、「Kibana でローソク足チャートを出してみる」をやったので、
データは、これをまるまる再利用することにします。
Visualizationの作成
New Visualization
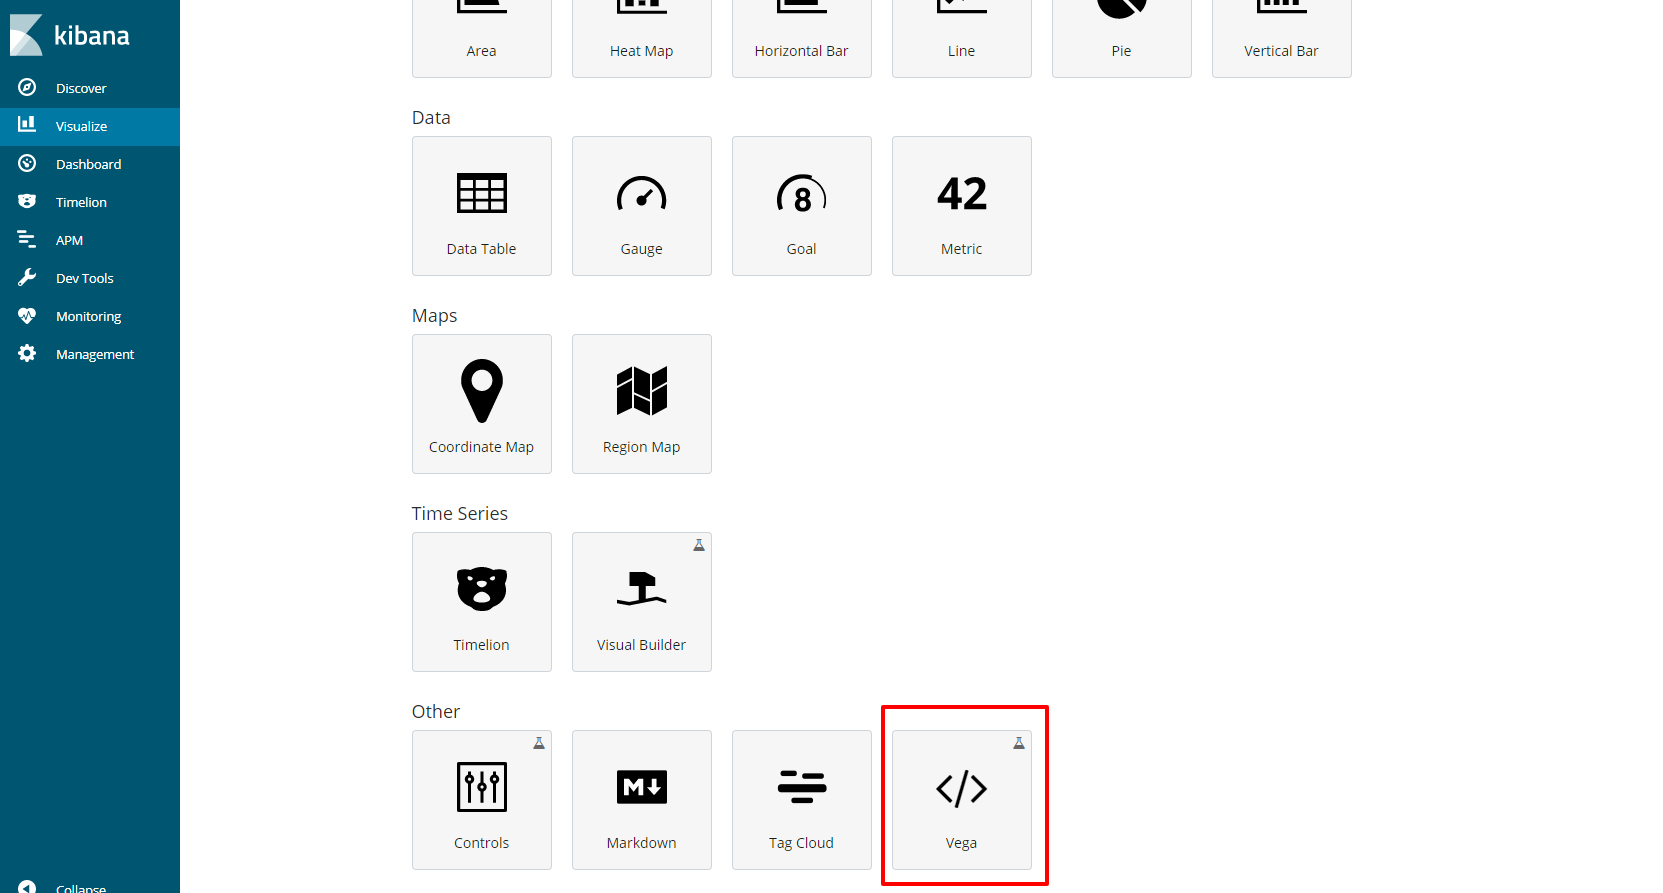
Visualizationの新規作成を選択すると、下の方にVegaの文字列が見えます。
まだExperimentalだということを示すメスフラスコのようなアイコンが見えます。
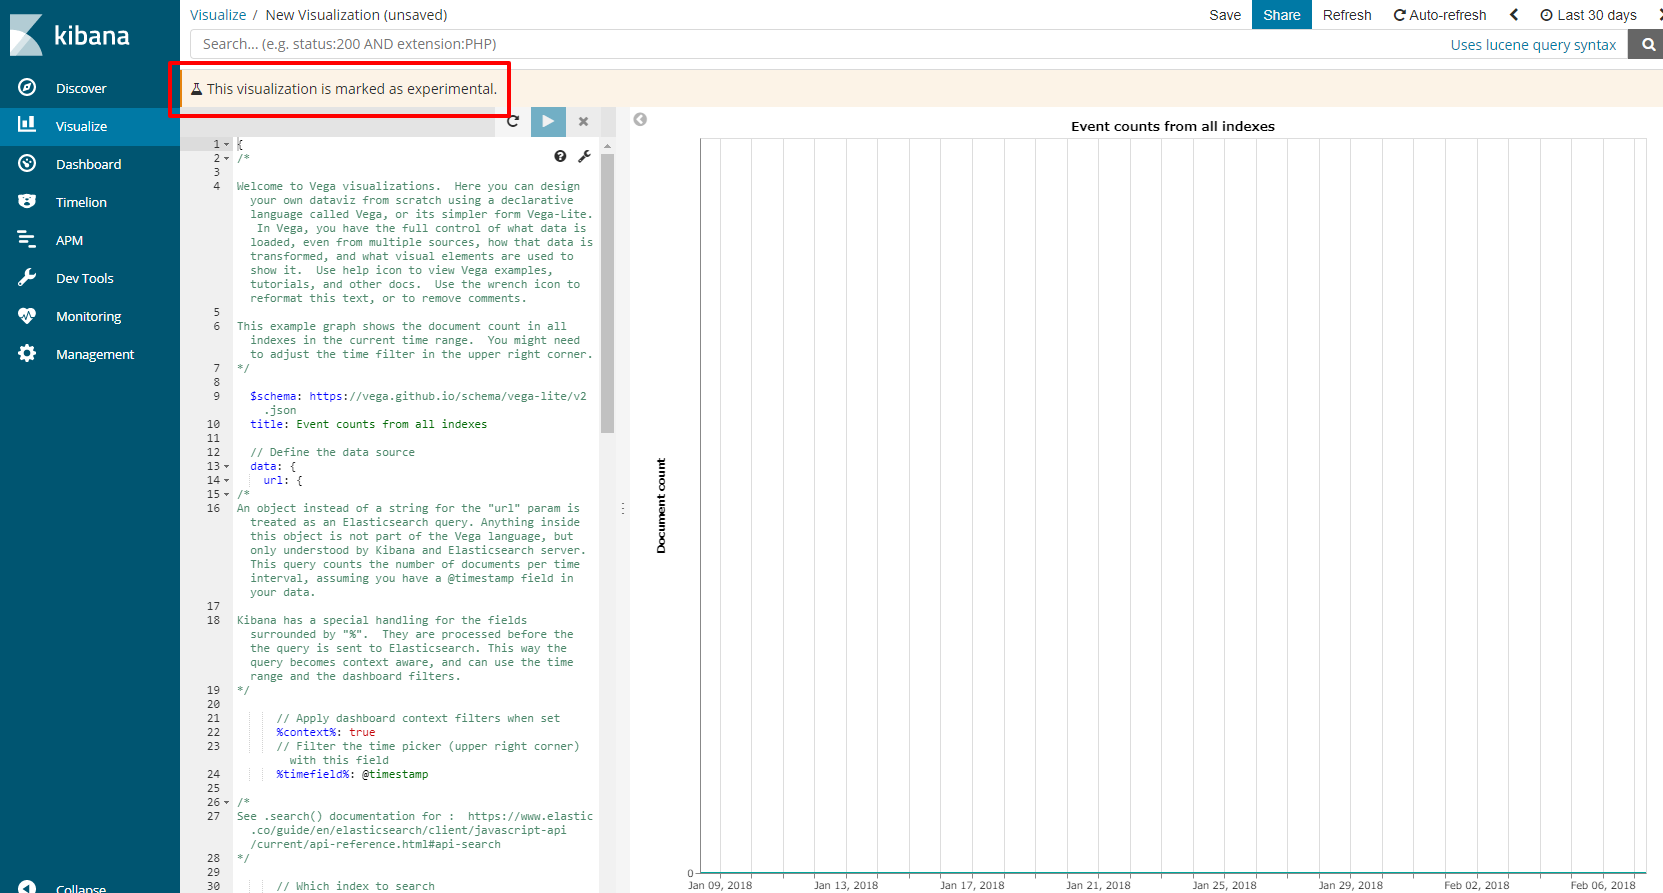
初期画面
最初に開いた段階では、このようにVegaの記法についてコメントで詳しく書いてくれています。
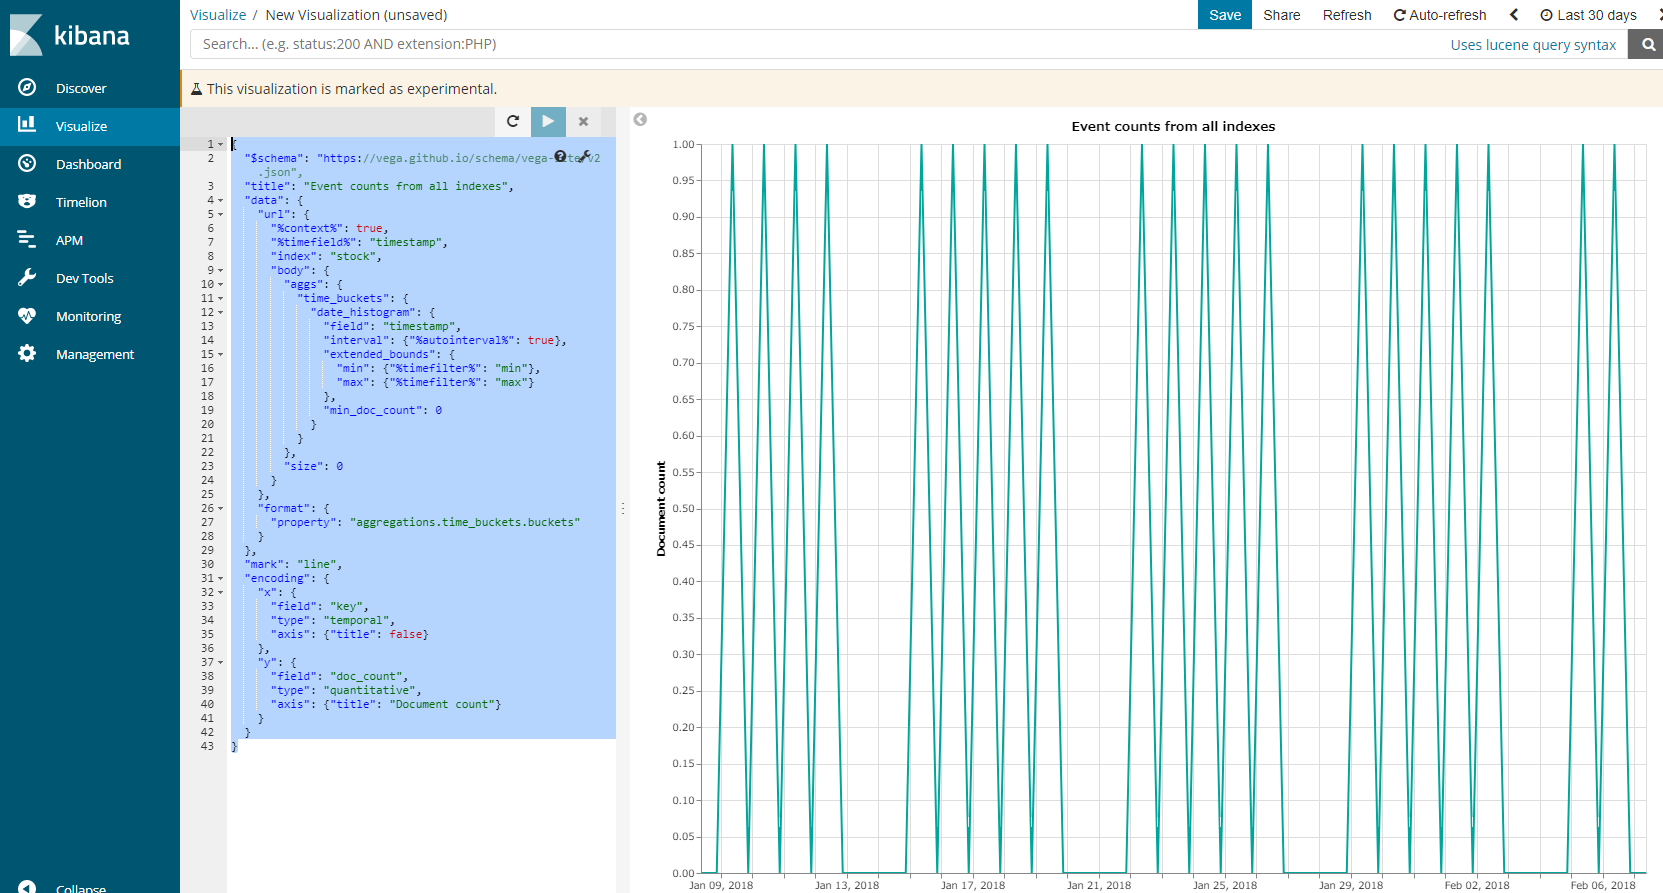
コメントを除去して、"stock"インデックスから、doc_countをLineチャートにする例がこちら。
{
  "$schema": "https://vega.github.io/schema/vega-lite/v2.json",
  "title": "Event counts from all indexes",
  "data": {
    "url": {
      "%context%": true,
      "%timefield%": "timestamp",
      "index": "stock",
      "body": {
        "aggs": {
          "time_buckets": {
            "date_histogram": {
              "field": "timestamp",
              "interval": {"%autointerval%": true},
              "extended_bounds": {
                "min": {"%timefilter%": "min"},
                "max": {"%timefilter%": "max"}
              },
              "min_doc_count": 0
            }
          }
        },
        "size": 0
      }
    },
    "format": {
      "property": "aggregations.time_buckets.buckets"
    }
  },
  "mark": "line",
  "encoding": {
    "x": {
      "field": "key",
      "type": "temporal",
      "axis": {"title": false}
    },
    "y": {
      "field": "doc_count",
      "type": "quantitative",
      "axis": {"title": "Document count"}
    }
  }
}
Kibanaの右上にある時間指定をVegaに反映させるためには、この部分が肝です。
| 値 | 内容 |
|---|---|
| %context% | true |
| %timefield% | dateが入ったフィールド名(ここではtimefield) |
他のVisualizationと同じく、再生ボタンのようなものを押すと、右にグラフが表示されます。
ローソクチャート
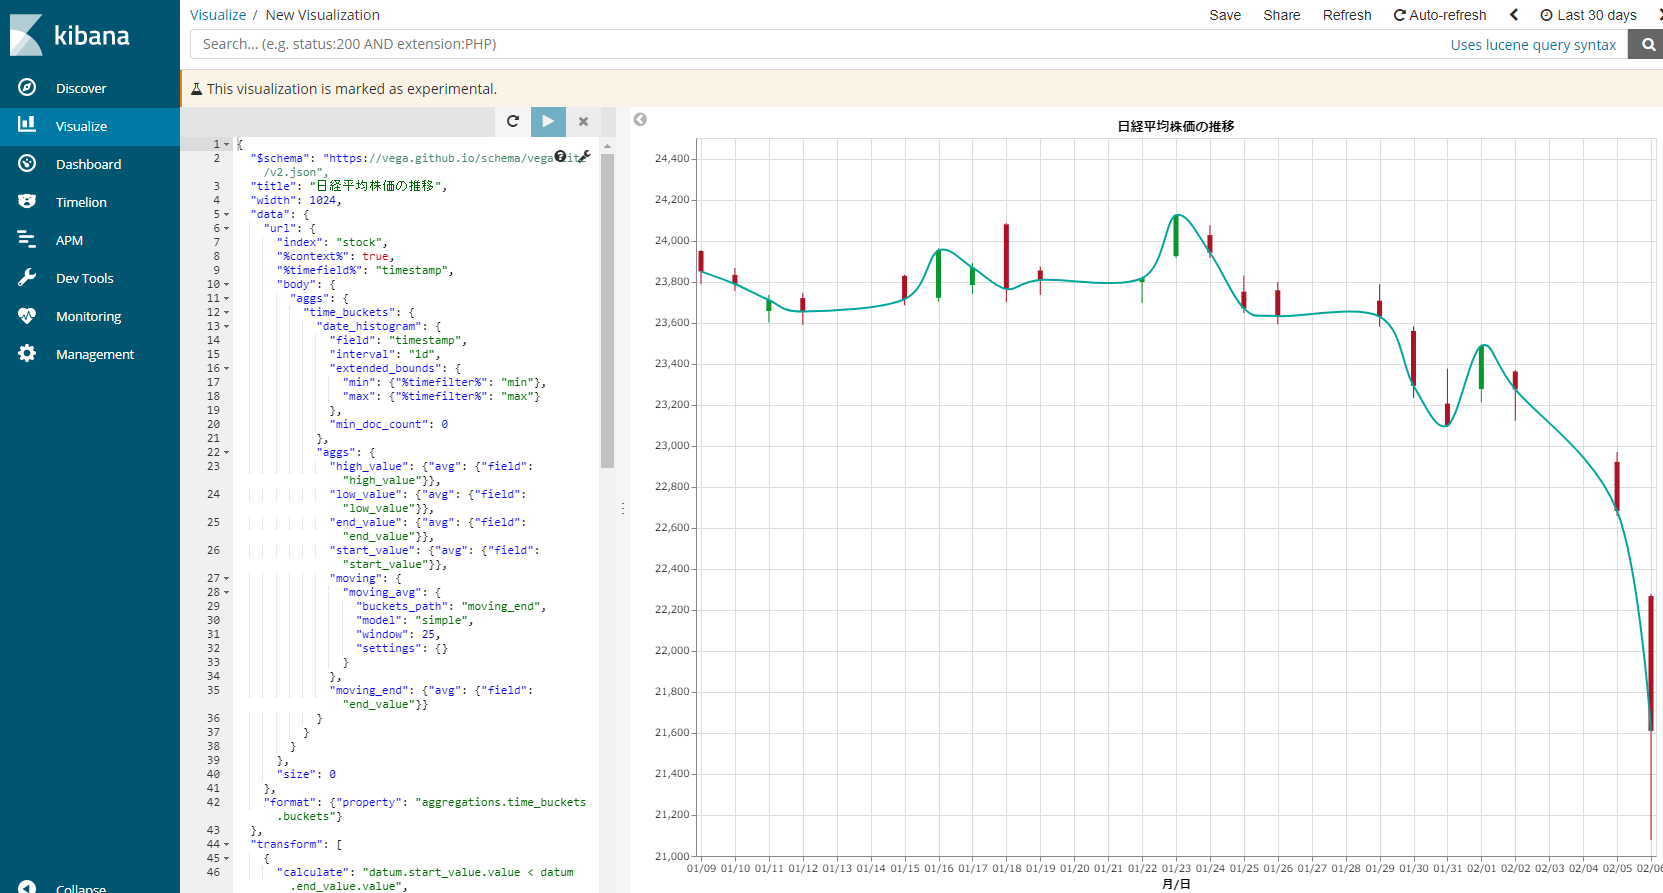
%context%, %timefield%に注意して、ローソク足を書いた例がこちら。
それにしても、ナイスなナイアガラですねぇ・・・。今ならビットコインとかでグラフを書くのが面白いかも。
左の部分は ここにおいてあります。
おまけ
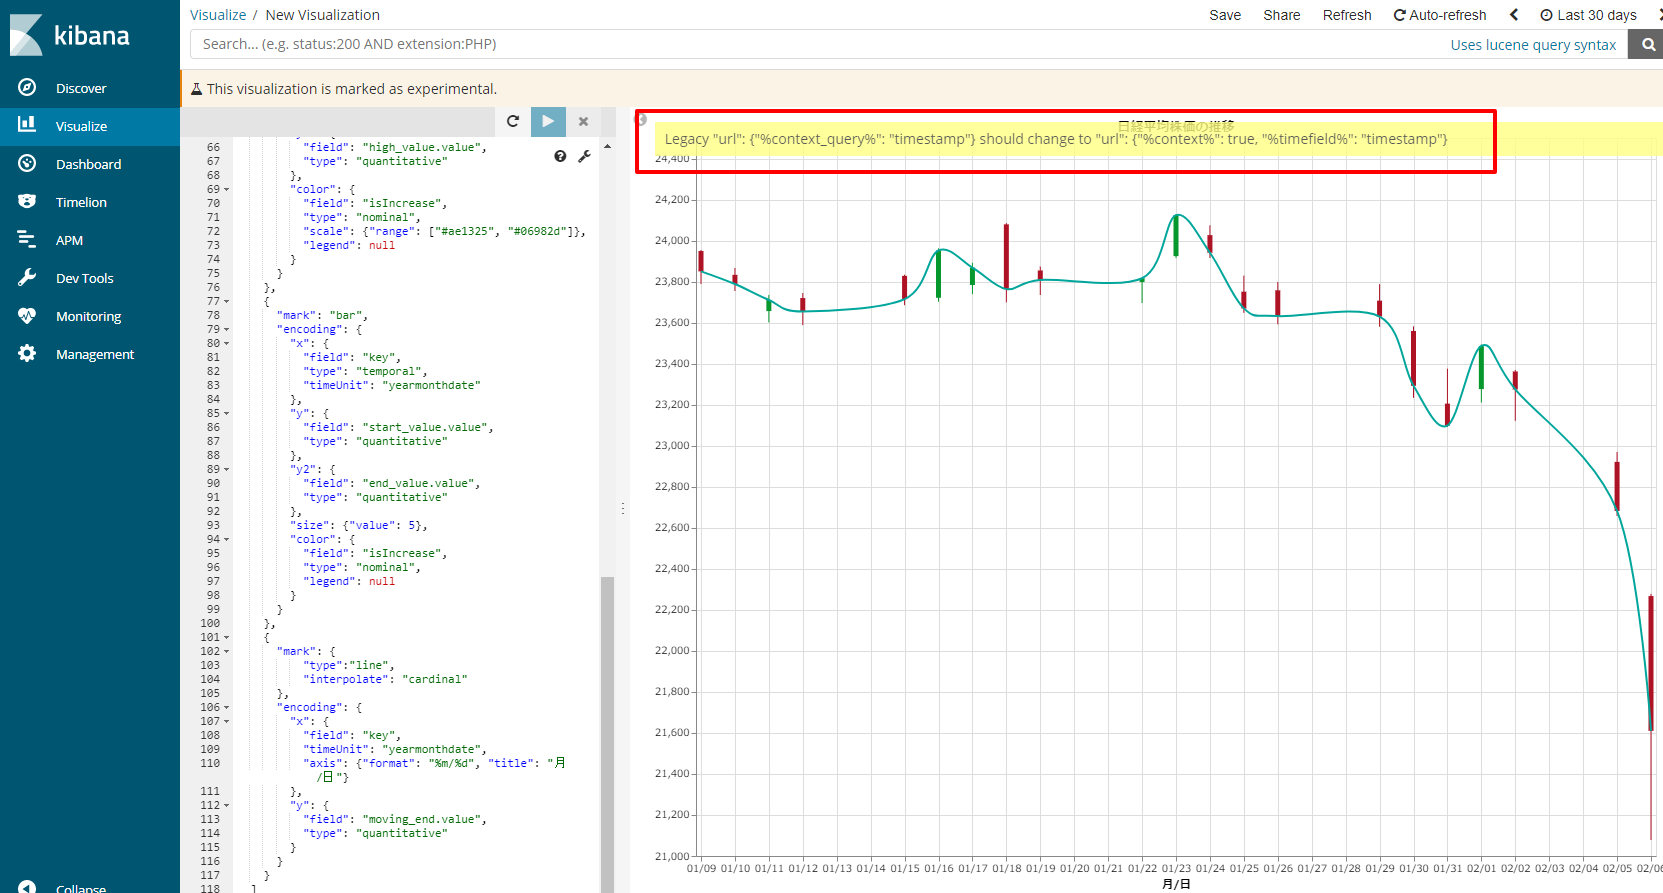
「Kibana でローソク足チャートを出してみる」のときに使用したVegaの記述をそのまま使うと、黄色い警告がでます。
Legacy "url": {"%context_query%": "timestamp"} should change to "url": {"%context%": true, "%timefield%": "timestamp"}
Legacyなのは、さっさと置き換えてしまいましょう。
雑感
リリースの案内にはこう書いてあります。
Now you can concentrate on the visualizations you need, and not on the integration plumbing and plugin maintenance.
自分でプラグインの開発(や、メンテナンス)なく、Vegaの豊富な部品を使って可視化することに集中できるようになった、というのは助かりますね!
Vegaの記法をわかりやすく、いろんな可視化のパターンで解説するマンが現れると、もっと流行ると思います!
