はじめに
Vdebugを使用してVim上でPHPをデバッグする方法を記述します。
環境
- CentOS 6.4
- vim 7.2
- Vundle 0.10.2
- Vdebug 1.4.2
- PHP 5.3
- xdebug 2.1.4
Vimのインストール
$ sudo yum install vim-enhanced
Vundleのインストール
- Vundleをgitからcloneします。
$ git clone https://github.com/gmarik/Vundle.vim.git ~/.vim/bundle/Vundle.vim
- vimのpluginの設定を追加します。
~/.vimrc
set nocompatible
filetype off

set rtp+=~/.vim/bundle/Vundle.vim
call vundle#begin()

Plugin 'gmarik/Vundle.vim'

call vundle#end()
filetype plugin indent on
Vdebugのインストール
vimのpluginの設定を追加します。
~/vimrc
Plugin 'joonty/vdebug.git'
プラグインを追加します。
$ vim +BundleInstall +qall
PHP及びXdebugのインストール
yumでインストールします。
$ sudo yum install php php-pecl-xdebug
xdebugが認識されていることを確認しておきます。
$ php -m | grep xdebug
xdebug
xdebugの設定を行います。
xdebug.remote_enable=1 のみ設定すれば、あとはデフォルト値でスクリプトをデバッグできるようになります。
/etc/php.d/xdebug.ini
; Enable xdebug extension module
zend_extension=/usr/lib64/php/modules/xdebug.so

[debug]
xdebug.auto_trace=0
xdebug.cli_color=0
xdebug.collect_assignments=0
xdebug.collect_includes=1
xdebug.collect_params=0
xdebug.collect_return=0
xdebug.collect_vars=0
xdebug.coverage_enable=1
xdebug.default_enable=1
xdebug.dump.*=
xdebug.dump_globals=1
xdebug.dump_once=1
xdebug.dump_undefined=0
xdebug.extended_info=1
xdebug.file_link_format=
xdebug.force_display_errors=0
xdebug.force_error_reporting=0
xdebug.halt_level=0
xdebug.idekey=
xdebug.manual_url="http://www.php.net"
xdebug.max_nesting_level=100
xdebug.overload_var_dump=1

xdebug.profiler_append=0
xdebug.profiler_enable=0
xdebug.profiler_enable_trigger=0
xdebug.profiler_output_dir="/tmp"
xdebug.profiler_output_name="cachegrind.out.%p"

xdebug.remote_autostart=0
xdebug.remote_connect_back=0
xdebug.remote_cookie_expire_time=3600
;xdebug.remote_enable=0
xdebug.remote_enable=1
xdebug.remote_handler=dbgp
xdebug.remote_host="localhost"
xdebug.remote_log=
xdebug.remote_mode="req"
xdebug.remote_port=9000

xdebug.scream=0
xdebug.show_exception_trace=0
xdebug.show_local_vars=0
xdebug.show_mem_delta=0

xdebug.trace_enable_trigger=0
xdebug.trace_format=0
xdebug.trace_options=0
xdebug.trace_output_dir="/tmp"
xdebug.trace_output_name="trace.%c"

xdebug.var_display_max_children=128
xdebug.var_display_max_data=512
xdebug.var_display_max_depth=3
PHPのスクリプトのデバッグ
- xdebug実行用のスクリプトを作成します。
php-xdebug
# !/bin/bash
export XDEBUG_CONFIG="idekey=xdebug"
/usr/bin/php "$@"
- 実行権限を付与します。
chmod +x php-xdebug
任意のPHPのスクリプトをvimで開きます。
$ vim sample.php
<F10>で任意の場所にブレークポイントを設定し、
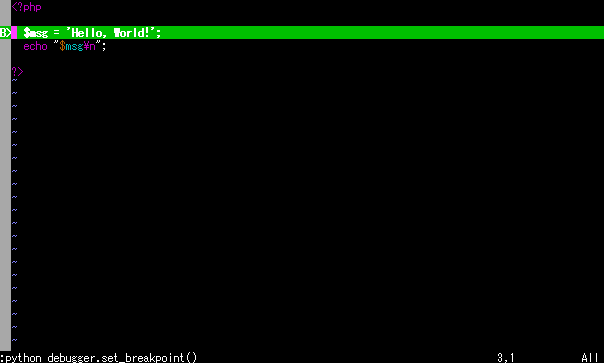
<F5>でデバッグを開始します。
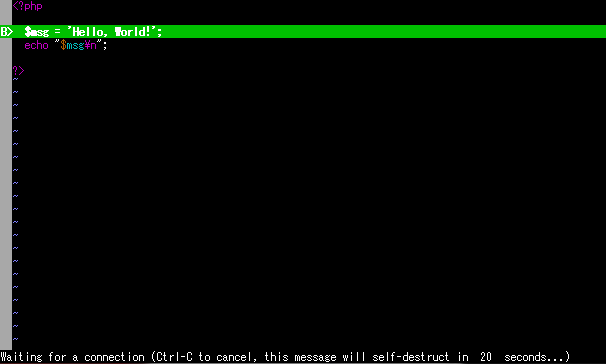
別のターミナルよりデバッグを行うスクリプトを実行することで、ステップ実行を行えるようになります。
$ ./php-xdebug sample.php
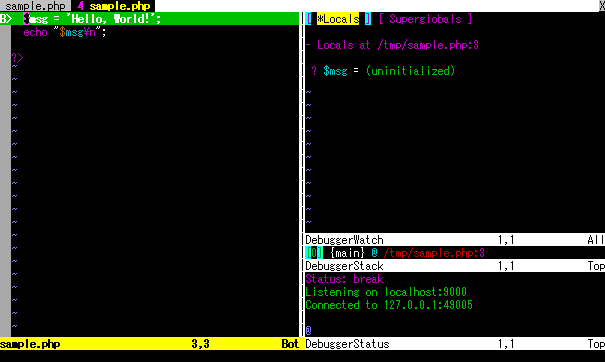
<F6>でデバッグを停止します。