今年頭から仙台市場のデータをAWS lambdaを利用してS3に溜め込んでいる。
ある程度溜まったので、確認してみる。
読み込み等
s3_read.ipynb
# the AWS SDK for Python (Boto3) の読み込み
!pip install boto3 -q
import pandas as pd
import boto3
# ERRORがでるけどあまり気にしない。

# S3アクセス準備
# KEY, SECRETは 準備して、変数に入れておく。
s3 = boto3.resource('s3',
                       region_name="us-east-1",
                       aws_access_key_id=KEY,
                       aws_secret_access_key=SECRET
                   )

bucket=s3.Bucket('sendaimarket')

# file一覧の取得
files=[obj_summary.key for obj_summary in bucket.objects.all()]

# すべてのファイルを結合したデータフレームの作成
import io

mdf=[]

for i in files:
    response = s3.Object('sendaimarket',i)
    body_in = response.get()['Body'].read()

    buffer_in = io.BytesIO(body_in)

    df_in = pd.read_csv(
        buffer_in
    )
    mdf.append(df_in)

appended_data = pd.concat(mdf)

# データの加工
appended_data['date']=pd.to_datetime(appended_data['date'])
appended_data.set_index('date',inplace=True)
## lambdaでつくったCSVだと、重複部分がかなりあったので、削除
df=appended_data.drop_duplicates()

# グラフの表示
miyagi_hourensou=df[(df['area']=='宮城') & (df['product_name'].str.contains('ほうれん草')) ]

import matplotlib.pyplot as plt
import matplotlib.dates as mdates

fig, ax = plt.subplots(figsize=(10,10))
ax.plot(miyagi_hourensou.index,miyagi_hourensou.high_price.astype(int))
ax.plot(miyagi_hourensou.index,miyagi_hourensou.low_price.astype(int))
fmt_half_year = mdates.MonthLocator(interval=1)
ax.xaxis.set_major_locator(fmt_half_year)
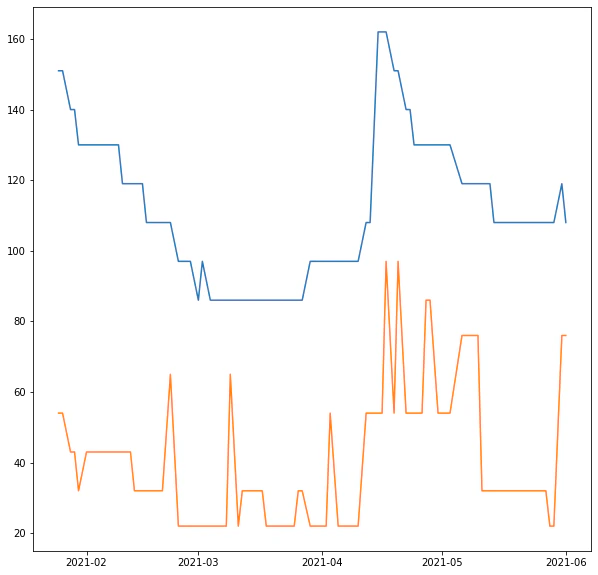
三月安いな〜![]()
解説
- IAMできちんとユーザを作って、
KEYとSECRETは控えておく- これらは実際いったんファイルに書き出して読み出しています。セキュリティ上の問題で割愛
-
io.ByteIO()なのはget()で読み出したデータはバイナリーデータ - データフレームをリストに入れておけば
pd.concat()で一つになる。もちろん列は一緒にしておく必要がある。 -
str.contins()で_ほうれん草_を選択しているのは_ほうれん草 L_があるから - _matploblib_の例をそのまま使って月ごとの表示に加工している。
まとめ
90ものファイルの読み込みに10秒程度かかったので、1年溜まったら一つのファイルにしてもいいかもしれないなと思いました。
でみる、出荷最盛期と値段の波が一緒なのはしかたないんでしょうね。