

こんばんは。torippy1024です。
今回は、Splunk Add-On for OpenTelemetry Collectorを使ったOpenTelemetry Collectorの設定について勉強したことを書きます。
Splunk Add-On for OpenTelemetry Collectorとは
Splunk Add-On for OpenTelemetry Collectorは、Splunkが開発しているOpenTelemetryを使用したAdd-onです。splunkbase上で公開されています。
Splunk Add-onですので、Forwarder上のAppとして動作するものとなります。
実は、Splunkが開発しているOpenTelemery には二種類があり、他にSplunk Distribution of the OpenTelemetry CollectorというDistributionもありますが、ここではAdd-onとしてのOpenTelemetry Collectorに焦点を当てて解説します。
Add-onとDistributionの差異は以下を参照してください。
ざっくりいい加減には、Splunk Forwarder上のAdd-onとして管理したい場合はAdd-on版を利用し、Kubernetes環境や、WindowsのAutoDiscovery機能などの一部のAdd-onで利用不可な機能を使用したい場合はDistributionを利用することになるようです。
https://help.splunk.com/en/splunk-observability-cloud/manage-data/splunk-distribution-of-the-opentelemetry-collector/get-started-with-the-splunk-distribution-of-the-opentelemetry-collector/splunk-add-on-for-opentelemetry-collector
OpenTelemetry Collectorの基本的な考え方
公式サイトには以下のような図があります。
アーキテクチャー図
https://opentelemetry.io/docs/collector/
構成要素の説明
https://opentelemetry.io/docs/collector/components/
Splunk Documents上の構成要素の説明
https://help.splunk.com/en/splunk-observability-cloud/manage-data/splunk-distribution-of-the-opentelemetry-collector/get-started-with-the-splunk-distribution-of-the-opentelemetry-collector/collector-components
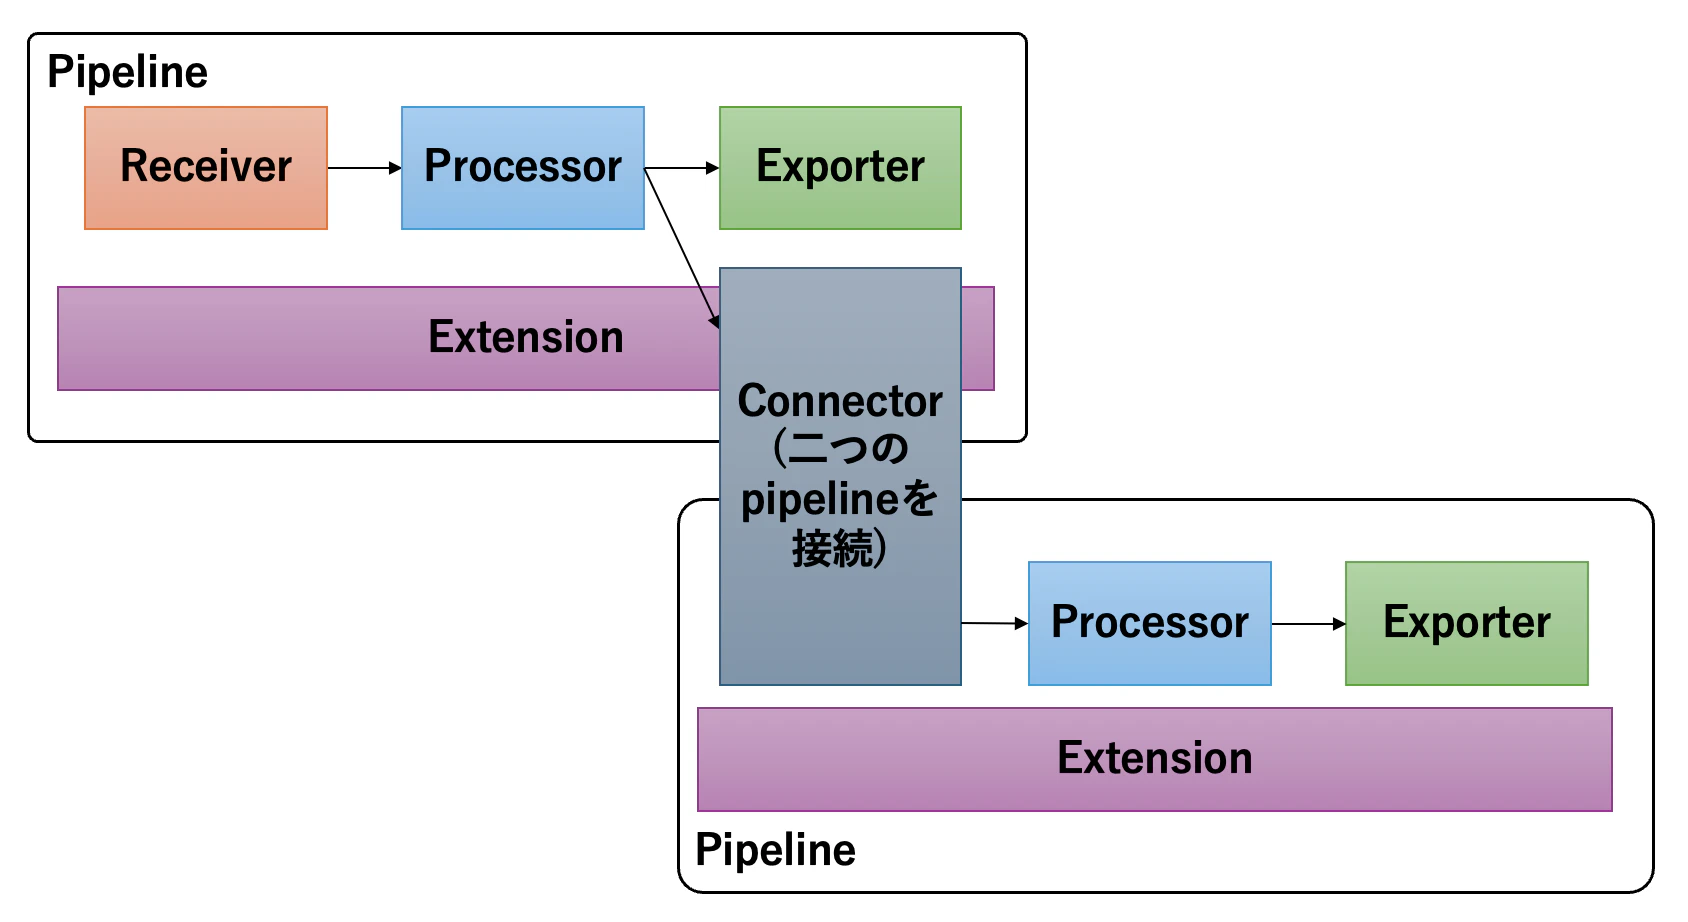
簡単に説明すると、Collectorを構成する要素には、Receivers、Processors、Exporters、Connectors、Extensionsの5つがあります。
テレメトリーデータは、Receivers、Processors、Exportersの順で処理されます。これらデータの流れをまとめたものがpipelineと呼ばれます。
これらをYAMLファイル上で定義することで、OTelの仕組みに沿ってログ/トレース/メトリクスを転送できるようになります。
テレメトリーデータの処理の流れ
| 名前 | 役割 |
|---|---|
| Receivers | データの入力を行うコンポーネント。テレメトリデータ(ログ/トレース/メトリクス)を取得し、次のコンポーネント(Processorsなど)に渡す。 |
| Processors | Receiversが取得したデータに対し、変換・フィルタ・エンリッチを行うコンポーネント。pipeline上で定義した順序で処理を行う。 |
| Exporters | Processorsで処理したデータを指定した外部(Splunkなど)にエクスポートするコンポーネント |
| Connectors | 2つのpipelineを接続する特殊なコンポーネント。あるpipelineのExporterとして機能しつつ、別pipelineのReceiverとしても機能する。 |
| Extensions | テレメトリデータのフロー外で動作する補助機能。ヘルスチェックや認証などを行う。 |
Splunk Add-On for OpenTelemetry Collectorで事前定義されているコンフィグ
コンフィグについて学ぶ場合は、実際にコンフィグファイルを参照・修正して動作させてみるのが一番です。
が、この記事ではコンフィグファイルの構成を見て概要を掴むことまでを目標にします。
splunkbaseより、実際にAdd-on本体をダウンロードして内容をみてみましょう。(本記事では、執筆時の最新版であるV1.12.0の内容を参照しています)
https://splunkbase.splunk.com/app/7125
Splunk_TA_otel
├─ configs
│  │─ discovery
│  │   └─ config.d.linux
│  │       │─ extensions
│  │       │   ├─ docker-observer.discovery.yaml
│  │       │   ├─ host-observer.discovery.yaml
│  │       │   └─ k8s-observer.discovery.yaml
│  │       │─ receivers
│  │       │   ├─ apache.discovery.yaml
│  │       │   ├─ envoy.discovery.yaml
│  │       │   ├─ istio.discovery.yaml
│  │       │   ├─ jmx-cassandra.discovery.yaml
│  │       │   ├─ kafkametrics.discovery.yaml
│  │       │   ├─ mongodb.discovery.yaml
│  │       │   ├─ mysql.discovery.yaml
│  │       │   ├─ nginx.discovery.yaml
│  │       │   ├─ oracledb.discovery.yaml
│  │       │   ├─ postgresql.discovery.yaml
│  │       │   ├─ rabbitmq.discovery.yaml
│  │       │   ├─ redis.discovery.yaml
│  │       │   ├─ sqlserver.discovery.yaml
│  │       │   └─ weaviate.discovery.yaml
│  │       └─ properties.discovery.yaml.example
|  ├─ ta-agent-config.yaml
|  ├─ ta-agent-to-gateway-config.yaml
|  └─ ta-gateway-config.yaml
├─ default
|  ├─ access_token
|  ├─ app.conf
|  └─ inputs.conf
├─ linux_x86_64
│  └─ bin
│      ├─ agent-bundle_linux_amd64.tar.gz
│      ├─ Splunk_TA_otel.sh
│      └─ otelcol_linux_amd64
├─ README
│  └─ inputs.conf.spec
├─ static
│  ├─ appIcon.png
│  └─ appIcon_2x.png
├─ windows_x86_64
│  └─ bin
│      ├─ agent-bundle_windows_amd64.zip
│      ├─ Splunk_TA_otel.cmd
│      ├─ Splunk_TA_otel_utils.ps1
│      └─ otelcol_windows_amd64.exe
└─ README.md
おおっと、急に勉強する気がなくなってきましたね。(最初に全てを理解しようとすると心が折れる。。。)
とりあえずトップのサブディレクトリについて簡単に概要をまとめました。最初はこれくらいの粒度で理解しておけば問題ありません。localディレクトリは初期時点では存在していないため、ユーザーで作成する必要があります。(このお作法は、他のSplunk App/Add-onを使った経験がある人であればおなじみだとは思います)
| ディレクトリ | 概要 | ユーザーによる編集要否 |
|---|---|---|
| configs | OTel Collectorの設定ファイルが保管されている。事前に定義された設定ファイルではなく自作した設定ファイルを使う場合もここに保管する。 | 要(場合による) |
| default | 重要ファイルであるaccess_token、app.conf、inputs.confが格納されている。他のAppと同じく、このディレクトリ内部のファイルは編集しない。 | 不要 |
| linux_x86_64 | Linux用のバイナリファイルが保管されている。Linuxの場合、このディレクトリ配下のSplunk_TA_otel.shがモジュラーインプットとして実行されている。 | 不要 |
| local | default配下のファイルで指定したパラメータを上書きするときに使用する。 | 要 |
| README | inputs.conf.specファイルが格納されている。inputs.confで指定可能なパラメータを確認したいときはこのファイルを参照する。 | 不要 |
| static | 画像ファイルが格納されている。特に意識する必要なし。 | 不要 |
| windows_x86_64 | Windows用のバイナリファイルが保管されている。Windowsの場合、このディレクトリ配下のSplunk_TA_otel.cmdがモジュラーインプットとして実行されている。 | 不要 |
実際にOTel Add-onを使う場合は、ほとんどのユーザーはlocalフォルダを作成し、その配下にaccess_tokenとinputs.confを作成することになると思います。
すでにSplunk Add-onを使った経験がある人であればinputs.confファイルはおなじみかもしれません。
せっかくなので、defaut/inputs.confファイルの中身も見て、どのようなパラメータがデフォルトで指定されているかも見てみましょう。
defaut/inputs.confファイルの中身は以下です。
[monitor://$SPLUNK_HOME/var/log/splunk/Splunk_TA_otel.log]
_TCP_ROUTING = *
index = _internal
sourcetype = Splunk_TA_otel

[Splunk_TA_otel://Splunk_TA_otel]
disabled=false
start_by_shell=false
interval = 0
index = _internal
sourcetype = Splunk_TA_otel
splunk_access_token_file=$SPLUNK_OTEL_TA_HOME/local/access_token
splunk_api_url=https://api.us0.signalfx.com
splunk_bundle_dir=$SPLUNK_OTEL_TA_PLATFORM_HOME/bin/agent-bundle
splunk_collectd_dir=$SPLUNK_OTEL_TA_PLATFORM_HOME/bin/agent-bundle/run/collectd
splunk_ingest_url=https://ingest.us0.signalfx.com
splunk_listen_interface=localhost
splunk_realm=us0
splunk_config=$SPLUNK_OTEL_TA_HOME/configs/ta-agent-config.yaml
上記を見ると、1行目のStanzaに書かれている通り、デフォルトで$SPLUNK_HOME/var/log/splunk/Splunk_TA_otel.logがログの収集対象となっていることがわかります。
また6行目のStanzaで[Splunk_TA_otel://Splunk_TA_otel]が指定されていることから、実はOTel Add-onは、モジュラーインプットとしてSplunk_TA_otelというモジュールを実行する仕組みであることもわかります。
Splunkでは、モジュラーインプットで使用するスクリプトのデフォルトディレクトリをアーキテクチャ(Linux/Windows/Apple (darwin))によって変更することができるため、この仕組みを使ってアーキテクチャによって実行するスクリプトと場所を変更しているということのようです。
https://help.splunk.com/ja-jp/splunk-enterprise/developing-views-and-apps-for-splunk-web/9.0/modular-inputs/create-modular-inputs#architecture-specific-scripts-0
環境変数として定義されているsplunk_api_url、splunk_ingest_url、splunk_realmにはus0という値が含まれています。日本リージョンを使用している場合はこれらをjp0に変更する必要があるということもわかります。
それから、splunk_configで指定しているyamlファイルは結構重要です。「ta-agent-config.yaml」は、エージェントモードで直接Splunk Observability Cloudにメトリクスを転送する場合のコンフィグです。
ゲートウェイモードで動作させる場合は「ta-gateway-config.yaml」を、エージェントして動作させて、ゲートウェイ経由でメトリクスを転送する場合は「ta-agent-to-gateway-config.yaml」を使うことになることに注意が必要です。
重要なコンフィグなので、ta-agent-config.yamlの中身も見てみましょう。
こちらに、先述したReceivers、Processors、Exporters、Connectors、Extensionsについての設定が書かれています。
ta-agent-config.yamlの中身は以下です。
# Default configuration file for the Linux (deb/rpm) and Windows MSI collector packages

# If the collector is installed without the Linux/Windows installer script, the following
# environment variables are required to be manually defined or configured below:
# - SPLUNK_ACCESS_TOKEN: The Splunk access token to authenticate requests
# - SPLUNK_API_URL: The Splunk API URL, e.g. https://api.us0.signalfx.com
# - SPLUNK_BUNDLE_DIR: The path to the Smart Agent bundle, e.g. /usr/lib/splunk-otel-collector/agent-bundle
# - SPLUNK_COLLECTD_DIR: The path to the collectd config directory for the Smart Agent, e.g. /usr/lib/splunk-otel-collector/agent-bundle/run/collectd
# - SPLUNK_INGEST_URL: The Splunk ingest URL, e.g. https://ingest.us0.signalfx.com
# - SPLUNK_LISTEN_INTERFACE: The network interface the agent receivers listen on.

extensions:
  headers_setter:
    headers:
      - action: upsert
        key: X-SF-TOKEN
        from_context: X-SF-TOKEN
        default_value: "${SPLUNK_ACCESS_TOKEN}"
  health_check:
    endpoint: "${env:SPLUNK_LISTEN_INTERFACE}:13133"
  http_forwarder:
    ingress:
      endpoint: "${env:SPLUNK_LISTEN_INTERFACE}:6060"
    egress:
      endpoint: "${env:SPLUNK_API_URL}"
      # Use instead when sending to gateway
  smartagent:
    bundleDir: "${env:SPLUNK_BUNDLE_DIR}"
    collectd:
      configDir: "${env:SPLUNK_COLLECTD_DIR}"
  zpages:
    #endpoint: "${env:SPLUNK_LISTEN_INTERFACE}:55679"
    expvar:
      enabled: true

receivers:
  fluentforward:
    endpoint: 127.0.0.1:8006
  hostmetrics:
    collection_interval: 10s
    scrapers:
      cpu:
      disk:
      filesystem:
      memory:
      network:
      # System load average metrics https://en.wikipedia.org/wiki/Load_(computing)
      load:
      # Paging/Swap space utilization and I/O metrics
      paging:
      # Aggregated system process count metrics
      processes:
      # System processes metrics, disabled by default
      # process:
  jaeger:
    protocols:
      grpc:
        endpoint: "${env:SPLUNK_LISTEN_INTERFACE}:14250"
      thrift_binary:
        endpoint: "${env:SPLUNK_LISTEN_INTERFACE}:6832"
      thrift_compact:
        endpoint: "${env:SPLUNK_LISTEN_INTERFACE}:6831"
      thrift_http:
        endpoint: "${env:SPLUNK_LISTEN_INTERFACE}:14268"
  otlp:
    protocols:
      grpc:
        endpoint: "${env:SPLUNK_LISTEN_INTERFACE}:4317"
        # Uncomment below config to preserve incoming access token and use it instead of the token value set in exporter config
        # include_metadata: true
      http:
        endpoint: "${env:SPLUNK_LISTEN_INTERFACE}:4318"
        # Uncomment below config to preserve incoming access token and use it instead of the token value set in exporter config
        # include_metadata: true
  # This section is used to collect the OpenTelemetry Collector metrics
  # Even if just a Splunk APM customer, these metrics are included
  prometheus/internal:
    config:
      scrape_configs:
      - job_name: 'otel-collector'
        scrape_interval: 10s
        static_configs:
        - targets: ["${env:SPLUNK_LISTEN_INTERFACE}:8888"]
        metric_relabel_configs:
          - source_labels: [ __name__ ]
            regex: '.*grpc_io.*'
            action: drop
  smartagent/processlist:
    type: processlist
  zipkin:
    endpoint: "${env:SPLUNK_LISTEN_INTERFACE}:9411"

processors:
  batch:
    metadata_keys:
      - X-SF-Token
  # Enabling the memory_limiter is strongly recommended for every pipeline.
  # Configuration is based on the amount of memory allocated to the collector.
  # For more information about memory limiter, see
  # https://github.com/open-telemetry/opentelemetry-collector/blob/main/processor/memorylimiter/README.md
  memory_limiter:
    check_interval: 2s
    limit_mib: ${env:SPLUNK_MEMORY_LIMIT_MIB}

  # Detect if the collector is running on a cloud system, which is important for creating unique cloud provider dimensions.
  # Detector order is important: the `system` detector goes last so it can't preclude cloud detectors from setting host/os info.
  # Resource detection processor is configured to override all host and cloud attributes because instrumentation
  # libraries can send wrong values from container environments.
  # https://docs.splunk.com/Observability/gdi/opentelemetry/components/resourcedetection-processor.html#ordering-considerations
  resourcedetection:
    detectors: [gcp, ecs, ec2, azure, system]
    override: true

  # Optional: The following processor can be used to add a default "deployment.environment" attribute to the logs and
  # traces when it's not populated by instrumentation libraries.
  # If enabled, make sure to enable this processor in a pipeline.
  # For more information, see https://docs.splunk.com/Observability/gdi/opentelemetry/components/resource-processor.html
  #resource/add_environment:
    #attributes:
      #- action: insert
        #value: staging/production/...
        #key: deployment.environment
        #
  # This helps splunk track usage and support of the TA
  resource/telemetry:
    attributes:
      - action: insert
        key: splunk.distribution
        value: otel-ta

exporters:
  # Traces
  otlp_http:
    traces_endpoint: "${SPLUNK_INGEST_URL}/v2/trace/otlp"
    headers:
      "X-SF-Token": "${SPLUNK_ACCESS_TOKEN}"
    auth:
      authenticator: headers_setter
  # Metrics + Events
  signalfx:
    access_token: "${env:SPLUNK_ACCESS_TOKEN}"
    api_url: "${env:SPLUNK_API_URL}"
    ingest_url: "${env:SPLUNK_INGEST_URL}"
    sync_host_metadata: true
    correlation:
  # Debug
  debug:
    verbosity: detailed

service:
  telemetry:
    logs:
      level: error
      # output_paths: [ "${env:SPLUNK_HOME}/var/log/splunk/otel.log" ]
  extensions: [headers_setter, health_check, http_forwarder, zpages, smartagent]
  pipelines:
    traces:
      receivers: [jaeger, otlp, zipkin]
      processors:
      - memory_limiter
      - batch
      - resourcedetection
      #- resource/add_environment
      exporters: [otlp_http, signalfx]
    metrics:
      receivers: [hostmetrics, otlp]
      processors: [memory_limiter, batch, resourcedetection]
      exporters: [signalfx]
    logs/signalfx:
      receivers: [smartagent/processlist]
      processors: [memory_limiter, batch, resourcedetection]
      exporters: [signalfx]
    metrics/telemetry:
      receivers: [prometheus/internal]
      processors: [memory_limiter, batch, resourcedetection, resource/telemetry]
      exporters: [signalfx]
本記事では細かい説明は省きますが、上記のコンフィグを見れば、{SPLUNK_ACCESS_TOKEN} には、local/access_tokenで指定した値が入り、{env:SPLUNK_LISTEN_INTERFACE} にはloca/inputs.confで指定した環境変数が入るという仕組みであることがわかります。
またコンフィグの一番下のService定義で、それぞれのpipelineでどのReceivers、Processors、Exportersを使うのかなどが定義されていることもわかります。
まとめ
というわけで、Splunk Add-On for OpenTelemetry Collectorについて概要と、Add-onの実体を見ながらなんとなく気をつけるべきことを書いてみました。
参考になれば幸いです。
参考資料
Splunk Add-On for OpenTelemetry Collector
https://splunkbase.splunk.com/app/7125
splunk-otel-collector(このgithubは、Splunk Distribution of the OpenTelemetry CollectorのDistributionであり、OTel Add-onに入っているOpenTelemetry Collectorとは別物であることには注意)
https://github.com/signalfx/splunk-otel-collector
Universal ForwarderとOpenTelemetry Collectorの統合:Splunk Add-On for OpenTelemetry Collector
https://www.splunk.com/ja_jp/blog/devops/universal-forwarder-and-opentelemetry-collector-integration-splunk-add-on-for-opentelemetry-collector.html
OpenTelemetry Collector用SplunkアドオンをUniversal Forwarderインスタンスにインストールする
https://help.splunk.com/ja-jp/splunk-observability-cloud/manage-data/splunk-distribution-of-the-opentelemetry-collector/splunk-distribution-of-the-opentelemetry-collector-%E3%81%AE%E5%88%A9%E7%94%A8%E9%96%8B%E5%A7%8B/opentelemetry-collector%E7%94%A8splunk%E3%82%A2%E3%83%89%E3%82%AA%E3%83%B3/%E3%83%86%E3%82%AF%E3%83%8B%E3%82%AB%E3%83%AB%E3%82%A2%E3%83%89%E3%82%AA%E3%83%B3%E3%82%92%E3%82%A4%E3%83%B3%E3%82%B9%E3%83%88%E3%83%BC%E3%83%AB%E3%81%99%E3%82%8B
Splunk Distribution of the OpenTelemetry Collector の利用開始
https://help.splunk.com/ja-jp/splunk-observability-cloud/manage-data/splunk-distribution-of-the-opentelemetry-collector/splunk-distribution-of-the-opentelemetry-collector-%E3%81%AE%E5%88%A9%E7%94%A8%E9%96%8B%E5%A7%8B