はじめに
この記事ではベイジアンABテストを2つの方法で実装しています。
- Beta分布を共役事前分布に採用する方法 (Adopt Beta distribution as the conjugate prior distribution)
- Bernoulli分布のパラメータをベイズ推定する方法 (Bayesian estimation of parameters of Bernoulli distribution)
Check versions of libraries
import numpy
import scipy
import pymc3


library_dict = {0: 'numpy', 1: 'scipy', 2: 'pymc3'}
for num, library in enumerate([numpy, scipy, pymc3]):
    print('{}: v{}'.format(library_dict[num], library.__version__))

>>
numpy: v1.18.5
scipy: v1.4.1
pymc3: v3.11.2
Load libraries
import numpy as np
from scipy.stats import beta, norm, bernoulli
import pymc3 as pm
import json
import sys
import logging
logger = logging.getLogger()
handler = logging.StreamHandler(sys.stdout)
handler.setLevel(logging.INFO)
logger.addHandler(handler)
logger.setLevel(logging.INFO)
from matplotlib import pyplot as plt
%matplotlib inline
from decimal import Decimal, ROUND_HALF_UP
Adopt Beta distribution as the conjugate prior distribution
class BayesianABN(object):

    def __init__(self, n_comparisons: int, params: list = None, n_samples: int = 50000) -> None:
        """
        n_comparisons: If u wanna compare two creatives, n_comparisons is 2.
        params: If u wanna compare two creatives, params is [[num of conversions, num of impressions], [num of conversions, num of impressions]].
        n_samples: Number of samples to generate from conjugate prior distribution.
        """
        if params is None:
            self.params = list()
            for _ in range(n_comparisons):
                self.params.append([1, 1])
        elif params is not None:
            self.params = params

        if n_comparisons != len(self.params):
            raise Exception("The value  of n_comparisons does not match the number of elements in params.")
        if n_comparisons * 2 != sum([len(list_) for list_ in self.params]):
            raise Exception("The value of n_comparisons does not match the number of elements contained in each element of params.")

        self.n_comparisons = n_comparisons
        self.data = [[0, 0] for _ in range(n_comparisons)]
        self.n_samples = n_samples
        self.sampling()

        logger.info(json.dumps({'Number of comparisons': self.n_comparisons, 'Number of beta samples': self.n_samples}))

    def sampling(self) -> None:
        self.posterior_distribution_list = [beta(*p).rvs(self.n_samples) for p in self.params]

    def update(self, additional_data) -> None:
        if self.n_comparisons * 2 != sum([len(list_) for list_ in additional_data]):
            raise Exception("The value of n_comparisons does not match the number of elements contained in each element of additional_data.")

        for num, data in enumerate(additional_data):
            cov = data[0]
            imp = data[1]

            self.data[num][0] += cov
            self.data[num][1] += imp

            self.params[num][0] += cov
            self.params[num][1] += imp - cov

        self.sampling()

    def significant_diff(self, target1: int, target2: int) -> float:
        self.diff = np.round((self.posterior_distribution_list[target1] <= self.posterior_distribution_list[target2]).mean(), 1)

        if self.diff < 0.5:
            return 1.0 - self.diff

        return self.diff

    def mean_var(self) -> dict:
        mean_var_dict = {chr(num + 65): {'mean': np.round(self.posterior_distribution_list[num].mean(), 2), 'var': Decimal(self.posterior_distribution_list[num].var()).quantize(Decimal('.000000'), rounding = ROUND_HALF_UP)} for num in range(self.n_comparisons)}

        return mean_var_dict

    def current_sample(self) -> dict:
        current_sample_dict = dict()
        for num in range(self.n_comparisons):
            current_sample_dict[chr(num + 65)] = dict()
            current_sample_dict[chr(num + 65)]['cv'] = self.data[num][0]
            current_sample_dict[chr(num + 65)]['imp'] = self.data[num][1]
        return current_sample_dict

    def distribution_drawing(self, title: str = '', save: bool = False, labels: str = None) -> None:
        plt.figure(figsize = (10, 5))
        plt.title(title)
        cmap = plt.get_cmap('jet')
        color_list = list()

        for num, posterior in enumerate(self.posterior_distribution_list):
            color = cmap(0.15 * (num + 1))
            color_list.append(color)
            plt.hist(posterior, bins = 100, histtype = 'stepfilled', density = True, color = color, alpha = 0.5)
        handles = [plt.Rectangle((0, 0), 1, 1, color = c, ec = 'k', alpha = 0.5) for c in color_list]

        if labels is None:
            labels = [chr(num + 65) for num in range(self.n_comparisons)]

        plt.legend(handles, labels)
        if save:
            plt.saving('{}.png'.format(title))
        plt.show()

    def delta_posterior_distribution_drawing(self, hdi_prob: float, target1: int, target2: int, title: str = None, save: bool = False) -> None:
        self.hdi_prob = hdi_prob
        self.pos_dis_1 = self.posterior_distribution_list[target1]
        self.pos_dis_2 = self.posterior_distribution_list[target2]

        self.delta_posterior_distribution = self.pos_dis_1 - self.pos_dis_2

        self.hdi = norm.interval(alpha = self.hdi_prob, loc = self.delta_posterior_distribution.mean(), scale = self.delta_posterior_distribution.std())

        plt.figure(figsize = (10, 5))
        if title is None:
            title = 'Difference in the posterior distributions of the parameters of {0} and {1} / {0} - {1} / {2}% HDI'.format(chr(target1 + 65), chr(target2 + 65), int(self.hdi_prob * 100))
        plt.title(title)
        cmap = plt.get_cmap('jet')
        color_list = list()

        color = cmap(0.15 * (0 + 1))
        color_list.append(color)
        plt.hist(self.delta_posterior_distribution, bins = 100, histtype = 'stepfilled', density = True, color = color, alpha = 0.5, label = 'delta')
        self.mean = self.delta_posterior_distribution.mean()
        plt.vlines(self.mean, 0, 10, linestyle = '-', label = 'mean: {}'.format(np.round(self.mean, 3)))
        if int(str(hdi_prob)[3]) == 0:
            plt.vlines(self.hdi[0], 0, 10, linestyle = '--', label = 'hdi_{}%: {}'.format(np.round((1.0 - self.hdi_prob) / 2.0, 2) * 100, np.round(self.hdi[0], 3)))
            plt.vlines(self.hdi[1], 0, 10, linestyle = '--', label = 'hdi_{}%: {}'.format(np.round(1.0 - (1.0 - self.hdi_prob) / 2.0, 2) * 100, np.round(self.hdi[1], 3)))
        elif int(str(hdi_prob)[3]) != 0:
            plt.vlines(self.hdi[0], 0, 10, linestyle = '--', label = 'hdi_{}%: {}'.format(np.round((1.0 - self.hdi_prob) / 2.0, 3) * 100, np.round(self.hdi[0], 3)))
            plt.vlines(self.hdi[1], 0, 10, linestyle = '--', label = 'hdi_{}%: {}'.format(np.round(1.0 - (1.0 - self.hdi_prob) / 2.0, 3) * 100, np.round(self.hdi[1], 3)))
        handles = [plt.Rectangle((0, 0), 1, 1, color = c, ec = 'k', alpha = 0.5) for c in color_list]

        plt.legend()
        if save:
            plt.saving('{}.png'.format(title))
        plt.show()
BayesianABN_instance = BayesianABN(3)

>> {"Number of comparisons": 3, "Number of beta samples": 50000}

BayesianABN_instance.update([[2, 204], [3, 200], [50, 300]])

BayesianABN_instance.significant_diff(0, 1)

>> 0.7

BayesianABN_instance.current_sample()

>>
{'A': {'cv': 2, 'imp': 204},
 'B': {'cv': 3, 'imp': 200},
 'C': {'cv': 50, 'imp': 300}}

BayesianABN_instance.mean_var()

>>

{'A': {'mean': 0.01, 'var': Decimal('0.000070')},
 'B': {'mean': 0.02, 'var': Decimal('0.000094')},
 'C': {'mean': 0.17, 'var': Decimal('0.000461')}}
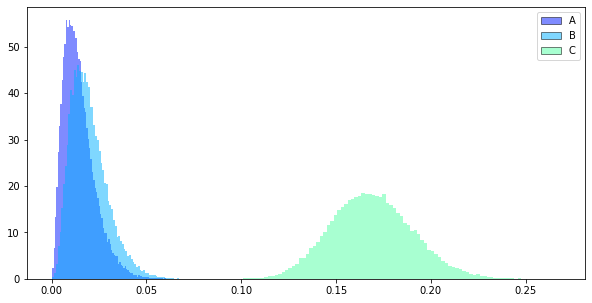
BayesianABN_instance.distribution_drawing()
Bayesian estimation of parameters of Bernoulli distribution
class BayesianAB(object):
def __init__(self, sample_dict: dict):
"""
sample_dict: If u wanna compare two creatives, sample_dict = {'A': creative_a, 'B': creative_b}. The values in the dict contain a sampling of cv = 1/ not cv = 0 for each creative.
"""
self.sample_dict = sample_dict
if len(self.sample_dict) != 2:
raise Exception("The number of elements in sample_dict must be two.")
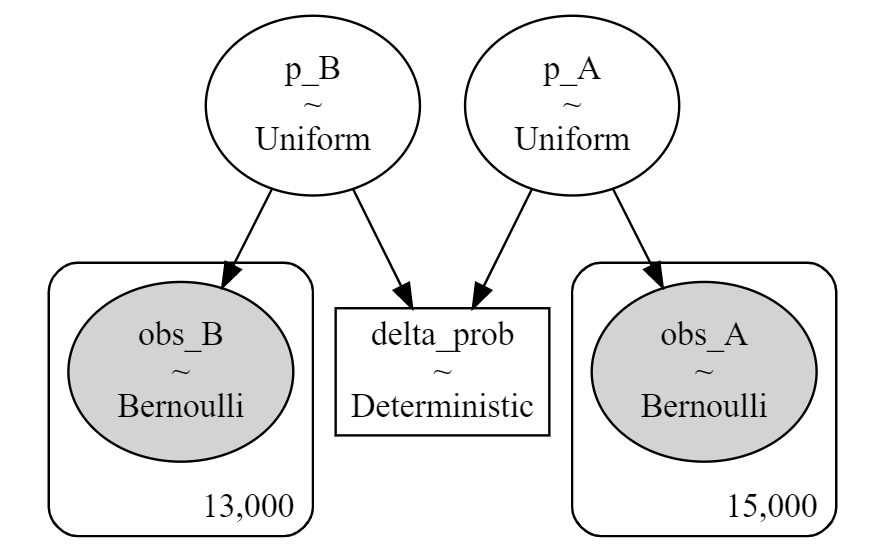
def modeling(self) -> None:
with pm.Model() as self.model:
self.p_A = pm.Uniform('p_A', 0, 1.0)
self.p_B = pm.Uniform('p_B', 0, 1.0)
self.obs_A = pm.Bernoulli('obs_A', self.p_A, observed = self.sample_dict['A'])
self.obs_B = pm.Bernoulli('obs_B', self.p_B, observed = self.sample_dict['B'])
self.delta_prob = pm.Deterministic('delta_prob', self.p_B - self.p_A)
def estimate(self) -> None:
with self.model:
self.start = pm.find_MAP()
self.step = pm.Slice()
self.trace = pm.sample(20000, step = self.step, start = self.start, return_inferencedata = False)
self.burned_trace = self.trace[1000:]
def model_to_graphviz(self) -> None:
return pm.model_to_graphviz(self.model)
def tracing(self) -> None:
with self.model:
pm.plot_trace(self.trace)
def posterior_distribution_drawing(self, hdi_prob) -> None:
with self.model:
pm.plot_posterior(self.burned_trace, hdi_prob = hdi_prob)
def summary(self, hdi_prob: float):
with self.model:
self.summary_ = pm.summary(self.burned_trace, hdi_prob = hdi_prob)
return self.summary_
def significant_diff(self) -> float:
self.diff = np.round((self.burned_trace['p_A'] <= self.burned_trace['p_B']).mean(), 1)
if self.diff < 0.5:
return 1.0 - self.diff
return self.diff
def delta_posterior_distribution_drawing(self, hdi_prob: float, title: str = None, save: bool = False) -> None:
self.hdi_prob = hdi_prob
try:
self.summary_
except:
with self.model:
self.summary_ = pm.summary(self.burned_trace, hdi_prob = self.hdi_prob)
delta_prob = self.burned_trace['delta_prob']
plt.figure(figsize = (10, 5))
if title is None:
title = 'Posterior distribution of delta'
plt.title(title)
cmap = plt.get_cmap('jet')
color_list = list()
color = cmap(0.15 * (0 + 1))
color_list.append(color)
plt.vlines(self.summary_.iloc[2]['mean'], 0, 50, linestyle = '-', label = 'mean: {}'.format(self.summary_.iloc[2]['mean']))
if int(str(hdi_prob)[3]) == 0:
self.hdi_lower = self.summary_.iloc[2]['hdi_{}%'.format(np.round((1.0 - self.hdi_prob) / 2.0, 2) * 100)]
self.hdi_upper = self.summary_.iloc[2]['hdi_{}%'.format(np.round(1.0 - (1.0 - self.hdi_prob) / 2.0, 2) * 100)]
plt.vlines(self.hdi_lower, 0, 50, linestyle = '--', label = 'hdi_{}%: {}'.format(np.round((1.0 - self.hdi_prob) / 2.0, 2) * 100, self.hdi_lower))
plt.vlines(self.hdi_upper, 0, 50, linestyle = '--', label = 'hdi_{}%: {}'.format(np.round(1.0 - (1.0 - self.hdi_prob) / 2.0, 2) * 100, self.hdi_upper))
elif int(str(hdi_prob)[3]) != 0:
self.hdi_lower = self.summary_.iloc[2]['hdi_{}%'.format(np.round((1.0 - self.hdi_prob) / 2.0, 3) * 100)]
self.hdi_upper = self.summary_.iloc[2]['hdi_{}%'.format(np.round(1.0 - (1.0 - self.hdi_prob) / 2.0, 3) * 100)]
plt.vlines(self.hdi_lower, 0, 50, linestyle = '--', label = 'hdi_{}%: {}'.format(np.round((1.0 - self.hdi_prob) / 2.0, 3) * 100, self.hdi_lower))
plt.vlines(self.hdi_upper, 0, 50, linestyle = '--', label = 'hdi_{}%: {}'.format(np.round(1.0 - (1.0 - self.hdi_prob) / 2.0, 3) * 100, self.hdi_upper))
plt.hist(delta_prob, bins = 100, histtype = 'stepfilled', density = True, color = color, alpha = 0.5)
handles = [plt.Rectangle((0, 0), 1, 1, color = c, ec = 'k', alpha = 0.5) for c in color_list]
plt.legend()
if save:
plt.saving('{}.png'.format(title))
plt.show()
Adopt Beta distribution as the conjugate prior distribution VS Bayesian estimation of parameters of Bernoulli distribution
Create Dummy Data
creative_a = bernoulli.rvs(p = 0.15, size = 15000)
creative_b = bernoulli.rvs(p = 0.17, size = 13000)
Comparison
Adopt Beta distribution as the conjugate prior distribution
BayesianABN_instance = BayesianABN(2)

>> {"Number of comparisons": 2, "Number of beta samples": 50000}

BayesianABN_instance.update([[sum(creative_a), len(creative_a)], [sum(creative_b), len(creative_b)]])
BayesianABN_instance.significant_diff(0, 1)

>> 1.0

BayesianABN_instance.current_sample()

>> {'A': {'cv': 2258, 'imp': 15000}, 'B': {'cv': 2244, 'imp': 13000}}
BayesianABN_instance.distribution_drawing()

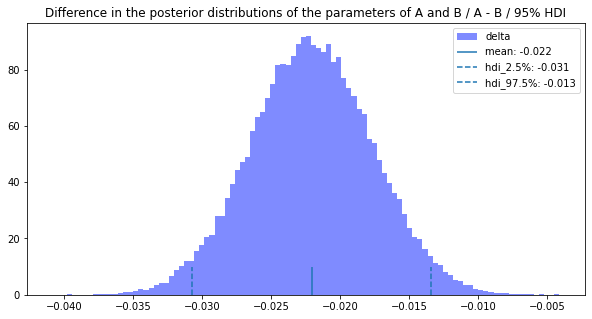
BayesianABN_instance.delta_posterior_distribution_drawing(0.95, 0, 1)
Bayesian estimation of parameters of Bernoulli distribution
instance = BayesianAB({'A': creative_a, 'B': creative_b})
instance.modeling()
instance.model

>>
p_A_interval__ ~ TransformedDistribution
p_B_interval__ ~ TransformedDistribution
           p_A ~ Uniform
           p_B ~ Uniform
    delta_prob ~ Deterministic
         obs_A ~ Bernoulli
         obs_B ~ Bernoulli
instance.model_to_graphviz()
instance.estimate()

>>
 100.00% [7/7 00:00<00:00 logp = -19,408, ||grad|| = 6,752.2]

Multiprocess sampling (4 chains in 4 jobs)
CompoundStep
>Slice: [p_B]
>Slice: [p_A]

 100.00% [84000/84000 01:15<00:00 Sampling 4 chains, 0 divergences]
Sampling 4 chains for 1_000 tune and 20_000 draw iterations (4_000 + 80_000 draws total) took 120 seconds.
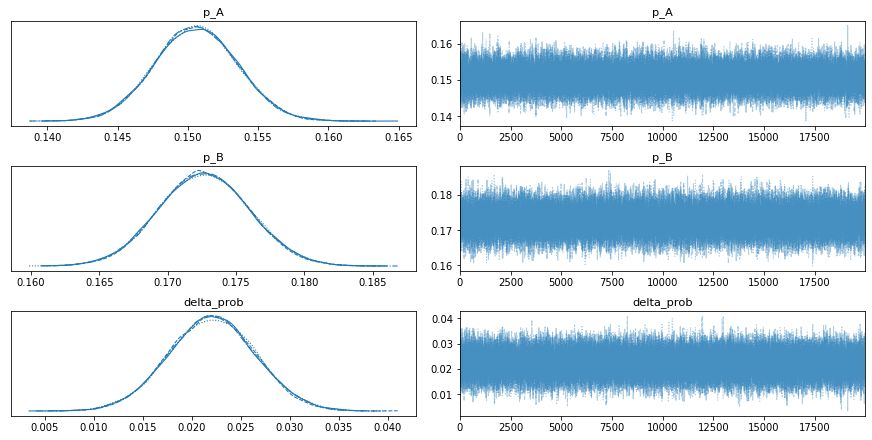
instance.tracing()
posterior_distributions = instance.posterior_distribution_drawing(hdi_prob = 0.95)

summary = instance.summary(hdi_prob = 0.95)
summary

>>
           mean   sd   hdi_2.5%   hdi_97.5%   mcse_mean   mcse_sd   ess_bulk   ess_tail   r_hat
p_A        0.151 0.003   0.145      0.156        0.0        0.0      76771.0   58106.0     1.0
p_B        0.173 0.003   0.166      0.179        0.0        0.0      73469.0   56450.0     1.0
delta_prob 0.022 0.004   0.013      0.031        0.0        0.0      75624.0   66133.0     1.0
instance.significant_diff()

>> 1.0

(instance.burned_trace['p_B'] - instance.burned_trace['p_A'] > 0).mean()

>> 1.0
instance.delta_posterior_distribution_drawing(hdi_prob = 0.95, title = 'Posterior distribution of delta / 95% HDI')

Result
The same average, HID2.5%, and HDI 97.5% were calculated for the two methods compared.
Since the difference of the estimated parameters is 1.0 and the difference of the average is 0.022, we can say that the probability that B is more likely to convert is close to 100% and the conversion rate could have been increased by 2.2%.
まとめ
ベイジアンABテストを2つの方法で実装し結果を比較してみました。
認識や実装の間違いなどありましたらご指摘のほどよろしくお願いいたします。