概要
この前は さくらのクラウドのオートスケールをやんわり試す で
やんわり試したので今度はPrometheusのアラートをトリガーに
インスタンスを垂直オートスケールさせてみる。
前提
- インスタンスは3つ
-
sacloud/autoscaler(coreとinputs)を動かすインスタンス
1Core1GBの一番小さいインスタンスで作っておく。 -
PrometheusのServerとAlertManagerを動かすインスタンス
1Core1GBの一番小さいインスタンスで作っておく。 -
垂直オートスケールさせるインスタンス
名前は target01 にしておく。
1Core1GBの一番小さいインスタンスで作っておく。
-
- みんな同じローカルネットワークにいる
- さくらのクラウドのAPIキーはget済み
- 各インスタンスでDockerが使えるようになっている
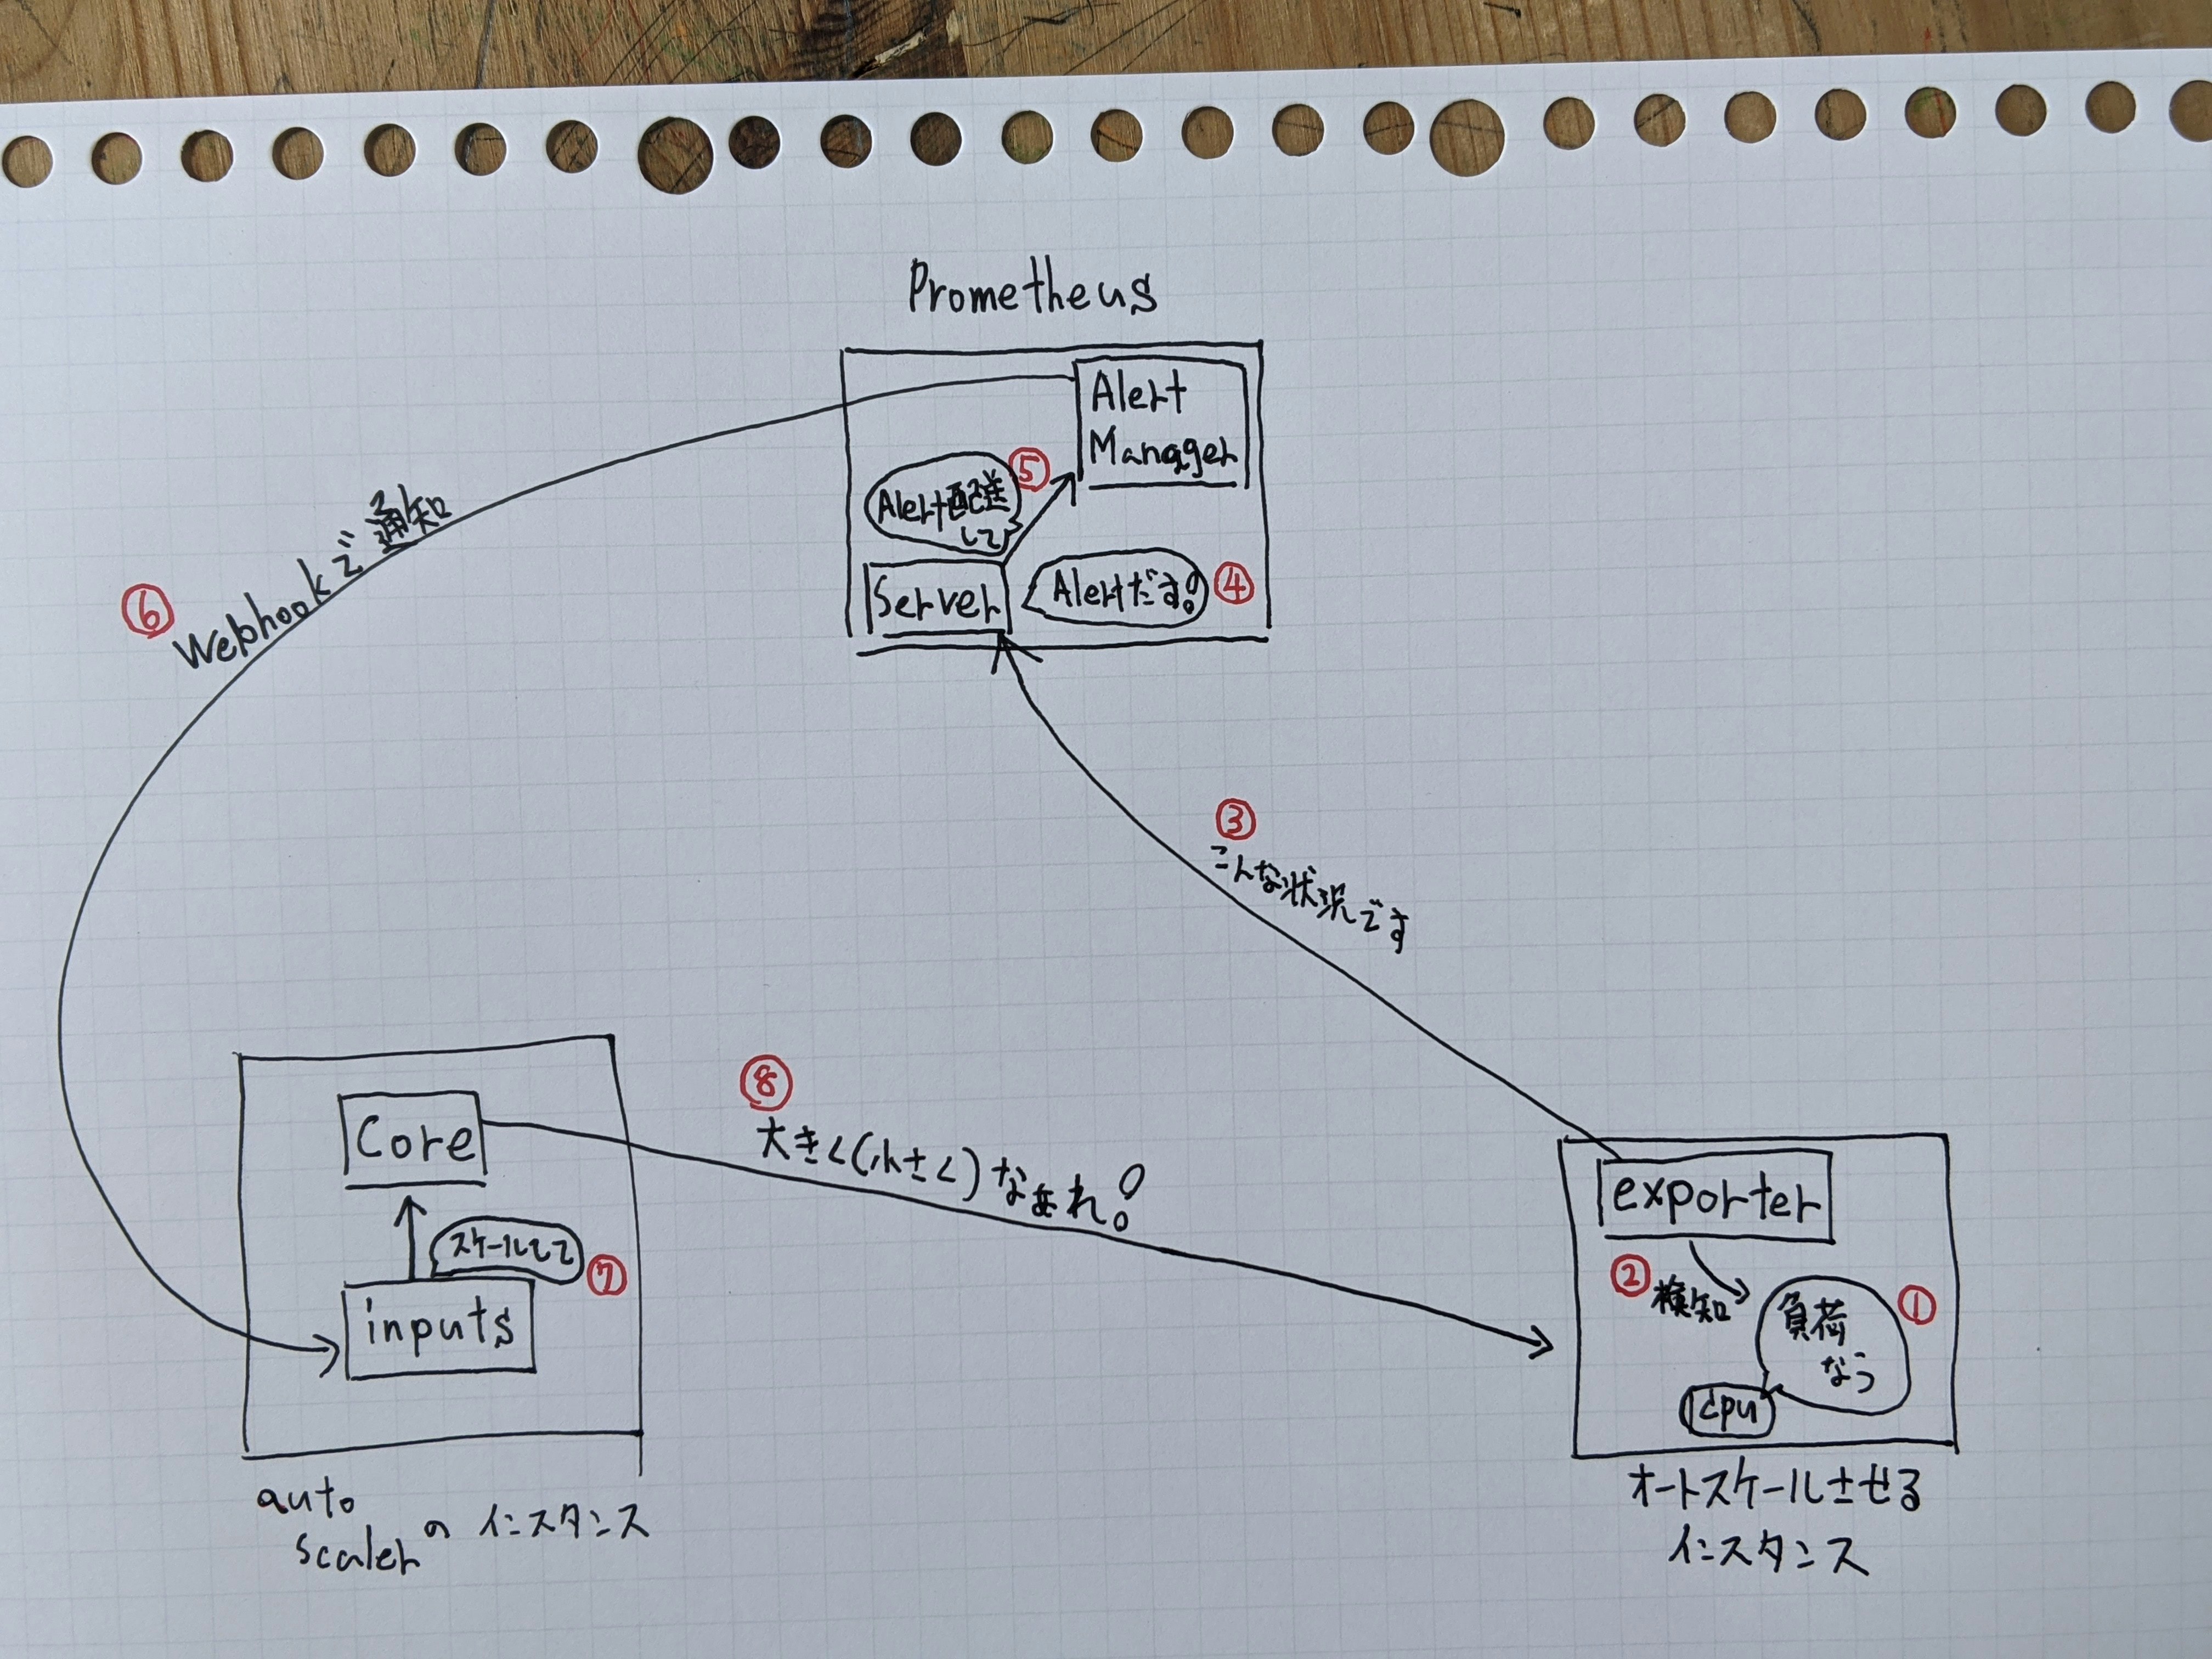
全体的なイメージ
たぶんこんな感じ。
prometheusのnode_exporterを垂直オートスケールさせたいインスタンスで動かす
1行で動かせる便利。
sudo docker container run --restart always --name node_exporter -p 9100:9100 prom/node-exporter
--restart always が無いとオートスケールが走って再起動した後にコンテナが止まって、
PrometheusのServerでインスタンスの情報が取得できなくなっちゃう。
sacloud/autoscaler を動かす準備をする。
sacloud/autoscaler のconfigを書く
sacloud/autoscalerを動かすインスタンス上で書こう。ファイル名は autoscaler.yaml にしとく。
is1bゾーンにいるtarget01ってインスタンスをplansに記載したパターンのどれかに
スケールアウトしたりインしたりするような内容です。
# 操作対象のリソースの定義
resources:
  tmkgrp:
    resources:
      # サーバ(垂直スケール)
      - type: Server
        selector:
          names: ["target01"]
          zone: "is1b"
        plans:
        - core: 1
          memory: 1
        - core: 2
          memory: 4
        - core: 4
          memory: 8
        option:
          shutdown_force: true

autoscaler:
  cooldown: 50 # デフォルト: 6000(10分)

sakuracloud:
  token: "himitsu"
  secret : "superhimitsu"
sacloud/autoscaler を動かす。
前項で作成したyamlと同じディレクトリで以下の2つのコマンドを実行して、
CoreとInputsのコンテナを動かす。
sudo docker run -d --rm --name autoscaler -w /work -v ${PWD}/:/work ghcr.io/sacloud/autoscaler:v0.0.1 server start
sudo docker run -d --name alertmanager --rm -p 8080:8080 -w /work -v ${PWD}/:/work ghcr.io/sacloud/autoscaler:v0.0.1 inputs alertmanager
Prometheusを動かす準備をする
Prometheusを動かすインスタンスで作業する。
homeディレクトリにディレクトリを作る
まずは以下の名前のディレクトリを作ってパーミッションを変える。
- alertmanager_data
- prometheus_data
- 作ったディレクトリのパーミッションを777にする
デフォルトの権限だとコンテナにマウントした時に permission denied になる。
PrometheusのDockerfileを見るとnobody ってユーザで動いているみたいなので、
777にしなくてもnobodyってユーザがアクセスできるようにすれば大丈夫。
でも、今回は何も考えてないので777にする。
次に、以下の名前のディレクトリを作る。パーミッションは変えなくていい。
- prometheus_config
Prometheusのconfigを書く
server のconfigを書く
作ったprometheus_configディレクトリにprometheus.ymlって名前で書く。
# my global config
global:
  scrape_interval: 15s # Set the scrape interval to every 15 seconds. Default is every 1 minute.
  evaluation_interval: 15s # Evaluate rules every 15 seconds. The default is every 1 minute.
  # scrape_timeout is set to the global default (10s).

# Alertmanager configuration
alerting:
  alertmanagers:
    - static_configs:
        - targets:
          - 192.168.1.20:9093  # alertmanagetが動くインスタンスのIPとポート番号

# Load rules once and periodically evaluate them according to the global 'evaluation_interval'.
rule_files:
  - "/etc/prometheus/first_rules.yml"  # 後の工程で作るyaml。どういった条件でアラートを上げるかを書く。
  # - "second_rules.yml"

# A scrape configuration containing exactly one endpoint to scrape:
# Here it's Prometheus itself.
scrape_configs:
  # The job name is added as a label `job=<job_name>` to any timeseries scraped from this config.
  - job_name: "prometheus"

    # metrics_path defaults to '/metrics'
    # scheme defaults to 'http'.

    static_configs:
      - targets: ["192.168.1.21:9100"]  # node_exporterが動くインスタンスのIPとポート番号
どういったものをalertにするかをyamlに記述する
作ったprometheus_configディレクトリにfirst_rules.ymlって名前で書く。
今回は1分以内のロードアベレージが2より大きいか、0.5より小さい時にalertを出す。
groups:
  - name: cpuAve  # 名前何でもいい。
    rules:
    - alert: loadAverageMoreThan2  # 名前なんでもいい。
      expr: node_load1 > 2  # alertを上げる条件。node_loadの部分は他にも色々ある。
      # for: <期間>
      labels:
        CPU: plzup
      annotations:
        MyBigFat: "Annotation"
    - alert: loadAverageLessThan0.5  # 名前なんでもいい。
      expr: node_load1 < 0.5
      # for: <期間>
      labels:
        CPU: plzdown
      annotations:
        MyBigFat: "Annotation"
alertmanager のconfigを書く
作ったprometheus_configディレクトリにalertmanager.ymlって名前で書く。
いくつかの値は前項で作ったfirst_rules.ymlと揃える必要がある。
route:
  receiver: ordinaly  # routesに定義されていないalertが来た場合に実行するreceiver。
  routes:
    - match:  # CPUってラベルの値がplzupだったらupupupって名前のreceiversのアクションをする
        CPU: plzup
      receiver: upupup
    - match:  # CPUってラベルの値がplzdownだったらdowndowndownって名前のreceiversのアクションをする
        CPU: plzdown
      receiver: downdowndown
receivers:
- name: ordinaly
  #webhook_configs:
  #        - url: "http://127.0.0.1:5001"
- name: upupup
  webhook_configs:
    - url: "http://192.168.1.10:8080/up?resource-group-name=tmkgrp"
- name: downdowndown
  webhook_configs:
    - url: "http://192.168.1.10:8080/down?resource-group-name=tmkgrp"
Prometheusを動かす!
以下の2つのコマンドを実行する。
sudo docker run -d --rm --name prometheus -p 9090:9090 -v /home/ubuntu/prometheus_data/:/prometheus -v /home/ubuntu/prometheus_config/prometheus.yml:/etc/prometheus/prometheus.yml -v /home/ubuntu/prometheus_config/first_rules.yml:/etc/prometheus/first_rules.yml prom/prometheus
sudo docker run -d --rm --name alertmanager -p 9093:9093 -v /home/ubuntu/prometheus_config/alertmanager.yml:/etc/alertmanager/alertmanager.yml -v /home/ubuntu/alertmanager_data:/alertmanager prom/alertmanager
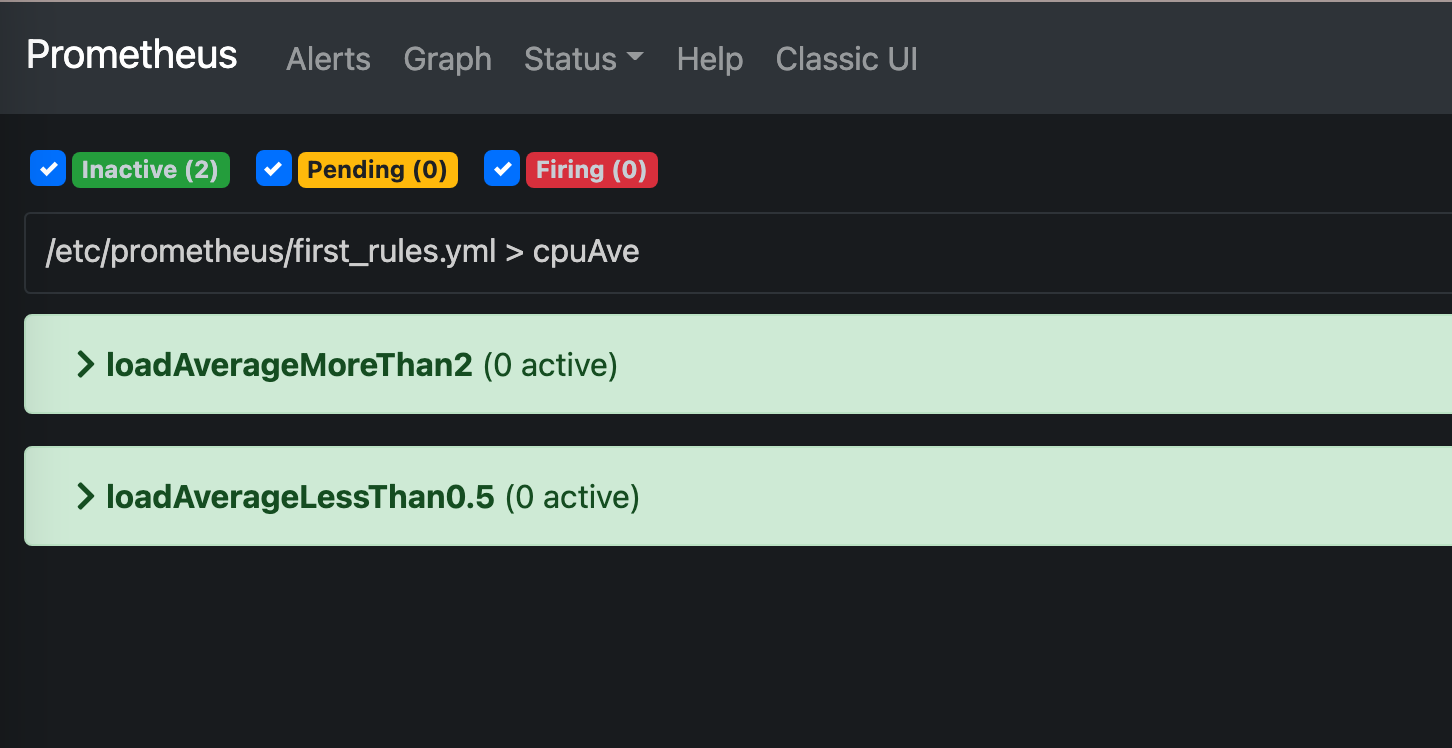
prometheusのwebUIを見てみる。
prometheusを動かしているインスタンスの9090ポートにブラウザでアクセスしてみる。
e.g. http://192.168.1.20:9090/alerts
以下みたいに設定した名前でalertが表示されてたらOKOK。
autoscaleする!
- さくらのクラウドのコントロールパネルからサーバ一覧を開いておく。
- オートスケールしたいサーバにsshでログインして以下のコマンドでCPUに負荷をかける
yes > /dev/null &
yes > /dev/null &
ほどなくすると、ロートアベレージが2を超えるのでオートスケールが実行されてインスタンスのサイズが上がるはず。
コントロールパネルのサーバ一覧でオートスケールの様子を見てると楽しい。
おわり。