ゴール
Ruby-Graphviz でサブグラフ を描きたい
まずは、dot 言語で書いてみる
Graphviz 解説記事を参考にして
digraph node_sample {
...
  subgraph cluster_1 {
    label = "clu1";
    labelloc = "t";
    labeljust = "l";
    fillcolor = "#888888";

    nu [label = "nu", shape = "trapezium"];
    xi [label = "xi", shape = "trapezium"];

    nu -> xi;

    subgraph cluster_2 {
      label = "clu2";
      labelloc = "t";
      labeljust = "l";
      fillcolor = "#888888";

      nu2 [label = "nu2", shape = "trapezium"];
      xi2 [label = "xi2", shape = "trapezium"];

      nu2 -> xi2;

     subgraph cluster_3 {
        label = "clu3";
        labelloc = "t";
        labeljust = "l";
        fillcolor = "#888888";

        nu3 [label = "nu3", shape = "trapezium"];
        xi3 [label = "xi3", shape = "trapezium"];

        nu3 -> xi3;
      }
    }

    nu -> nu2
  }
}
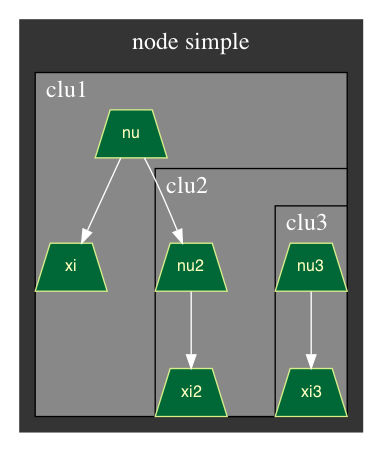
dot -T png sample.dot -o sample.png して open sample.png すると
次に、Gem で書いてみる
require 'ruby-graphviz'

# Create a new graph
g = GraphViz::new(:G, type: :digraph, use: :dot, rotate: 0, rankdir: :LR)

# setting sub-graph
g.add_graph('cluster_1', label: "clu1", labelloc: "t", labeljust: "l", fillcolor: "#888888")
sub1 = g.get_graph('cluster_1')
hello1 = sub1.add_nodes( "Hello1" )
world1 = sub1.add_nodes( "World1" )
sub1.add_edges( hello1, world1 )

sub1.add_graph('cluster_2', label: "clu2", labelloc: "t", labeljust: "l", fillcolor: "#888888")
sub2 = sub1.get_graph('cluster_2')
hello2 = sub2.add_nodes( "Hello2" )
world2 = sub2.add_nodes( "World2" )
sub2.add_edges( hello2, world2 )

sub1.add_edges( hello1, world2 )

# Generate output image
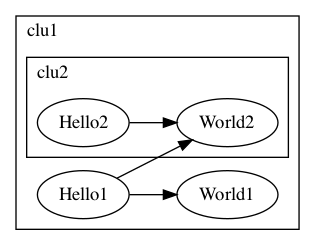
g.output( :png => "./tmp/hello_world.png" )
ポイントとしては、add_graph を使う際、第一引数として渡すグラフ名を cluster から始まる文字列にすること(そうしないとサブグラフとして機能しない)

