この記事は自分用のメモみたいなものです.
ほぼ DeepL 翻訳でお送りします.
間違いがあれば指摘していだだけると嬉しいです.
翻訳元
Selective Classification for Deep Neural Networks
Author: Yonatan Geifman, Ran El-Yaniv
前: 【3 Selection with Guaranteed Risk Control】
次: 【5 Empirical Results】
4 Confidence-Rate Functions for Neural Networks
訳文
未知の分布 $P$ に対して学習されると仮定した分類器 $f$ を考える.本節では, これまでの研究 [9, 2] に基づいて, 2 つの信頼度関数 $\kappa_f$ を検討する. $f$ の理想的な信頼度関数 $\kappa_f(x)$ は, 真の損失の単調性を反映している必要があることに注意しなければならない. $(x_1, y_1) \sim P$ と $(x_2, y_2) \sim P$ があるとすると, 次のようになる: $\kappa_f(x_1) \leq \kappa_f(x_2)$ は $\ell(f(x_1), y_1) \geq \ell(f(x_2), y_2)$ の場合にのみ成立する. 明らかに, 理想的な $\kappa_f$ は期待できない. 信頼度関数 $\kappa_f$ が与えられると, その有効性を分析するのに有用な方法は, (3) で定義されているように, その誘導リジェクト関数 $g_θ(x| \kappa_f)$ のリスクカバレッジ曲線を描くことである. このリスクカバー曲線は, $\theta$ と $R(f, g_\theta)$ の関係を示している. 例えば, 図 2(a) は, 2 つの (ほぼ同じ) リスクカバー率曲線をプロットしたものである. 我々が考える信頼度関数は理想的ではないが, 非常に効果的であることが経験的に示されている.
我々が考慮する最初の信頼度関数は, 何年も前から NN のフォークロアに存在し, [2, 4]ではリジェクトオプションの文脈で明示的に言及されています. この関数は次のように動作する: 最後の層が softmax である任意のニューラルネットワーク分類器 $f(x)$ が与えられると, $j$番目のクラスのソフト応答出力を $f(x|j)$ で表す. 信頼度関数は $\kappa \triangleq \max_{j \in {\cal Y}}(f(x|j))$ と定義される. この関数をソフトマックス応答 (SR) と呼ぶ.
ソフトマックス応答は確率として扱われることが多いが (応答は正であり, 合計は1になる), このアプローチを批判する著者もいる [9]. 我々の目的では, 理想的な信頼度関数は絶対的な確率値ではなく, 首尾一貫したランキングのみを提供すべきであることに注目し, ソフトマックス応答は相対的な信頼度の良い候補となる可能性がある.
SR の厳密な説明はよく知られていないが, ニューロンの活性化を観察することで直感的に動機付けられる. 例えば, 図 1 は, MNIST データセットのクラス '8' の真陽性と偽陽性について, 2 番目から最後の層にあるすべてのニューロンの平均応答値を示している (すべての MNIST クラスで定性的に類似した振る舞いが見られる). X 軸はその層のニューロンインデックス (1-128) に対応し, Y 軸は平均応答を示している. 緑の四角は真陽性の平均, 太字の四角は強い応答を強調し, 赤丸は偽陽性の平均応答に対応している. 活性ニューロンにおける真の陽性活性化応答は偽陽性よりもはるかに高いことが明らかになっており, これは最終的なソフトマックス層の応答に反映されると予想されている. さらに, 大きな活性化値は多くのニューロンに広がっており, この層のニューロンによって検出された多数のパターンによって信頼信号が発生していることを示している. 質的には, より深い層でも同様の挙動が観察される.
我々が考える MC-dropout 技法は, ニューラルネットワークの不確実性を定量化するために最近提案されたものである [9]. 与えられたインスタンス $x$ の不確実性を推定するために, $x$ に対してフィードフォワード反復を何回か実行する. 不確実性は, 最も確率の高いクラスに対応するニューロンの応答の分散とする. ここでは, マイナスの不確実性を MC-dropout 信頼度とみなす.
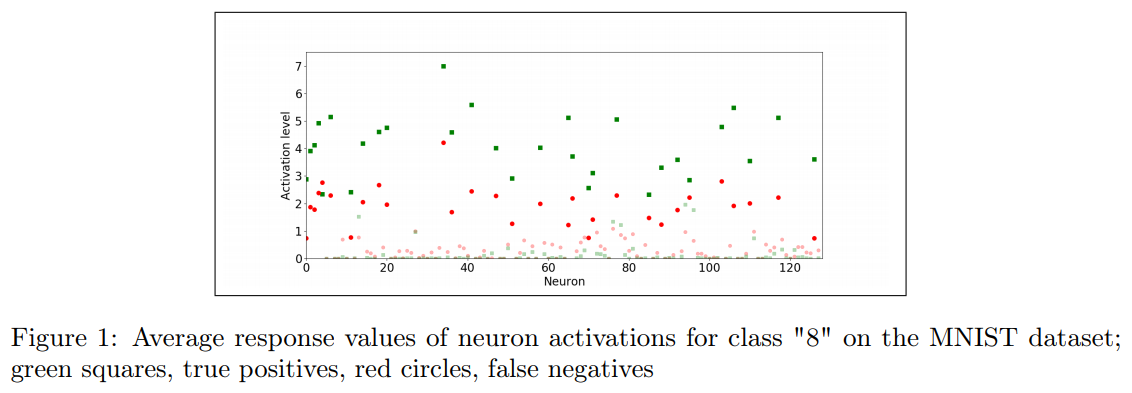
Figure 1: MNIST データセットのクラス "8" のニューロン活性化の平均応答値; 緑の四角, 真の陽性, 赤丸, 偽の陰性
原文
Consider a classifier $f$, assumed to be trained for some unknown distribution $P$. In this section we consider two confidence-rate functions, $\kappa_f$, based on previous work [9, 2]. We note that an ideal confidence-rate function $\kappa_f(x)$ for $f$, should reflect true loss monotonicity. Given $(x_1, y_1) \sim P$ and $(x_2, y_2) \sim P$, we would like the following to hold: $\kappa_f(x_1) \leq \kappa_f(x_2)$ if and only if $\ell(f(x_1), y_1) \geq \ell(f(x_2), y_2)$. Obviously, one cannot expect to have an ideal $\kappa_f$. Given a confidence-rate functions $\kappa_f$, a useful way to analyze its effectiveness is to draw the risk-coverage curve of its induced rejection function, $g_\theta(x| \kappa_f)$, as defined in (3). This risk-coverage curve shows the relationship between $\theta$ and $R(f, g_\theta)$. For example, see Figure 2(a) where a two (nearly identical) risk-coverage curves are plotted. While the confidence-rate functions we consider are not ideal, they will be shown empirically to be extremely effective.
The first confidence-rate function we consider has been around in the NN folklore for years, and is explicitly mentioned by [2, 4] in the context of reject option. This function works as follows: given any neural network classifier $f(x)$ where the last layer is a softmax, we denote by $f(x|j)$ the soft response output for the $j$th class. The confidence-rate function is defined as $\kappa \triangleq \max_{j \in {\cal Y}}(f(x|j))$. We call this function softmax response (SR).
Softmax responses are often treated as probabilities (responses are positive and sum to 1), but some authors criticize this approach [9]. Noting that, for our purposes, the ideal confidence-rate function should only provide coherent ranking rather than absolute probability values, softmax responses are potentially good candidates for relative confidence rates.
We are not familiar with a rigorous explanation for SR, but it can be intuitively motivated by observing neuron activations. For example, Figure 1 depicts average response values of every neuron in the second-to-last layer for true positives and false positives for the class ‘8’ in the MNIST dataset (and qualitatively similar behavior occurs in all MNIST classes). The x-axis corresponds to neuron indices in that layer (1-128); and the y-axis shows the average responses, where green squares are averages of true positives, boldface squares highlight strong responses, and red circles correspond to the average response of false positives. It is evident that the true positive activation response in the active neurons is much higher than the false positive, which is expected to be reflected in the final softmax layer response. Moreover, it can be seen that the large activation values are spread over many neurons, indicating that the confidence signal arises due to numerous patterns detected by neurons in this layer. Qualitatively similar behavior can be observed in deeper layers.
The MC-dropout technique we consider was recently proposed to quantify uncertainty in neural networks [9]. To estimate uncertainty for a given instance $x$, we run a number of feedforward iterations over $x$, each applied with dropout in the last fully connected layer. Uncertainty is taken as the variance in the responses of the neuron corresponding to the most probable class. We consider minus uncertainty as the MC-dropout confidence rate.