この記事は自分用のメモみたいなものです.
ほぼ DeepL 翻訳でお送りします.
間違いがあれば指摘していだだけると嬉しいです.
翻訳元
Selective Classification for Deep Neural Networks
Author: Yonatan Geifman, Ran El-Yaniv
前: 【4 Confidence-Rate Functions for Neural Networks】
次: 【6 Concluding Remarks】
5 Empirical Results
訳文
Section 4 では, 与えられたモデル $f$ に対して定義された SR と MC-dropout 信頼度関数を紹介した. これらのモデル $f$ については, SR と MC-dropout 信頼度関数 $\kappa_f$, および棄却誘導関数 $g_\theta(x| \kappa_f)$ の両方を考慮した. 図 2 では, 3 つのデータセットのそれぞれについて得られたリスクカバー率曲線を示している. これらの曲線は, 多くの $\theta$ 値に対する検証リスクとカバレッジを計算して得られたものである. SR と MC-dropout のリスクカバレッジプロファイルは, CIFAR データセットの両方でほぼ同じであることが明らかになった. ImageNet では, top-1 タスク (破線) と top-5 タスク (実線) に対応する曲線をプロットしている. このデータセットでは, 両方のタスクで SR の方が MC-dropout よりも有意に優れていることがわかる. 例えば, トップ 1 タスクでカバレッジ 60% の場合, SR の不合格率は 10% であるのに対し, MC-dropout の不合格率は 20% 以上となっている. しかし, 最も重要なことは, これらのリスクカバー率曲線が, 選択的分類が 3 つのデータセットのエラーを劇的に削減するために使用できる可能性があることを示していることである. SR の相対的な優位性のために, 我々の実験の残りの部分では, SRの評価にのみ焦点を当てている.

Figure 2: (a) cifar-10, (b) cifar-100, (c) image-net のリスクカバレッジ曲線 (top-1 タスク: 破線; top-5 タスク: 実線), 青が SR 法, 赤が MC-dropout.
ここでは, SGR ルーチンを用いた実験について報告し, 各データセットに適用して, 3 つのデータセットについて高確率でリスク制御された選択分類器を構築する.
5.1 Selective Guaranteed Risk for CIFAR-10
ここでは CIFAR-10 について考える. 我々は VGG-16 アーキテクチャ [17] を使用し, [15] が述べるように大規模なドロップアウトを追加して CIFAR-10 データセットに適応させた. 水平反転, 垂直反転, 水平シフト、回転を含むデータ拡張を使用し, SGD を用いて momentum 0.9, 初期学習率0.1, 重み減衰 0.0005 で学習した. 学習率を 25 エポックごとに 0.5 倍に落とし, 250 エポックで学習した. この設定により, 検証精度は 93.54 に達し, 結果として得られたネットワーク $f_{10}$ を選択的分類器の基礎とした.
我々は, SGR アルゴリズムを SR 信頼度評価関数を用いて $f_{10}$ に適用した. SGR のための訓練セット $S_m$, は, ランダムに 2 等分に分割された標準的な CIFAR-10 検証セットの半分とした. 残りの半分は, 訓練のために SGR で消費されなかったもので, 結果として得られた境界のテスト用に予約された. このように, このトレーニングセットとテストセットは, それぞれ約 5000 個のサンプルから構成されている. 我々は, いくつかの所望のリスク値 $ r^* $ を用いて SGR ルーチンを適用し, そのような $ r^* $ それぞれについて, 対応する選択分類器とリスク境界 $ b^* $ を得た. 我々が行った SGR ルーチンのすべての適用 (このデータセットとそれ以外のデータセット) では, 特に小さな信頼度 $\delta = 0.001$1 が得られた. 次に, 予約されたテストセットにこれらの選択的分類器を適用し, 各選択的分類器について, テストリスクとテストカバレッジを計算した. 結果は表 1 にまとめられているが, ここには, 訓練セットにわたって各選択的分類器について計算された訓練リスクと訓練カバレッジも含まれている.
Table 1: CIFAR-10 の $\delta = 0.001$ に対するリスクコントロール結果

5.2 Selective Guaranteed Risk for CIFAR-100
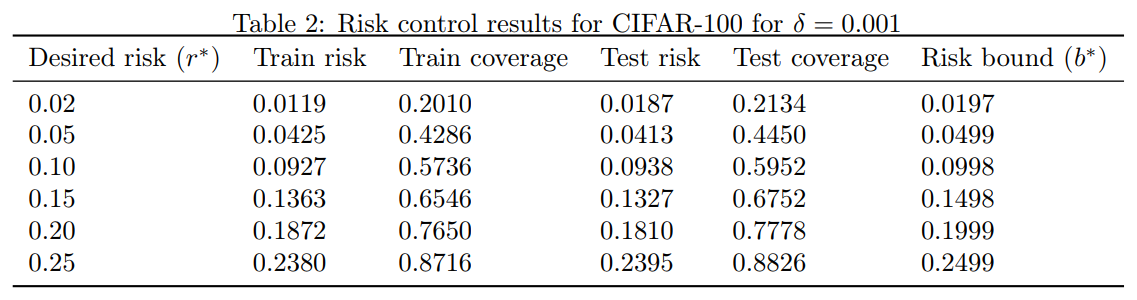
CIFAR-10 実験と同じデータ拡張ルーチンを適用しながら, 同じ VGG アーキテクチャ (現在は100クラスに適応) を用いて, CIFAR-100 のモデルを学習した. CFAR-10 の場合と同じ実験デザインにしたがって, 表 2 の結果が得られた.
Table 2: CIFAR-100 の $\delta = 0.001$ に対するリスクコントロール結果

ここでも, SGR は, 望ましい目標リスクに非常に近いタイトな境界を生成し, その境界が真のリスクによって破られることはなかった. また, カバレッジを適度に妥協するだけで, リスクを大幅に低減できることが改めてわかった. 使用したアーキテクチャは最新のものではなく, カバレッジは 67% だったが, CIFAR-100 の最もよく知られた結果を簡単に上回ることができた (現在, wide residual network アーキテクチャを使用して 18.85%). 我々自身が wide residual network アーキテクチャ [19] を使用することで, かなり良い結果が得られる可能性が高いと考えられる.
5.3 Selective Guaranteed Risk for ImageNet
ILSVRC2014 [16] をベースに, すでに学習済みの Image-Net VGG-16 モデルを使用した. 同じ実験デザインを繰り返したが, 訓練セットとテストセットのサイズは約 25,000 とした. top-1 と top-5 の分類タスクの SGR の結果をそれぞれ表 3 と表 4 にまとめた. また, 異なるアーキテクチャでも定性的に同様の結果が得られるかどうかを確認するために, RESNET-50 アーキテクチャ [12] を実装した. ImageNet の top-1 分類タスクと top-5 分類タスクの RESNET-50 の結果をそれぞれ表 5 と表 6 にまとめた.
Table 3: $\delta=0.001$ で Image-Net データセット top-1 に VGG-16 を使用した SGR の結果
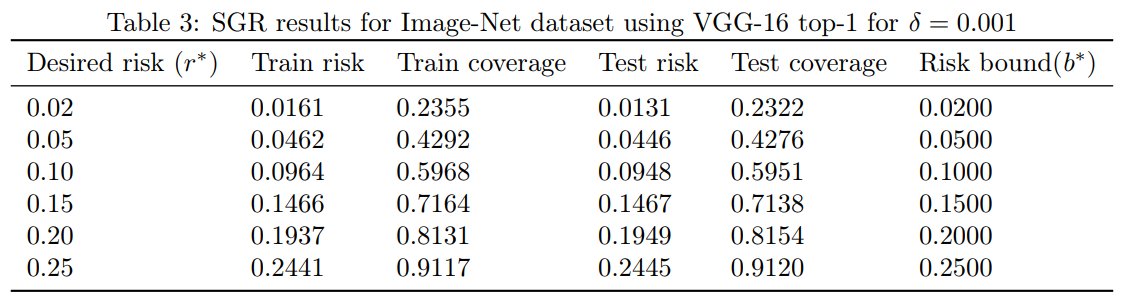
Table 4: $\delta=0.001$ で Image-Net データセット top-5 に VGG-16 を使用した SGR の結果
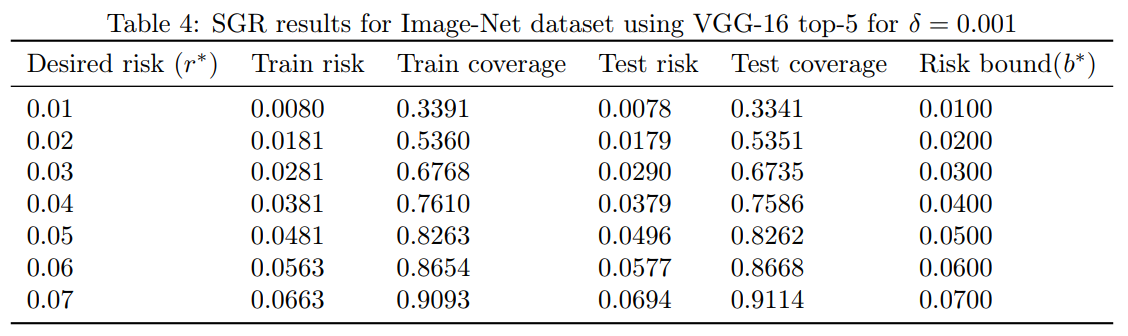
Table 5: $\delta=0.001$ で Image-Net データセット top-1 に RESNET50 を使用した SGR の結果
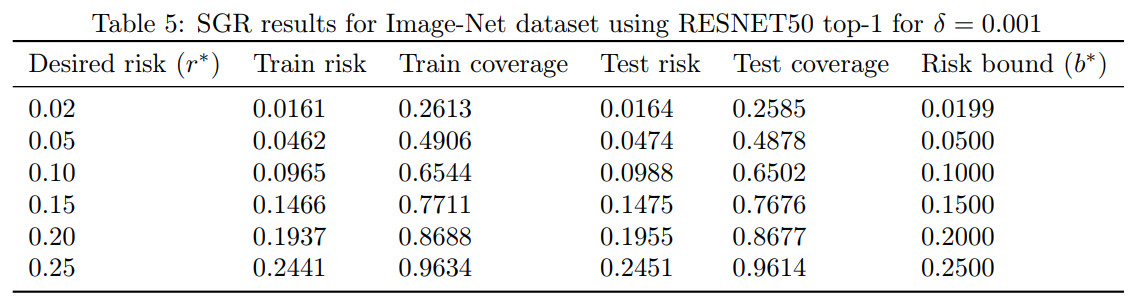
Table 6: $\delta=0.001$ で Image-Net データセット top-5 に RESNET50 を使用した SGR の結果
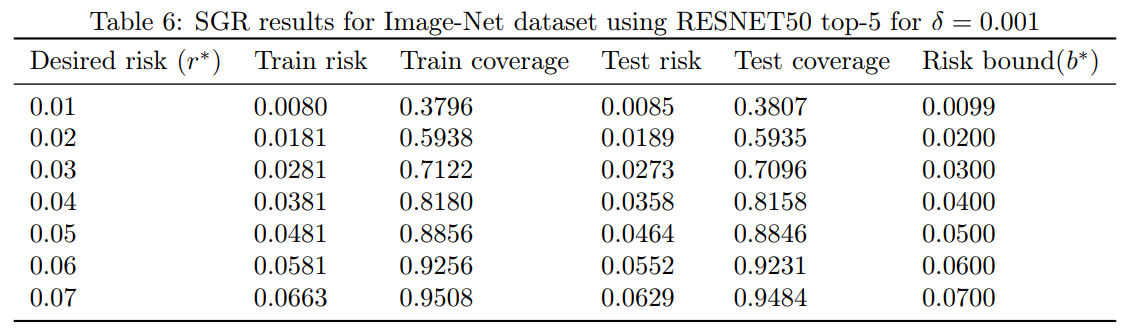
これらの結果は, VGG と RESNET の両方のアーキテクチャを使用した難しい ImageNet においても, 我々の選択的分類器は非常に効果的であり, 適切なカバレッジの妥協により, 我々の分類器は ImageNet の既知の最良の結果を容易に凌駕することを示している. 驚くことではありませんが, RESNET はこのセットで VGG よりも優れた結果が得られることが知られており, すべての $ r^* $ 値を通して VGG に対する相対的な優位性を維持している.
原文
In Section 4 we introduced the SR and MC-dropout confidence-rate function, defined for a given model $f$. We trained VGG models [17] for CIFAR-10, CIFAR-100 and ImageNet. For each of these models $f$, we considered both the SR and MC-dropout confidence-rate functions, $\kappa_f$, and the induced rejection function, $g_\theta(x| \kappa_f)$. In Figure 2 we present the risk-coverage curves obtained for each of the three datasets. These curves were obtained by computing a validation risk and coverage for many $\theta$ values. It is evident that the risk-coverage profile for SR and MC-dropout is nearly identical for both the CIFAR datasets. For the ImageNet set we plot the curves corresponding to top-1 (dashed curves) and top-5 tasks (solid curves). On this dataset, we see that SR is significantly better than MC-dropout on both tasks. For example, in the top-1 task and 60% coverage, the SR rejection has 10% error while MC-dropout rejection incurs more than 20% error. But most importantly, these risk-coverage curves show that selective classification can potentially be used to dramatically reduce the error in the three datasets. Due to the relative advantage of SR, in the rest of our experiments we only focus on the SR rating.
We now report on experiments with our SGR routine, and apply it on each of the datasets to construct high probability risk-controlled selective classifiers for the three datasets.
5.1 Selective Guaranteed Risk for CIFAR-10
We now consider CIFAR-10; see [14] for details. We used the VGG-16 architecture [17] and adapted it to the CIFAR-10 dataset by adding massive dropout, exactly as described in [15]. We used data augmentation containing horizontal flips, vertical and horizontal shifts, and rotations, and trained using SGD with momentum of 0.9, initial learning rate of 0.1, and weight decay of 0.0005. We multiplicatively dropped the learning rate by 0.5 every 25 epochs, and trained for 250 epochs. With this setting we reached validation accuracy of 93.54, and used the resulting network $f_{10}$ as the basis for our selective classifier.
We applied the SGR algorithm on $f_{10}$ with the SR confidence-rating function, where the training set for SGR, $S_m$, was taken as half of the standard CIFAR-10 validation set that was randomly split to two equal parts. The other half, which was not consumed by SGR for training, was reserved for testing the resulting bounds. Thus, this training and test sets where each of approximately 5000 samples. We applied the SGR routine with several desired risk values, $ r^* $ , and obtained, for each such $ r^* $ , corresponding selective classifier and risk bound $ b^* $ . All our applications of the SGR routine (for this dataset and the rest) where with a particularly small confidence level $\delta = 0.001$.2 We then applied these selective classifiers on the reserved test set, and computed, for each selective classifier, test risk and test coverage. The results are summarized in Table 1, where we also include train risk and train coverage that were computed, for each selective classifier, over the training set.

5.2 Selective Guaranteed Risk for CIFAR-100
Using the same VGG architechture (now adapted to 100 classes) we trained a model for CIFAR-100 while applying the same data augmentation routine as in the CIFAR-10 experiment. Following precisly the same experimental design as in the CFAR-10 case, we obtained the results of Table 2.
Here again, SGR generated tight bounds, very close to the desired target risk, and the bounds were never violated by the true risk. Also, we see again that it is possible to dramatically reduce the risk with only moderate compromise of the coverage. While the architecture we used is not state-of-the art, with a coverage of 67%, we easily surpassed the best known result for CIFAR-100, which currently stands on 18.85% using the wide residual network architecture [19]. It is very likely that by using ourselves the wide residual network architecture we could obtain significantly better results.
5.3 Selective Guaranteed Risk for ImageNet
We used an already trained Image-Net VGG-16 model based on ILSVRC2014 [16]. We repeated the same experimental design but now the sizes of the training and test set were approximately 25,000. The SGR results for both the top-1 and top-5 classification tasks are summarized in Tables 3 and 4, respectively. We also implemented the RESNET-50 architecture [12] in order to see if qualitatively similar results can be obtained with a different architecture. The RESNET-50 results for ImageNet top-1 and top-5 classification tasks are summarized in Tables 5 and 6, respectively.
These results show that even for the challenging ImageNet, with both the VGG and RESNET architectures, our selective classifiers are extremely effective, and with appropriate coverage compromise, our classifier easily surpasses the best known results for ImageNet. Not surprisingly, RESNET, which is known to achieve better results than VGG on this set, preserves its relative advantage relative to VGG through all $ r^* $ values.