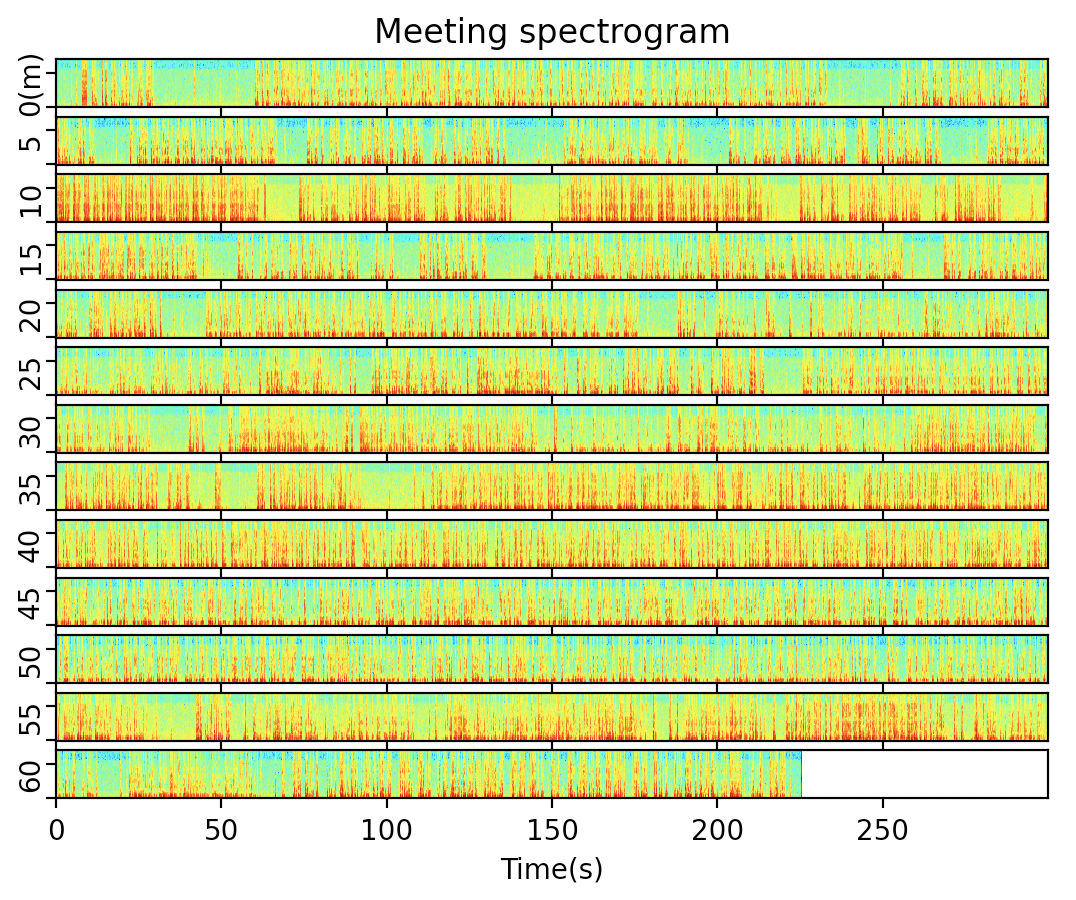
先日の記事「Pythonで音声ファイル(モノラル・ステレオ両対応)のスペクトログラム描画」の応用として、長い会議を1枚の図で見える化してみました。
先日の記事をベースに、以下のような修正を加えました。
- 2CHステレオ音声の平均をとって1CHにする
- stft変換した結果をそのまま表示すると長い会議だと分かりにくくなるため、設定した時間間隔で区切る(半端な部分はゼロ埋めする)
- 区切った要素をスペクトログラム描画し、縦並びにして表示する
2CHステレオの音声データは早々と潰していますが、最後の表示のところで、区切った分をCHとみなすことで、前回のコードを活かしています。
以下がコードです。
import numpy as np
import matplotlib.pyplot as plt
import soundfile as sf
from scipy import signal as sg

# 入力はwavファイルであること(mp3等は入力前にツールで変換する)
x, fs = sf.read('sample.wav', always_2d=True)
# 2CHの平均をとってモノラル化する
x = x.mean(axis=1)

# stft
nperseg = 256
noverlap = nperseg // 2
f, t, Zxx = sg.stft(x, fs=fs, nperseg=nperseg, noverlap=noverlap)
# 人間の声を分析するため7kHz以上の高音はカット
f = f[f < 7000]
Zxx = Zxx[:len(f)]
# interval単位に時間軸で区切った配列にする
interval = 300  # 5分
window = (interval * fs) // (nperseg - noverlap)
padding_size = window - Zxx.shape[1] % window
if padding_size != window:
    Zxx = np.append(Zxx, np.zeros((Zxx.shape[0], padding_size)), axis=1)
    t = np.linspace(0, Zxx.shape[1]/window*interval, Zxx.shape[1])
Zxx = np.reshape(Zxx.T, (-1, window, Zxx.shape[0])).transpose((0, 2, 1))
t = t[:window]

# スペクトログラムを描画するために相対デシベルを求める
dB = 20 * np.log10(np.abs(Zxx))
# スペクトログラムの描画
num_of_graph = dB.shape[0]
fig, ax = plt.subplots(num_of_graph)
if num_of_graph == 1:
    ax = (ax,)  # グラフ1つの時はaxがスカラーなので調整
for i in range(num_of_graph):
    ax[i].tick_params(labelleft=False)
    ax[i].set_ylabel(f'{interval*i//60}')  # 分で表示
    ax[i].pcolormesh(t, f, dB[i], shading='auto', cmap='jet')
    if i == 0:  # 最初のグラフだけ表題をつけて、全体の表題に見せる
        ax[i].set_title('Meeting spectrogram')
        ax[i].set_ylabel(f'{interval*i//60}(m)')
    if i == num_of_graph - 1:  # 最後のグラフだけx軸ラベルをつける
        ax[i].set_xlabel('Time(s)')
    else:
        ax[i].tick_params(labelbottom=False)
plt.show()
出力結果
会議全体の、会話している部分・静かな部分が、なんとなく分かるようになったと思います。ただし、短時間だけ静かな部分について、話者が切り替わっているのか、それとも同じ話者が間を置いているのか、といった区別は難しそうです。
