概要
- SIGNATEで2024年1月18日~2024年2月15日において開催中のコンペ「第2回 金融データ活用チャレンジ」のデータを可視化し、LightGBMでの予測を行ってみました。
- 可視化はSeabornを活用することで、0,1のデータの分布を比較的簡単に見ることができるようになります。
- 予測結果のファイル名を都度設定するのは面倒なので、notebookのファイル名がそのまま使えると便利ですよね。notebookの設定を自動的に読み取る方法も紹介します。
- とりあえずLightGBMで予測してみました。欠損値の補完などがなくても予測できてベースライン作成に便利です。
- Confusion Matrix や Classification Reportを使って予測結果を出力できるようにしておきましょう。
データのインポート・前処理
ライブラリのインポート
notebookの横幅を広げたいときには、IPythonのタグを活用しましょう。
下の例は、notebookの横幅を画面の90%まで広げてくれます。
from IPython.core.display import display, HTML
display(HTML("<style>.container { width:90% !important; }</style>"))
定番のpandasやnumpyに加えて、可視化用にmatplotlib、seabornなどのインポートです。
また、のちの評価のためにclassification_report, confusion_matrixもインポートしましょう。
import pandas as pd
import numpy as np

import matplotlib.pyplot as plt
import seaborn as sns

from sklearn.metrics import classification_report, confusion_matrix
notebook名の取得
何度もモデル作成→推論→submitを繰り返していると、「submit用のファイル名を更新し忘れた!」ということありますよね?(私だけでしょうか?)
そんなミスを防ぐのに一番有効な方法は、notebookの名前をsubmit用のファイル名を合わせておくことです。
notebookの名前は当然ファイルごとに一意に決まりますので、それに対応するsubmitファイル名も一意に決まってくれる、ということですね。
これは自分では思いつかなかったので、ChatGPTにコーディングしてもらいました。便利な時代になりましたね…!
import os
import ipykernel
import requests
from notebook.notebookapp import list_running_servers
import re
import json

def get_notebook_name():
    kernel_id = re.search('kernel-(.*).json', ipykernel.get_connection_file()).group(1)
    servers = list_running_servers()
    for srv in servers:
        response = requests.get(f'{srv["url"]}api/sessions', params={'token': srv.get('token', '')})
        for nb in json.loads(response.text):
            try:
                if nb['kernel']['id'] == kernel_id:
                    return os.path.basename(nb['notebook']['path']).split('.')[0]
            except:
                pass

file_name = get_notebook_name()
print(f"Notebook Name: {file_name}")
データの取得
これはpandasの基本ですね。私はidなどをindexに指定してしまうことが多いので今回もそのようにしました。
train = pd.read_csv('../data/train.csv', index_col=0, parse_dates=['DisbursementDate','ApprovalDate']) # 学習用データ
test = pd.read_csv('../data/test.csv', index_col=0, parse_dates=['DisbursementDate','ApprovalDate']) # 評価用データ
なお、この後pandasのデータを表示するときに、できるだけたくさんの列数を表示させたいのでpandasの設定を変更しておきます。併せて、小数点以下の数値の桁数を固定しておくことで、指数表示にならずに数値が見やすくなることがあります。
この辺りはデータにもよりますので皆さんで好きな表示方法を指定してください。
pd.set_option('display.max_columns', 50)
pd.options.display.float_format = '{:,.4f}'.format
データの前処理
さて、実際にデータを取り込んだあと、データの前処理(欠損値補完や新たな列の追加等)を実行すると思いますが、皆さんはどのように実施しますか?
私はよくtrainデータとtestデータに同じ処理を実施するコードを書いてしまい「面倒だなぁ…」という失敗をしてしまいます。
これらの手間を避けるため、あらかじめ「data_preprocessing関数」を作ってしまうのがお勧めです。
こうすれば、trainとtestに同じ処理を実行できるので、testデータに処理を忘れてエラーになった、というミスがなくなります。
# 元データを加工して、データを分析用データに変換する関数
def data_preprocessing(data):
    data.loc[data['DisbursementDate'].isna(),'DisbursementDate'] = data.loc[data['DisbursementDate'].isna(),'ApprovalDate']
    # 日付のデータは敢えてYYYYMMDD形式の数値として処理
    data['DisbursementDate'] = data['DisbursementDate'].dt.strftime('%Y%m%d').astype('int')
    data['ApprovalDate'] = data['ApprovalDate'].dt.strftime('%Y%m%d').astype('int')

    #DisbursementDate, ApprovalDate が 2070年などとなっているデータが存在。エラーデータと思われるので、1900年代に修正
    data.loc[data['DisbursementDate']>20250000,'DisbursementDate'] = data.loc[data['DisbursementDate']>20250000,'DisbursementDate'] - 1000000

    data.loc[data['ApprovalFY']>2025,'ApprovalFY'] = data.loc[data['ApprovalFY']>2025,'ApprovalFY'] - 100
    data.loc[data['ApprovalDate']>20250000,'ApprovalDate'] = data.loc[data['ApprovalDate']>2025,'ApprovalDate'] - 1000000

    for col in ['DisbursementGross',  'GrAppv', 'SBA_Appv']:
        data[col] = data[col].str.replace(r'[\$, ]', '', regex=True)
        data[col] = data[col].str.replace(',', '')
        data[col] = data[col].str.replace(' ', '')
        data[col] = data[col].astype('float')
    categorical_features = data.select_dtypes(exclude='number').columns
    for col in categorical_features:
        data[col] = data[col].astype('category')
    return data

# 取り込んだデータの加工
train = data_preprocessing(train)
test = data_preprocessing(test)
データの前処理が終わったら、headerの表示と基本統計量の確認をしておきましょう。
処理をミスしていないか、変なデータがないかのチェックの観点でも重要です。
train.head(5)
train.describe()
データの可視化
ここからデータの可視化を実施します。
その際に、数値系のデータとカテゴリカルデータで処理が異なるので、カラムを分けておくとよいでしょう。
numeric_columns = train.select_dtypes(include='number').columns
object_columns = train.select_dtypes(exclude='number').columns
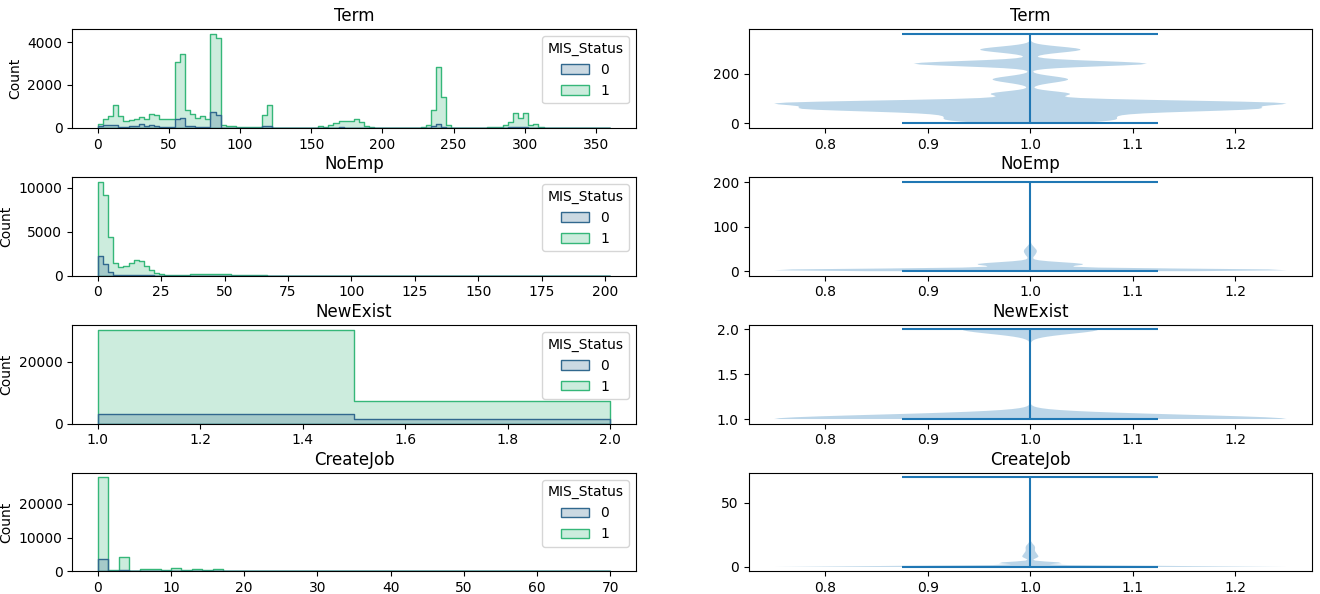
数値系のデータについて、ヒストグラムを使って傾向があるかを見ていきます。
seabornのhistplotを使うと便利です。
ついでに、violinplotのグラフも作ってみました。
train_int = train.select_dtypes(include='number')

fig,ax = plt.subplots(len(train_int.columns),2,figsize=(16,32))
plt.subplots_adjust(hspace=0.5)
for i,col in enumerate(train_int.columns):
    bins = train_int[col].nunique()
    bins = bins if bins<100 else 100 # ユニークなデータの個数が100を超えたらbinを100にする
    sns.histplot(train,x=col,hue='MIS_Status', bins=bins, element='step', palette='viridis',ax=ax[i,0])
#     ax[i,0].hist(train_int[col],bins=bins)
    ax[i,0].set_title(col)
    ax[i,0].set_xlabel('')
    ax[i,1].violinplot(train_int[col])
    ax[i,1].set_title(col)
    ax[i,1].set_xlabel('')
plt.show()
なお、SectorやFranchiseCodeなど、「本来は数値系のデータとして扱わないほうがいいのでは…?」と思うデータもあるのですが、意外と数値の大小に意味があるケースもあるので数値系のデータとして扱いました。
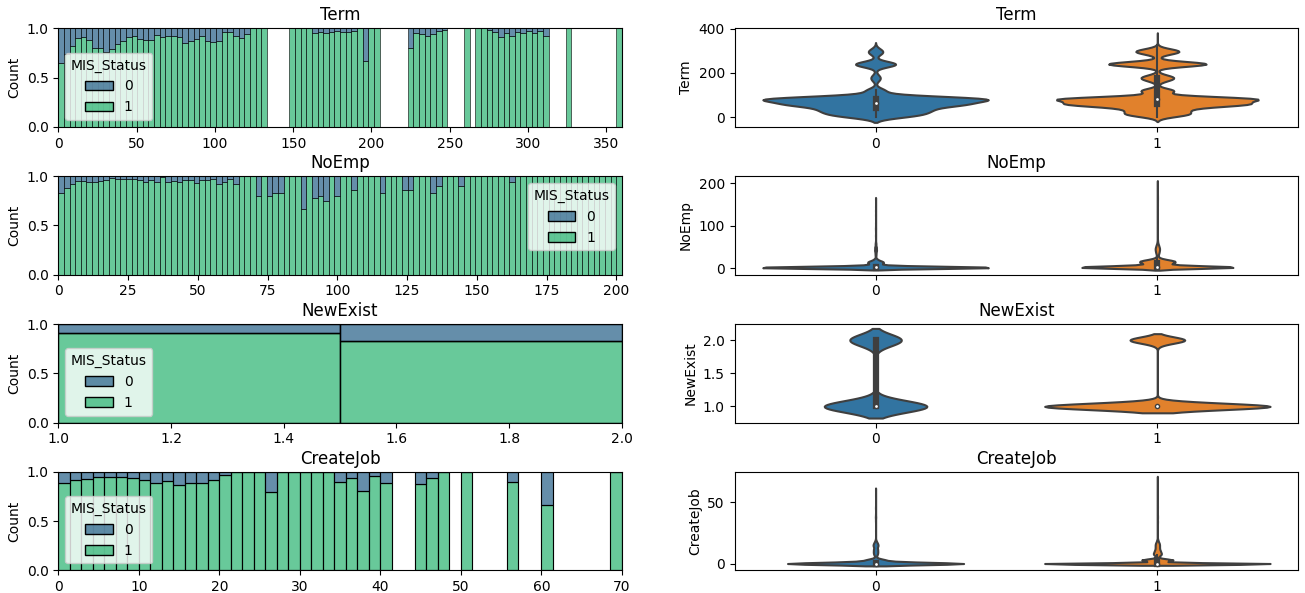
また、このグラフだとデータに偏りがある場合に少数のデータの傾向がつかめないため、比率の形で表示したグラフも作ってみました。
fig,ax = plt.subplots(len(train_int.columns),2,figsize=(16,32))
plt.subplots_adjust(hspace=0.5)
for i,col in enumerate(train_int.columns):
    bins = train_int[col].nunique()
    bins = bins if bins<100 else 100 # ユニークなデータの個数が100を超えたらbinを100にする
    sns.histplot(train, x=col, hue='MIS_Status', element='bars', palette='viridis', bins=bins, multiple='fill', fill=True, ax=ax[i,0])
#     ax[i,0].hist(train_int[col],bins=bins)
    ax[i,0].set_title(col)
    ax[i,0].set_xlabel('')
    sns.violinplot(x='MIS_Status', y=col, data=train_int,ax=ax[i,1])
    ax[i,1].set_title(col)
    ax[i,1].set_xlabel('')
plt.show()
比率で見ると、「Termが大きいほうが1の割合が上がりそう」「NoEmpが大きいほうが1の割合が上がりそう」などの傾向がありそうですね。
カテゴリカルデータの場合はhistplotが使えなかったので、MIS_Statusが0のデータの数と合計のデータの数をグラフにすることにしました。より良い方法があれば教えてください。
fig,ax = plt.subplots(len(object_columns),2,figsize=(16,16))

for i,col in enumerate(object_columns):
    buf = train.pivot_table(index=col, columns='MIS_Status', values='Term', aggfunc='count')
    buf['sum'] = buf.sum(axis=1)
    buf['0_rate'] = buf[0]/buf['sum']
    buf['1_rate'] = buf[1]/buf['sum']
    buf = buf.reset_index()
#     sns.barplot(data=buf[[0,1]].T,y=0,ax=ax[i,0])
    sns.barplot(data=buf,x=col,y=0,ax=ax[i,0])
    sns.barplot(data=buf,x=col,y='sum',ax=ax[i,0],alpha=0.5)
    ax[i,0].set_title(col)
    ax[i,0].set_xticklabels(buf[col],rotation=90)
    ax[i,0].tick_params(axis='x', labelsize=5)
    ax[i,0].set_xlabel('')
    sns.barplot(data=buf,x=col,y='0_rate',ax=ax[i,1])
    ax[i,1].set_title(col)
    ax[i,1].set_xticklabels(buf[col],rotation=90)
    ax[i,1].tick_params(axis='x', labelsize=5)
    ax[i,1].set_xlabel('')
相関係数も見ておきましょう。
# train[std_columns] の相関行列を求める
corr_matrix = train[numeric_columns].corr()

# 相関行列を図示
plt.figure(figsize=(10, 8))
sns.heatmap(corr_matrix, annot=True, cmap='coolwarm',vmin=-1,vmax=1)
plt.title('Correlation Matrix of Standardized Columns')
plt.show()
LightGBMによる予測
データの可視化ができたら予測をしてみましょう。
取りあえず欠損値補完をしていなくても結果が出せるLightGBMがお勧めです。
また、今回は評価関数「MeanF1Score(MacroF1Score)」を使用するため、LightGBMの学習時にf1スコアを自動表示してくれるようにカスタムメトリクス関数を準備しておきましょう。
from sklearn.metrics import f1_score
# 多クラス分類のためのF1スコア評価関数
def lgb_f1_score(pred, data):
    pred = pred.round().astype('int')
    f1 = f1_score(data.get_label(), pred, average='macro')  # マクロ平均F1スコア
    return 'f1', f1, True
import lightgbm as lgb
from sklearn.model_selection import train_test_split

# データの準備
X = train.drop('MIS_Status', axis=1)  # 特徴量
y = train['MIS_Status']               # 目的変数

# クラスごとの重みをデータ数の逆数としてみる
class_weight = {}
for i in y.unique():
    class_weight[i] = (1/(y==i).sum())

# データの分割
X_train, X_val, y_train, y_val = train_test_split(X, y, test_size=0.2, random_state=42,stratify=y)
weights = y_train.apply(lambda x:class_weight[x])

lgb_train = lgb.Dataset(X_train, y_train,weight=weights)
lgb_val = lgb.Dataset(X_val,y_val)
# パラメータを設定
params = {'task': 'train',
          'boosting_type': 'gbdt',
          'objective': 'binary',
          'metric': ['binary_logloss','custom'],
          'first_metric_only':True,
          'learning_rate': 0.001,
          'num_leaves': 255,
          'seed':42,
          'verbosity': -1,
         }
evaluation_results = {} # 学習の経過を保存する箱
callbacks=[
              lgb.early_stopping(2000,verbose=True),
              lgb.log_evaluation(1000),
              lgb.record_evaluation(evaluation_results)
          ]
# 学習
model_lgb = lgb.train(params,                        # 上記で設定したパラメータ
                  lgb_train,                         # 使用するデータセット
                  num_boost_round=100000,            # 学習の回数
                  feval=lgb_f1_score,                # カスタム評価関数を指定
                  valid_names=['train','val'],       # 学習経過で表示する名称
                  valid_sets=[lgb_train,lgb_val],    # モデル検証のデータセット
                  callbacks=callbacks,
                  )
学習時のパラメータに先ほど作成した「lgb_f1_score」をセットすることでF1スコアを同時に表示してくれるようになります。
こんな感じ↓
Training until validation scores don't improve for 2000 rounds
[1000]	train's binary_logloss: 0.285979	train's f1: 0.733785	val's binary_logloss: 0.285714	val's f1: 0.66549
[2000]	train's binary_logloss: 0.230604	train's f1: 0.800076	val's binary_logloss: 0.282667	val's f1: 0.663236
学習が終わったら、特徴量ごとの重要度を見てみましょう。
fig,ax = plt.subplots(figsize=(12,8))
importance = pd.Series(model_lgb.feature_importance(importance_type='gain'),index=model_lgb.feature_name())
importance = importance.sort_values(ascending=True)
bars = ax.barh(importance.index,importance)
# 各棒に値を表示
for bar in bars:
    width = bar.get_width()
    ax.annotate(f'{width:.4f}',
                xy=(width, bar.get_y() + bar.get_height() / 2),
                xytext=(2, 0),  # 3ポイントのオフセット
                textcoords="offset points",
                ha='left', va='center')
(LightGBMの組み込み関数でも出力されるはずなのですが、なぜか表示がバグってしまったので自分でコードを書いています。)
結果が出たら、そのモデルで推論を行い、結果を表示してみましょう。
# 予測確率を計算
y_train_pred_proba = model_lgb.predict(X_train)
y_val_pred_proba = model_lgb.predict(X_val)

# 確率が0.5以上なら1、それ以外は0とする(0.5という閾値を変えることによって結果が変わる)
y_train_pred = (y_train_pred_proba>=0.5).astype('int')
y_val_pred = (y_val_pred_proba>=0.5).astype('int')

print('===train_data===')
print(confusion_matrix(y_train, y_train_pred))
print(classification_report(y_train, y_train_pred))

print('===val_data===')
print(confusion_matrix(y_val, y_val_pred))
print(classification_report(y_val, y_val_pred))
こんな感じで結果が表示されます。
===train_data===
[[ 3004   649]
 [ 1074 29118]]
              precision    recall  f1-score   support

           0       0.74      0.82      0.78      3653
           1       0.98      0.96      0.97     30192

    accuracy                           0.95     33845
   macro avg       0.86      0.89      0.87     33845
weighted avg       0.95      0.95      0.95     33845

===val_data===
[[ 330  557]
 [ 411 7164]]
              precision    recall  f1-score   support

           0       0.45      0.37      0.41       887
           1       0.93      0.95      0.94      7575

    accuracy                           0.89      8462
   macro avg       0.69      0.66      0.67      8462
weighted avg       0.88      0.89      0.88      8462
あとはtestデータで推論を行えば完了です。
predictions = (model_lgb.predict(test)>=0.5).astype('int')
submit = pd.DataFrame(index=test.index)
submit['MIS_State'] = predictions
submit.to_csv(f'../output/submit_{file_name}.csv', header=None)
推論結果が変でないかをチェックするために、MIS_Stateの比率をチェックすることをお勧めします。
# 念のため、比率などを確認
submit['MIS_State'].value_counts(normalize=True)
こんな感じになります。
1   0.9098
0   0.0902
Name: MIS_State, dtype: float64
まとめ
前処理、データ可視化、モデル作成、submitデータ作成の一連の流れを記載しました。
特にデータ可視化のところをしっかりやると、いろいろなアイデアが湧いてくると思います。
長文にお付き合いいただきありがとうございました。


