

👤 自己紹介
こんにちは、yyyy yyyです。アプリクーポンの運用業務を担当しており、日々の業務改善や効率化に取り組んでいます。最近では、生成AIやCopilotを活用した業務課題の解決に挑戦しており、その過程をQiitaで発信しています。
📌 この記事で紹介するもの
「クーポン配信前・配信中・配信後の売上比較を自動で集計し、Excelに出力するPythonスクリプト」をCopilotと共創しました。
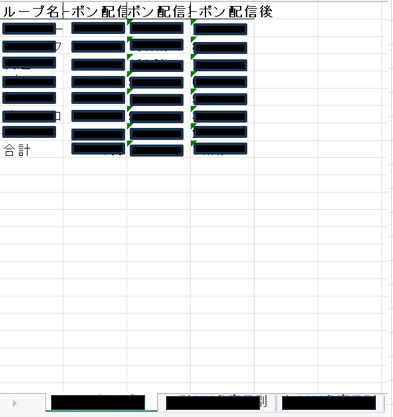
※出力イメージ図
🏢 背景と課題:同僚との会話から生まれた気づき
ある日の業務後、同僚との雑談でこんな話題が出ました。
👩「またExcelでクーポンの集計やってるの?毎回同じことしてない?」
👨「そうなんだけど、地味に時間かかるんだよね」
この一言でハッとしました。
毎月のクーポン施策分析では、以下のような課題がありました:
- 手作業での集計・比較が多く、属人化しやすい
- 施策ごとにフォーマットが微妙に違い、再利用性が低い
- 数値のコピペや並び替えでミスが起こりやすい
- 分析結果のExcel出力に時間がかかる
🤖 解決策:Copilotと共にプロトタイプを構築
使用ツール
- [Copilot](https://copilot.microsoft.coms,
- [python](https://www.python.org/
🛠️ 作ったものの概要
処理内容
- クーポン対象商品売上データのCSVを読み込み
- 各グループ名称統一
- カンマ付き数値を数値型に変換
- グループ別にデータ分割
- 4行おきに売上を抽出して合計
- ピボットテーブル作成(3パターン)
- Excelに3シート構成で出力
CSV読み込みと前処理
df = pd.read_csv('○○.csv', encoding='cp932')
df_mu = pd.read_csv('△△.csv', encoding='cp932')
df['グループ名称'] = df['グループ名称'].replace('○○', '△△')
※グループ名称はQita記事用に記号へ変えてます
カンマ除去と数値変換
def remove_commas_and_convert_to_numeric(series):
🧪 実装コード ※ファイル名、グループ名称など一部記号に書き換えています
import pandas as pd

# CSVファイル読み込み(ファイル名は適宜修正)
df = pd.read_csv('○○.csv', encoding='cp932')
df_mu = pd.read_csv('○○', encoding='cp932')  # ←ファイル名を正しく指定

# 「○○」を「○○」に変換
df['グループ名称'] = df['グループ名称'].replace('○○', '○○')
df_mu['グループ名称'] = df_mu['グループ名称'].replace('○○', '○○')

# カンマを除去して数値に変換
def remove_commas_and_convert_to_numeric(series):
    return pd.to_numeric(series.str.replace(',', ''), errors='coerce')

for col in ['期間前', '期中', '期間後']:
    df[col] = remove_commas_and_convert_to_numeric(df[col])
    df_mu[col] = remove_commas_and_convert_to_numeric(df_mu[col])

# グループごとに分割
grouped_dfs = {group: group_df for group, group_df in df.groupby('グループ名称')}
grouped_dfs_mu = {group: group_df for group, group_df in df_mu.groupby('グループ名称')}

# 特定の行を抽出して合計する関数
def sum_specific_values(grouped_df, column, start_row=0, step=4):
    indices = list(range(start_row, len(grouped_df), step))
    return grouped_df[column].iloc[indices].sum()

# 並び順の指定
group_order = ['○○', '○○', '○○', '○○', '○○', '○○', '○○',
               '○○', '○○', '○○', '○○', '○○', '合計']

# ピボット作成関数
def create_pivot(grouped_data, start_row=0):
    pivot_data = []
    total_before = total_during = total_after = 0

    for name, group in grouped_data.items():
        sum_before = sum_specific_values(group, '期間前', start_row)
        sum_during = sum_specific_values(group, '期中', start_row)
        sum_after = sum_specific_values(group, '期間後', start_row)
        total_before += sum_before
        total_during += sum_during
        total_after += sum_after
        percentage_during = (sum_during / sum_before) * 100 if sum_before else 0
        percentage_after = (sum_after / sum_before) * 100 if sum_before else 0
        pivot_data.append([name, 100, f"{percentage_during:.1f}%", f"{percentage_after:.1f}%"])

    overall_during = (total_during / total_before) * 100 if total_before else 0
    overall_after = (total_after / total_before) * 100 if total_before else 0
    pivot_data.append(['合計', 100, f"{overall_during:.1f}%", f"{overall_after:.1f}%"])

    pivot_df = pd.DataFrame(pivot_data, columns=['グループ名称', 'クーポン配信前', 'クーポン配信期間', 'クーポン配信後'])
    pivot_df['グループ名称'] = pd.Categorical(pivot_df['グループ名称'], categories=group_order, ordered=True)
    return pivot_df.sort_values('グループ名称')

# 各ピボットテーブル作成
pivot_df = create_pivot(grouped_dfs, start_row=0)
pivot_df_start_3 = create_pivot(grouped_dfs, start_row=2)
pivot_df_mu_start_3 = create_pivot(grouped_dfs_mu, start_row=2)

# Excelに出力(3シート構成)
with pd.ExcelWriter('○○.xlsx') as writer:
    pivot_df.to_excel(writer, sheet_name='○○', index=False)
    pivot_df_start_3.to_excel(writer, sheet_name='○○', index=False)
    pivot_df_mu_start_3.to_excel(writer, sheet_name='○○', index=False)
Copilotへの指示
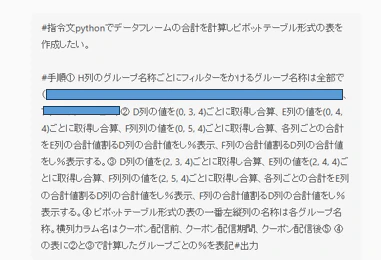
こんな感じ一つ一つ処理を分解しながら支持して最終出来上がったものをまとめて整理してもらいました。
⏱️ 時間短縮とその活用
従来の作業時間:2時間 ⇒ プロトタイプ導入後:約3分
余剰時間の活用
利用率の低いお客さまへプッシュ配信
🧩 Copilotでできなかったこと・気づき
「4行おきに抽出する」ロジックの意図を伝えるのに苦労した
今回は元のデータファイルの型が固定されているものなのでこのデータ分析でのみ使えるものになった。
他のデータでも汎用性があるものを考案していきたい感じた。
Excelのシート構成や並び順の細かい調整は手動で確認が必要だった
AIは「業務文脈」を完全には理解できないため、人間の補完が不可欠
🚀 まとめ
Copilotを活用することで、業務の「面倒だけど重要な作業」を効率化し、より創造的な業務に時間を使えるようになりました。
今後はこのプロトタイプをベースに、自動グラフ生成にも挑戦していきたいです。