はじめに
Microsoft Ignite 2025 では、エージェントのナレッジレイヤーとして Foundry IQ という新しい概念が発表されました。詳細については、@nohanaga さんのブログが非常に分かりやすいので、ぜひご確認ください。
また、Azure AI Search では Build 2025 で発表された エージェンティック検索 が進化し、今回より Foundry IQ のナレッジベース として利用可能(プレビュー)になりました。
ナレッジベースでは、複数のナレッジソース(インデックス)に対してクエリを計画し、同時並行で検索し、さらに結果を統合して返すことができます。従来はアプリケーション側で実装していた検索ロジックの多くを、Azure AI Search が自動的に実行できるようになった点が大きな進化です。

本記事では、この新しいナレッジベース機能の具体的な設定手順を紹介します。公式ドキュメントはこちらです
データの準備
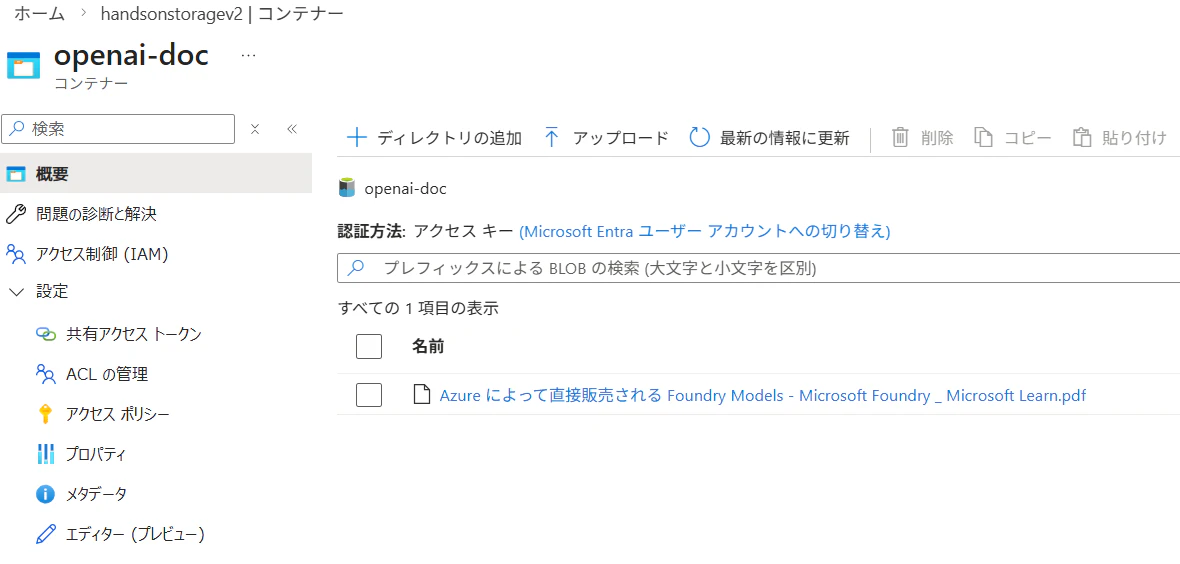
Blob Storage には事前に 2 種類のデータをアップロードしています。
- Azure OpenAI に関するドキュメント
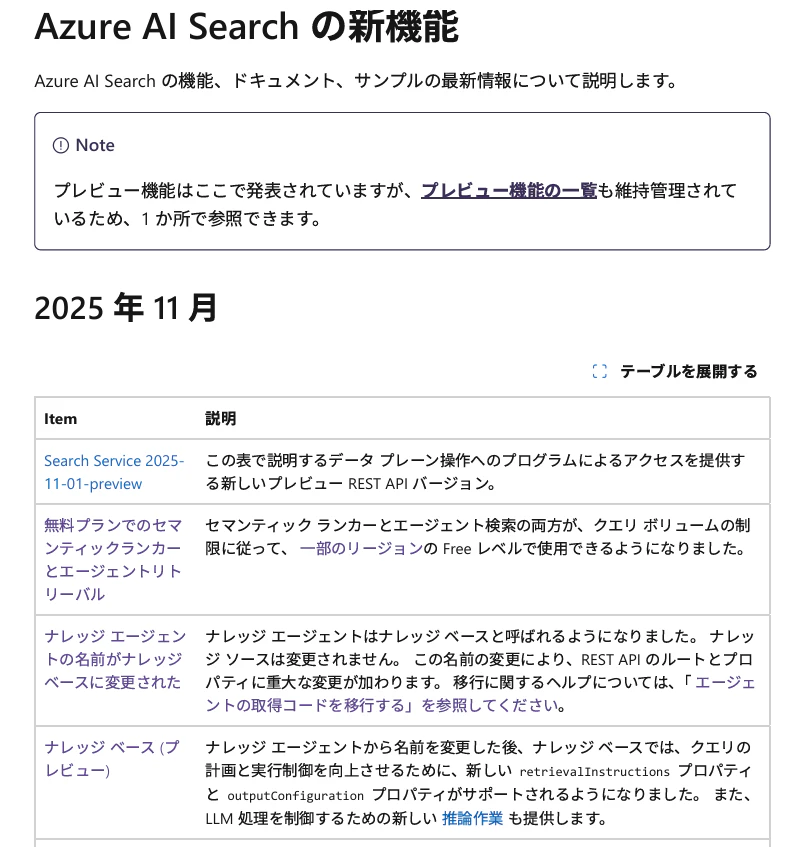
- Azure AI Search の新機能に関するドキュメント
Azure OpenAIのモデルについて記載されたドキュメント

Azure AI Searchの新着情報について記載されたドキュメント

インデックスの作成
アップロードしたデータそれぞれに対し、AI Search の 統合ベクトル化 を利用してインデックスを作成します。ウィザード形式で設定できるため、特別な前処理は不要です。
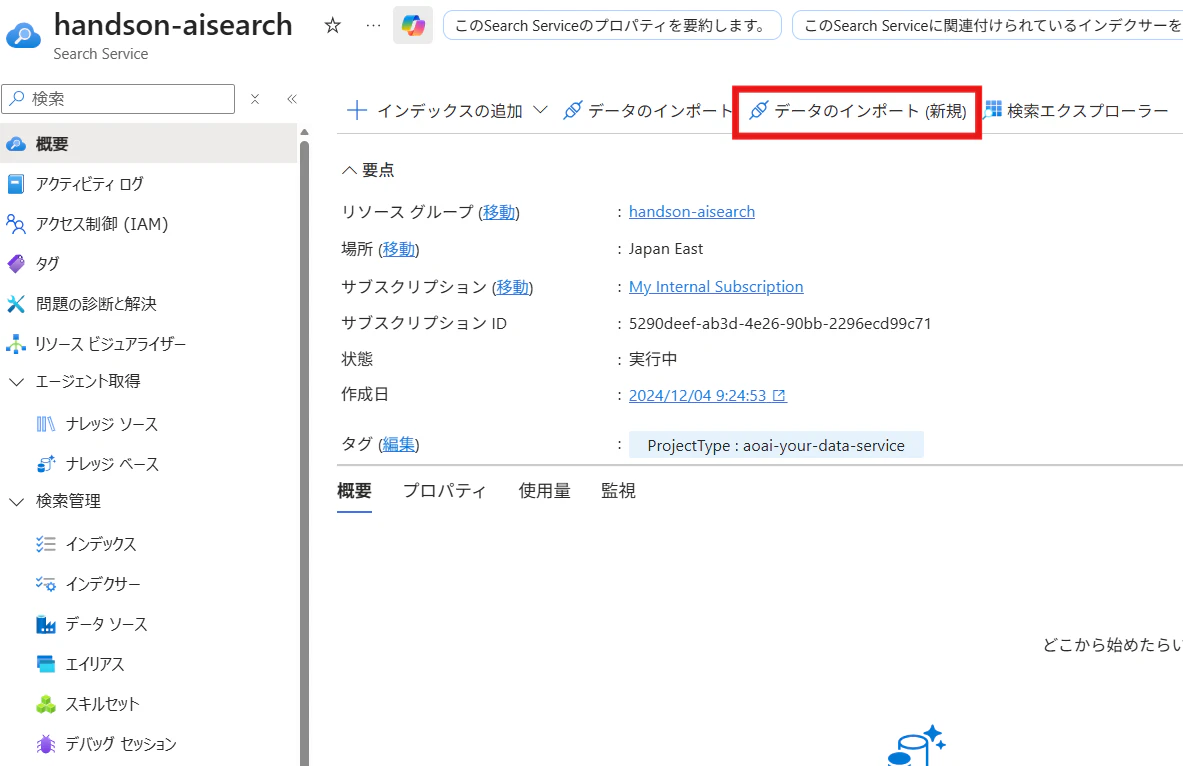
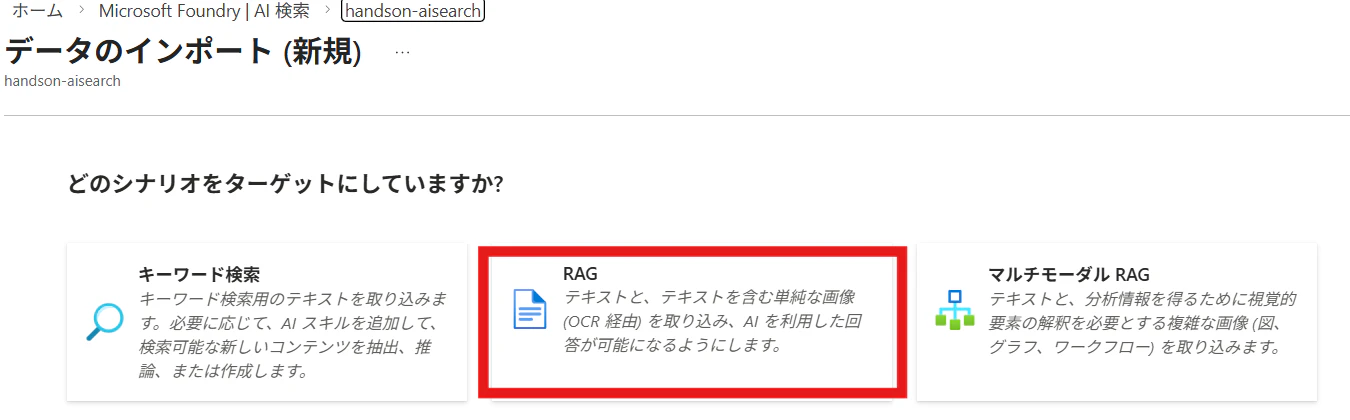
[概要]->データのインポート(新規)を選択します。
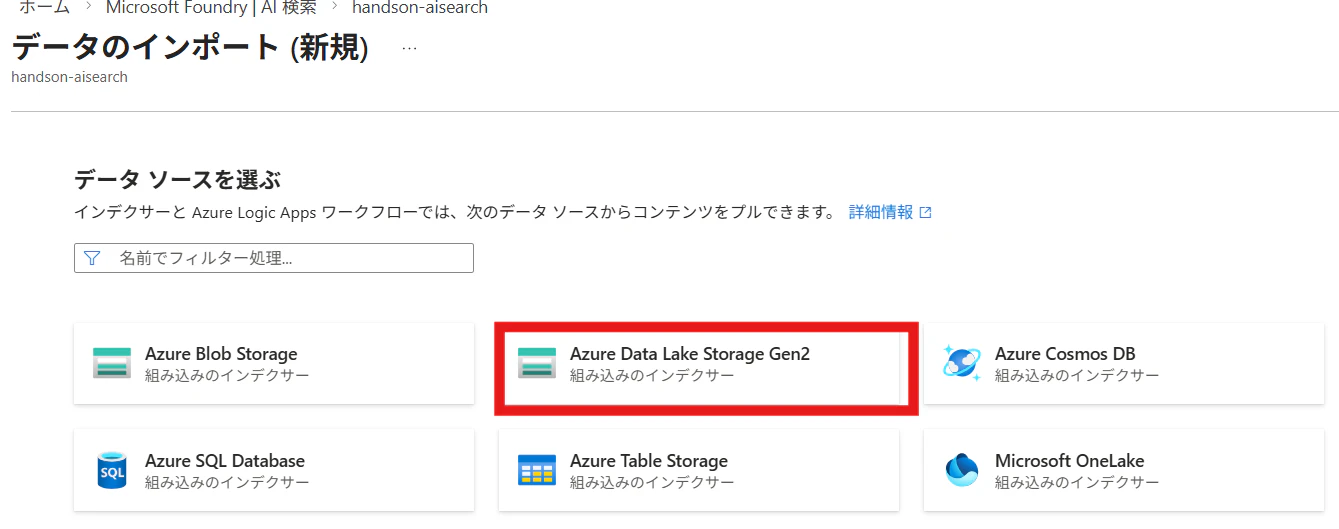
AI Searchの対象データソースを指定します。今回は[Data Lake Storage Gen2]を選択します。
AI Searchでは通常のインデックス作成に加え、画像を含めたインデックスも作成可能です。
今回はシンプルに画像を含めないインデックスを作成するので、[RAG]を選択します。
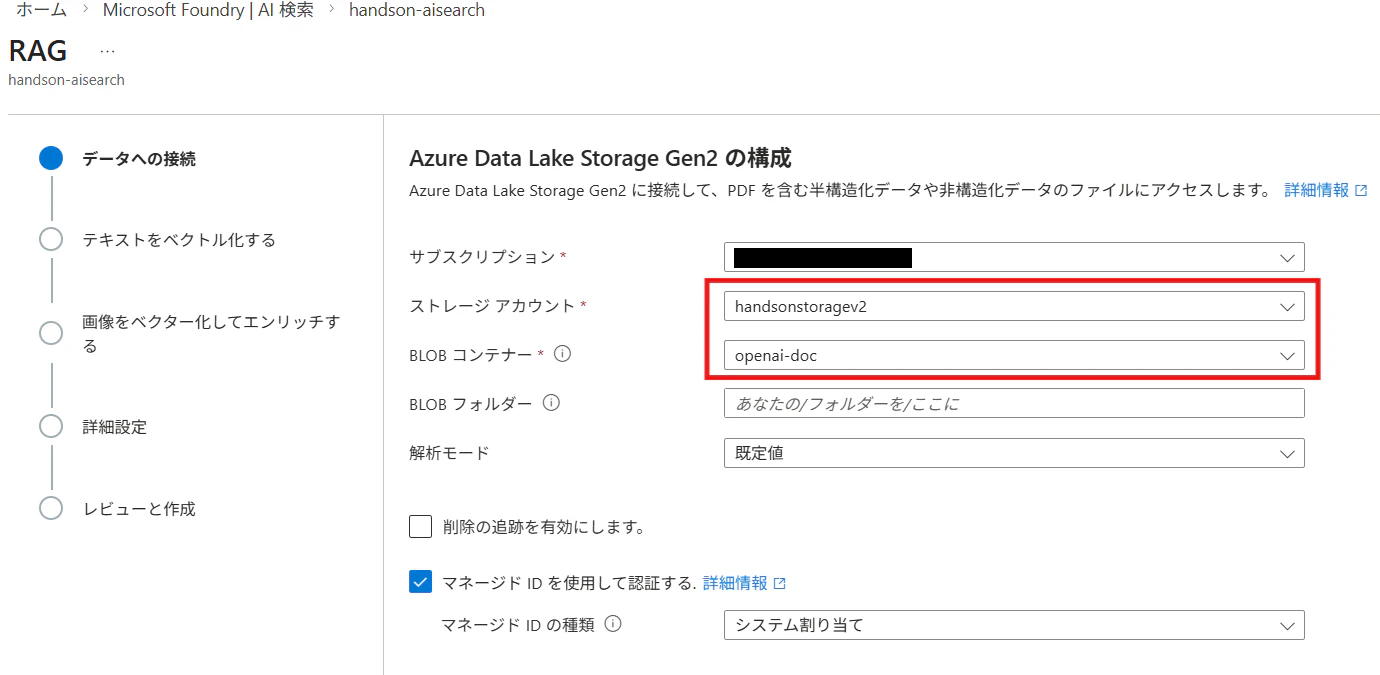
先ほどデータをアップロードしたストレージアカウント、コンテナを指定します。
次にベクトル化に利用するEmbeddingモデルを指定します。
Microsoft Foundryでデプロイした埋め込みモデルを指定できます。

インデックスの名前を入力し、[作成]を選択します。

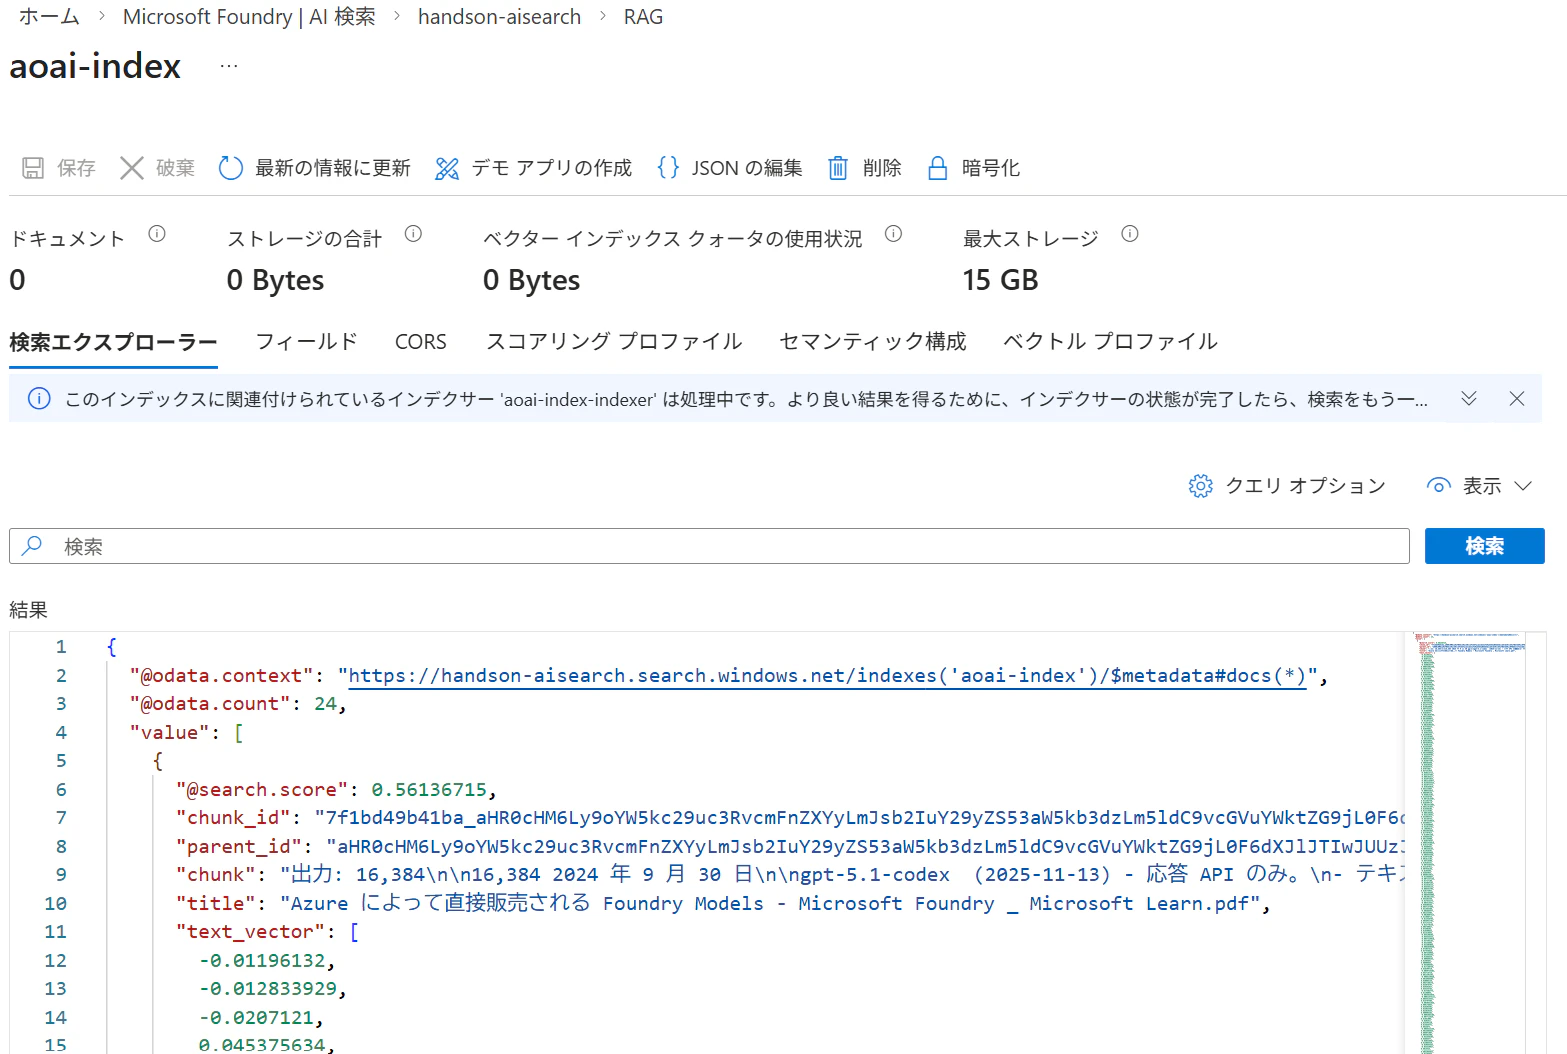
ウィザードからインデックスの作成が完了していることを確認します。
AI Searchのインデックスも同様に作成します。

ナレッジソースの作成
次に、作成したインデックスをナレッジソースとして登録します。
[ナレッジソース]->[ナレッジソースの追加]を選択すると、ナレッジソースの設定が可能です。
[説明]はエージェントがナレッジを選択する際に利用されます。
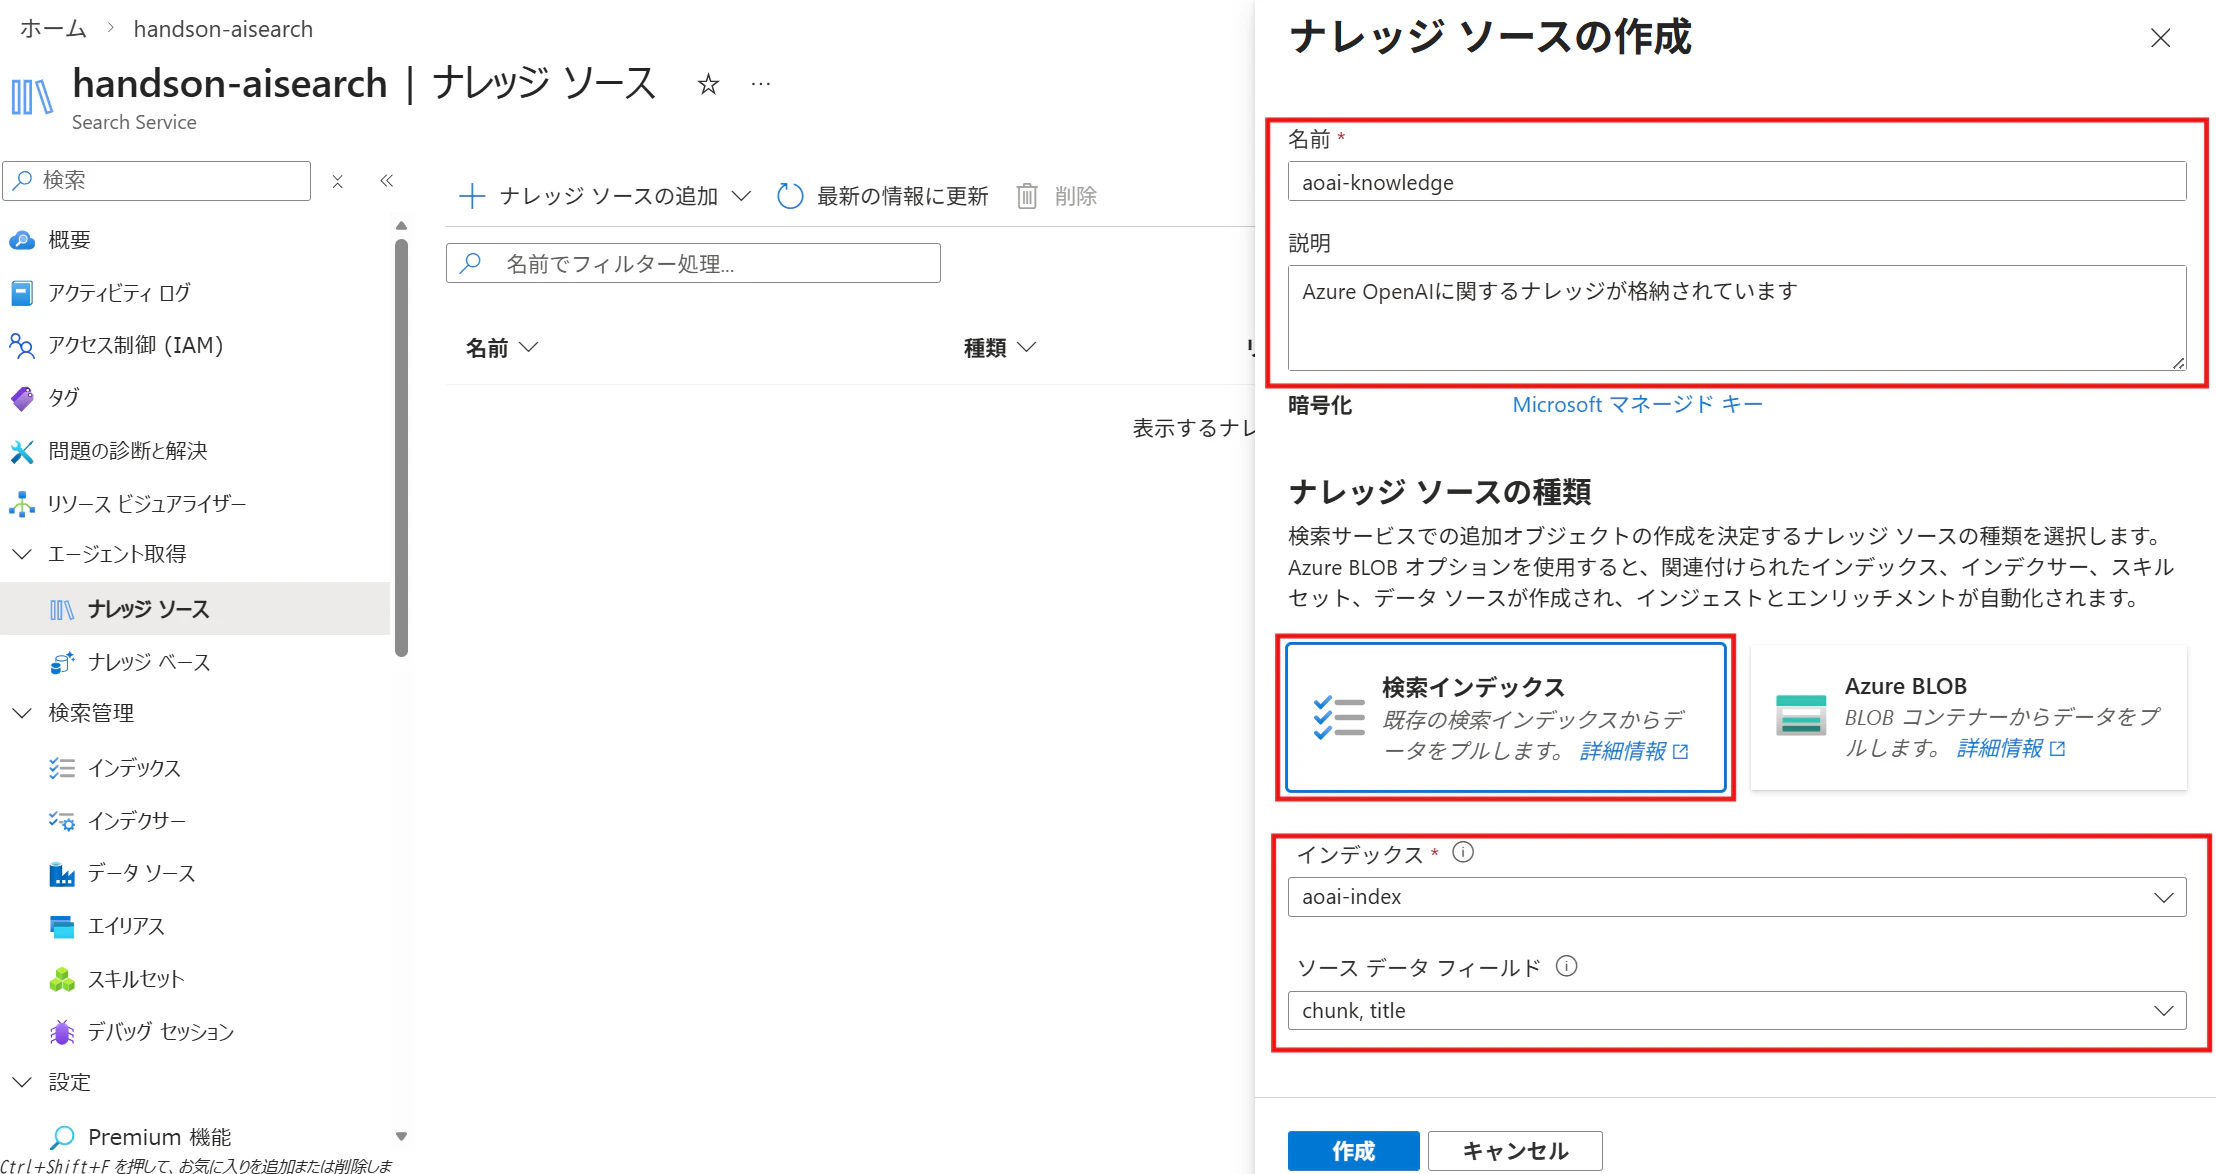
- 説明:エージェントがソースを選択する際の判断材料
- 種類:検索インデックス or Azure Blob
※Azure Blob を選ぶと自動でインデックス化も可能
今回は 検索インデックスを選択し、作成済みのインデックスを登録します。
ソースデータフィールドには、AI が参照可能なフィールドを指定します。
ナレッジベース(エージェント)の作成
続いてナレッジベースを作成します。
[ナレッジベース]->[ナレッジベースの追加]を選択します。
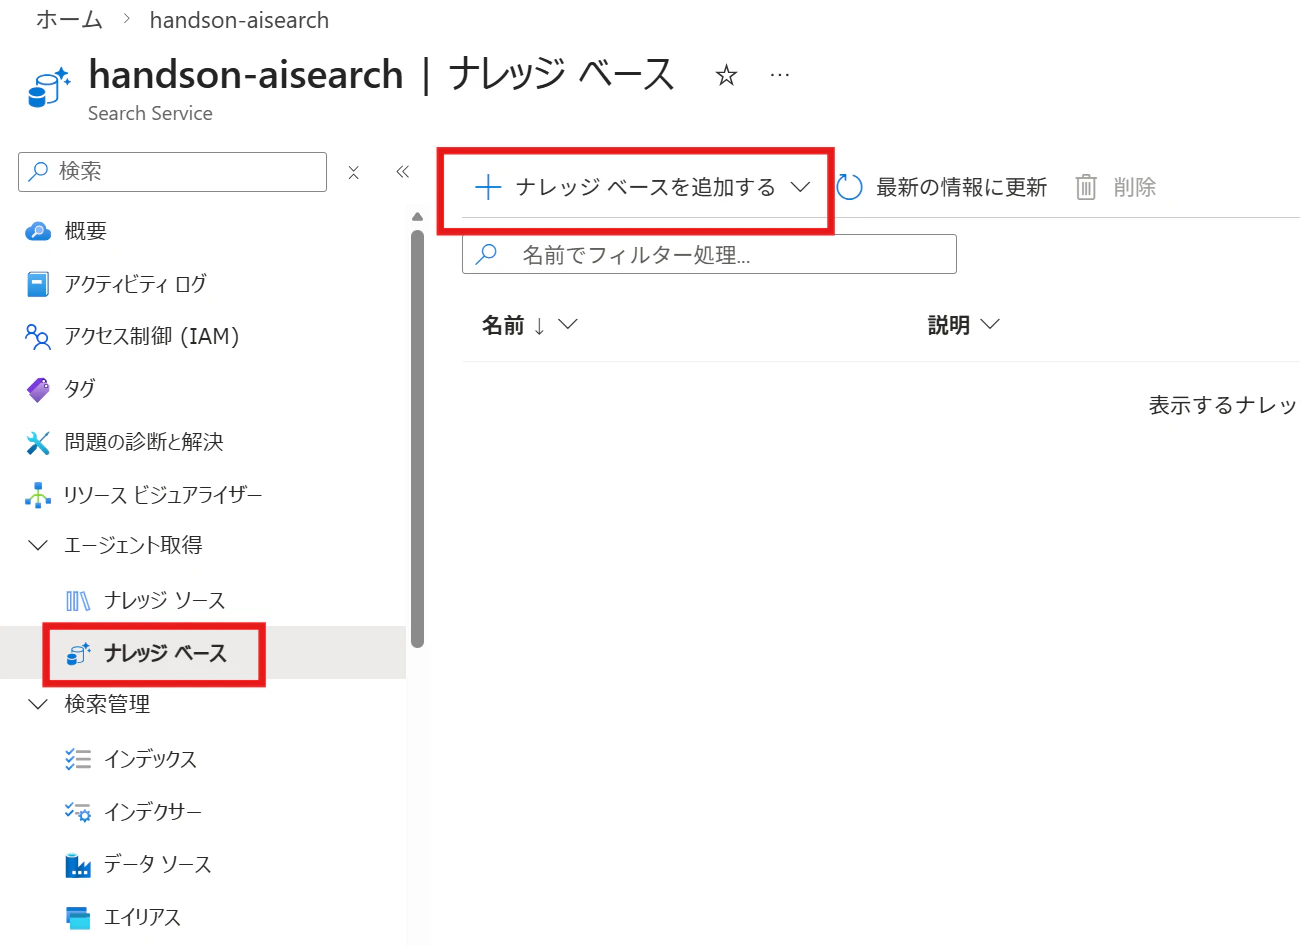
ナレッジベースの[名前]と[説明]を記入します。
検索した結果に基づいて、回答を生成したい場合は、チャット補完モデルを選択します。
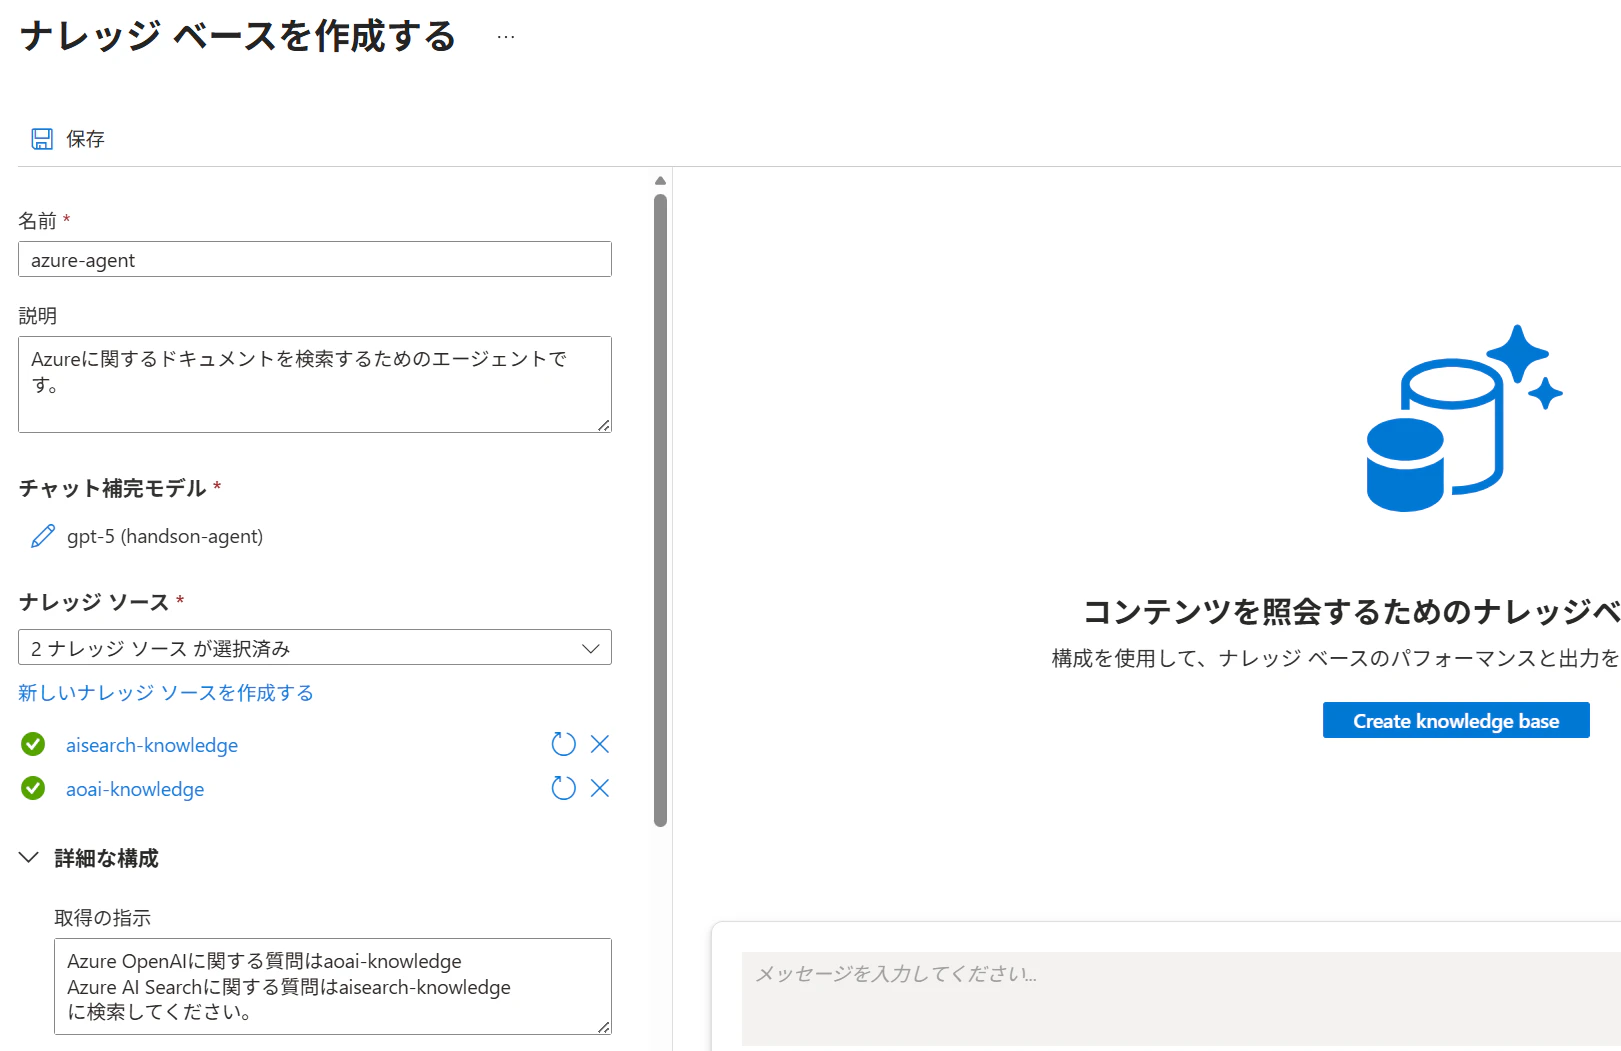
[取得の指示]には、ナレッジソースの選択とクエリ計画をガイドする手順を記入します。
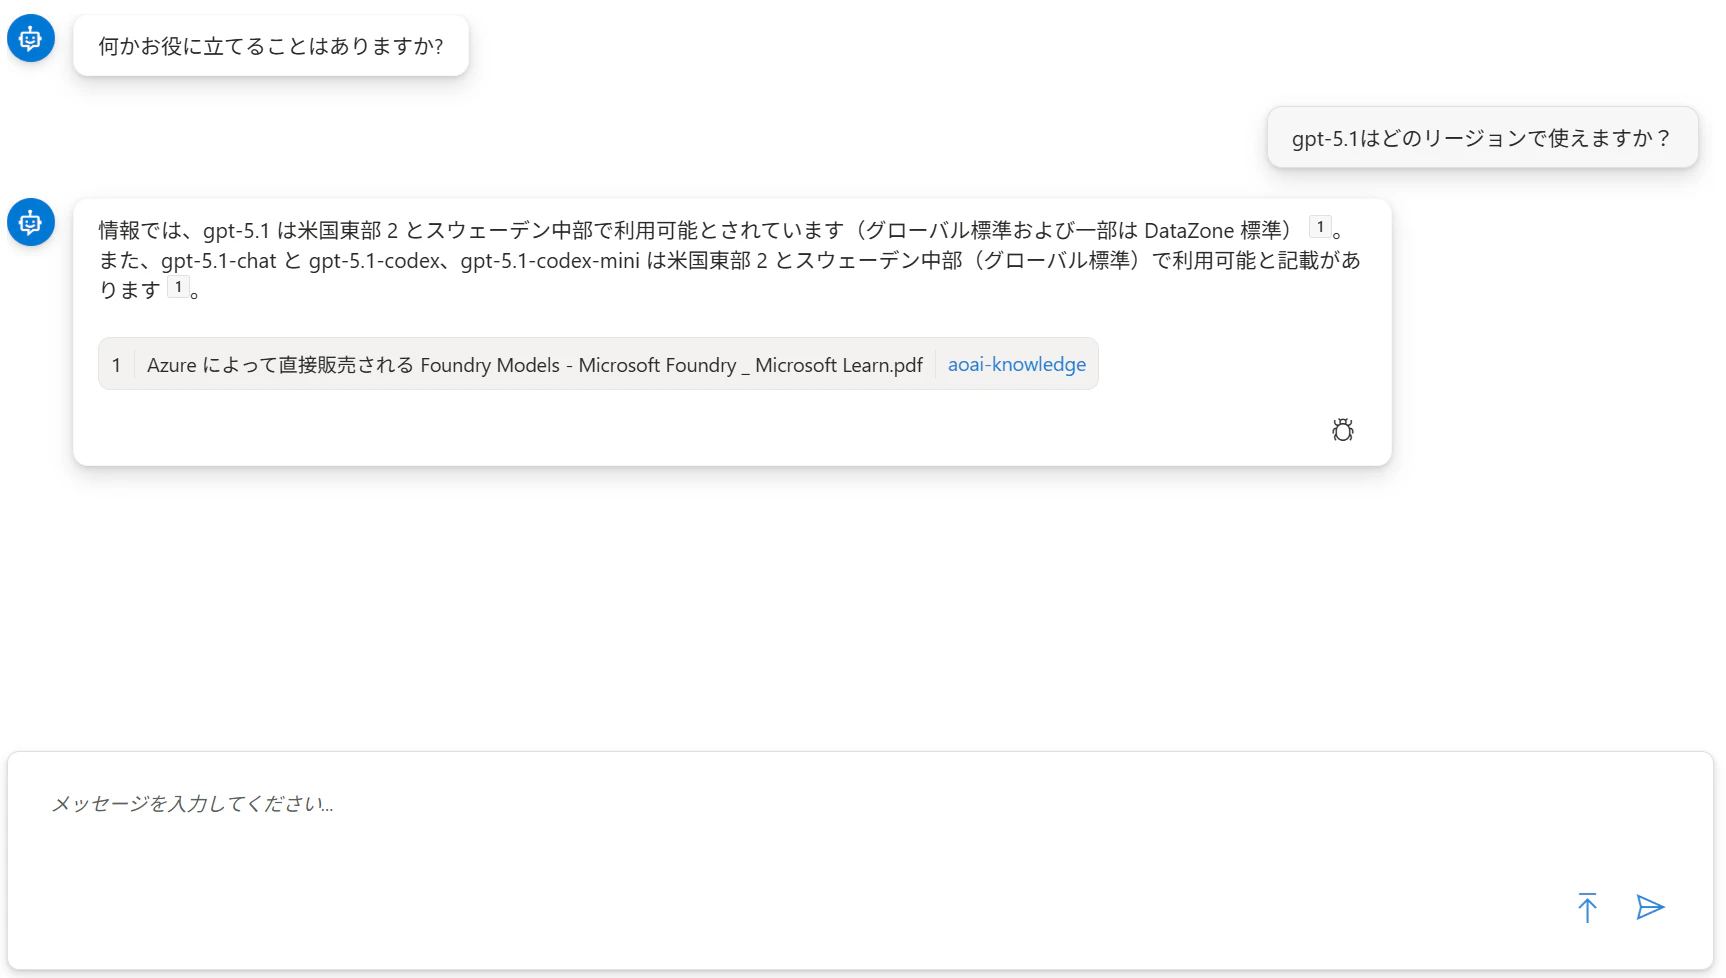
ナレッジベースの動作確認
作成したナレッジベースに対し、LLM が知らない情報(例: GPT-5.1 の提供リージョン)を質問したところ、意図通りナレッジソースから検索し回答できました。
さらに、アクティビティログ から以下が確認できます:
- 複数クエリを自動生成し検索している
- 各検索処理にかかった時間
- トークン消費量
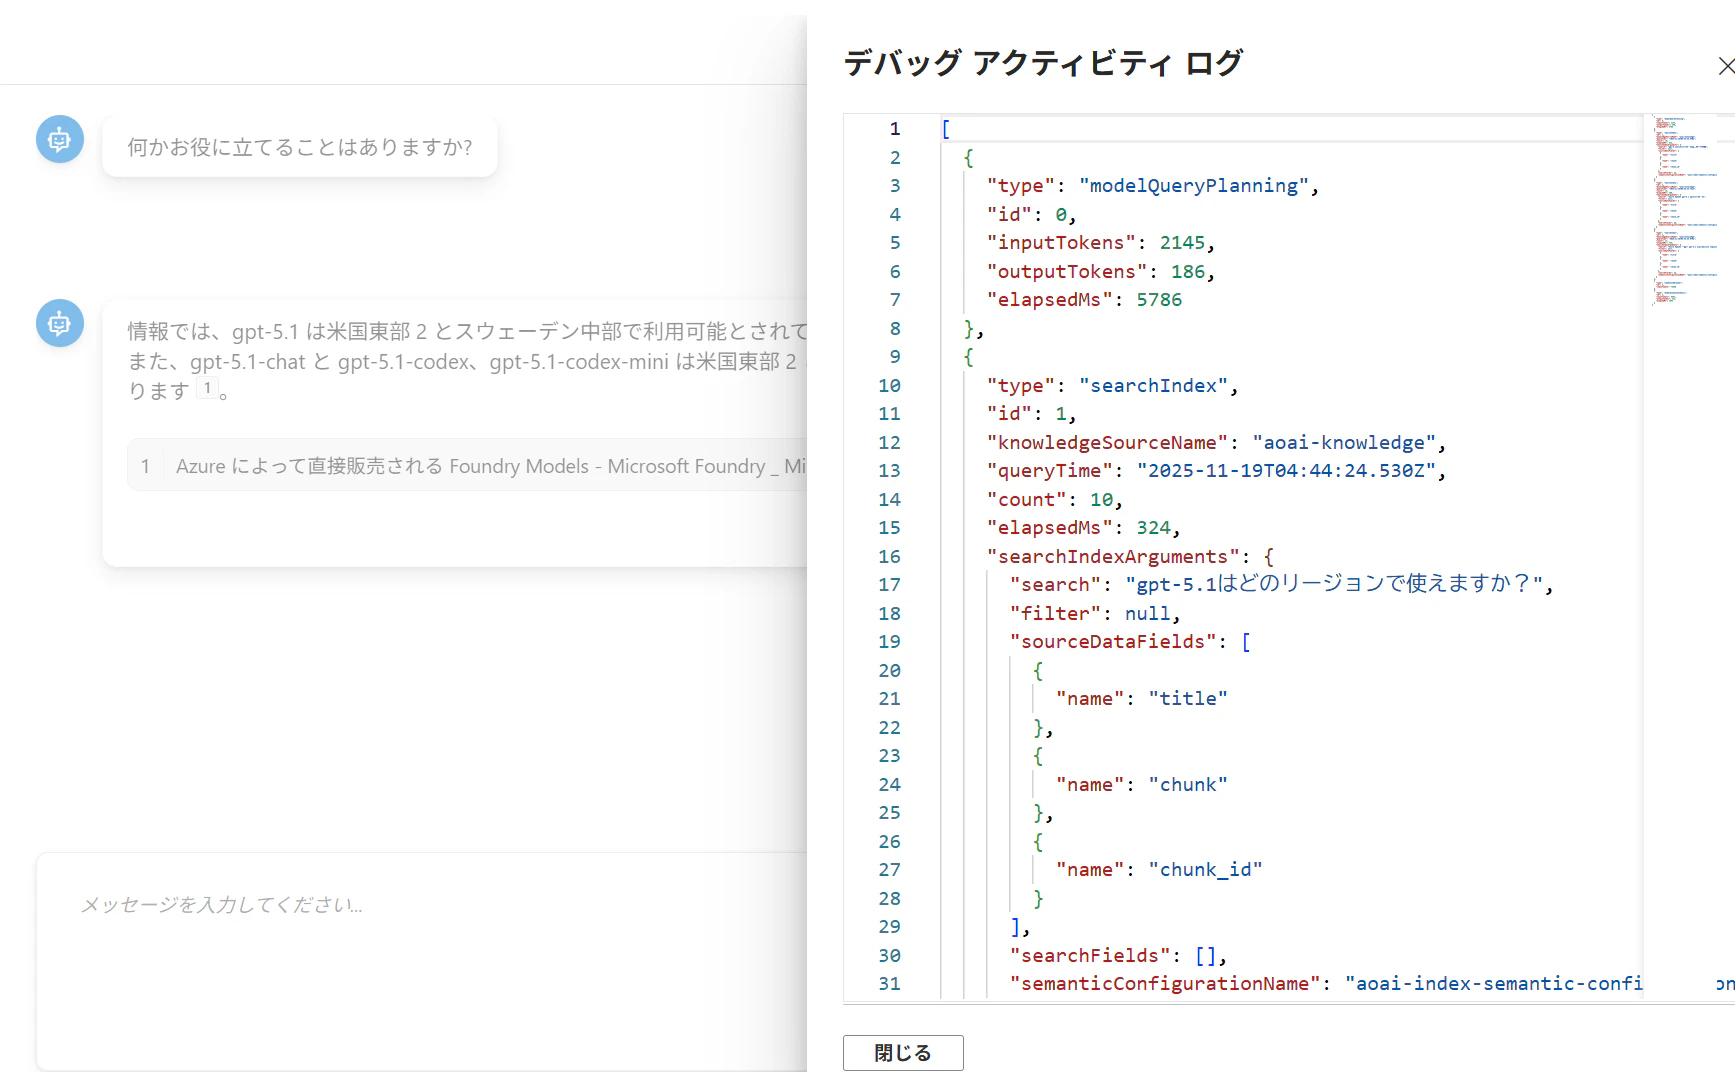
アクティビティログは下記の通りです。
[
  {
    "type": "modelQueryPlanning",
    "id": 0,
    "inputTokens": 2145,
    "outputTokens": 186,
    "elapsedMs": 5786
  },
  {
    "type": "searchIndex",
    "id": 1,
    "knowledgeSourceName": "aoai-knowledge",
    "queryTime": "2025-11-19T04:44:24.530Z",
    "count": 10,
    "elapsedMs": 324,
    "searchIndexArguments": {
      "search": "gpt-5.1はどのリージョンで使えますか?",
      "filter": null,
      "sourceDataFields": [
        {
          "name": "title"
        },
        {
          "name": "chunk"
        },
        {
          "name": "chunk_id"
        }
      ],
      "searchFields": [],
      "semanticConfigurationName": "aoai-index-semantic-configuration"
    }
  },
  {
    "type": "searchIndex",
    "id": 2,
    "knowledgeSourceName": "aoai-knowledge",
    "queryTime": "2025-11-19T04:44:24.732Z",
    "count": 16,
    "elapsedMs": 200,
    "searchIndexArguments": {
      "search": "Azure OpenAI gpt-5.1 提供リージョン",
      "filter": null,
      "sourceDataFields": [
        {
          "name": "title"
        },
        {
          "name": "chunk"
        },
        {
          "name": "chunk_id"
        }
      ],
      "searchFields": [],
      "semanticConfigurationName": "aoai-index-semantic-configuration"
    }
  },
  {
    "type": "searchIndex",
    "id": 3,
    "knowledgeSourceName": "aoai-knowledge",
    "queryTime": "2025-11-19T04:44:24.978Z",
    "count": 17,
    "elapsedMs": 245,
    "searchIndexArguments": {
      "search": "Azure OpenAI モデル gpt-5.1 availability regions",
      "filter": null,
      "sourceDataFields": [
        {
          "name": "title"
        },
        {
          "name": "chunk"
        },
        {
          "name": "chunk_id"
        }
      ],
      "searchFields": [],
      "semanticConfigurationName": "aoai-index-semantic-configuration"
    }
  },
  {
    "type": "semanticReranker",
    "id": 4,
    "inputTokens": 74469
  },
  {
    "type": "modelAnswerSynthesis",
    "id": 5,
    "inputTokens": 6833,
    "outputTokens": 142,
    "elapsedMs": 4955
  }
]
aoai-indexに対して複数のクエリを生成し、検索していることが確認できます。
トークン数が分かるのもありがたいですね。
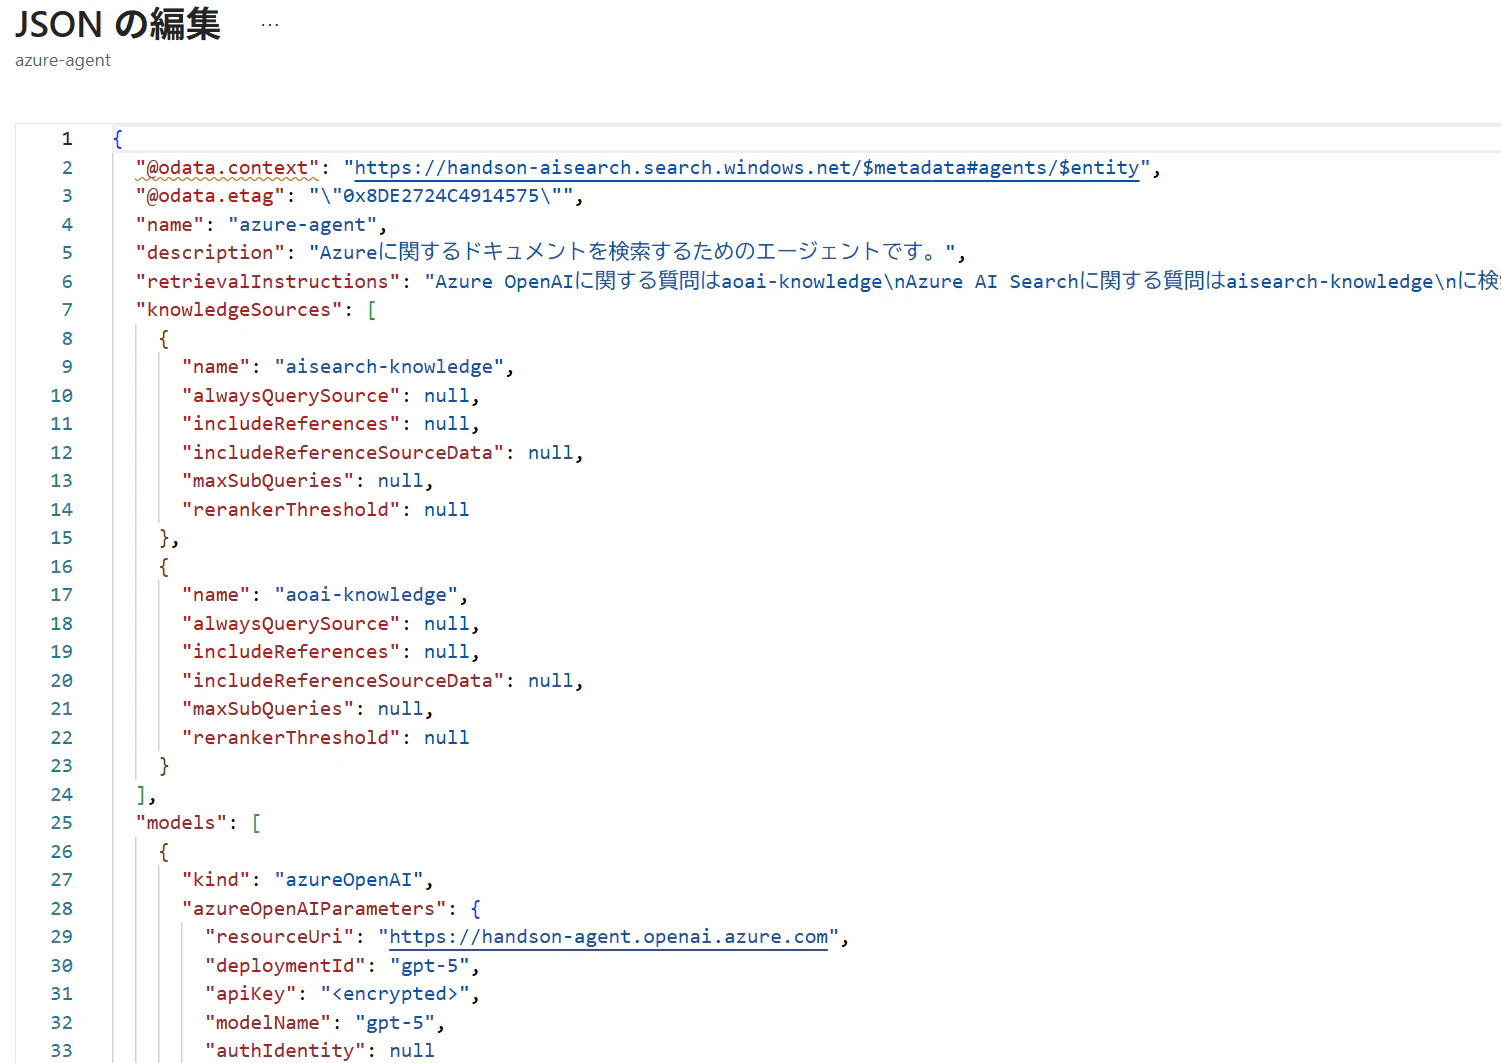
ポータルからは一部の簡単な設定しかできませんが、[ナレッジベースの編集(JSON)]から各パラメータを編集可能です。

外部利用(REST API)
作成したナレッジベースは、REST API経由で呼び出すことが可能です。
### Run agentic retrieval
POST {{search-url}}/knowledgebases/{{knowledge-base-name}}/retrieve?api-version={{api-version}}  HTTP/1.1
    Content-Type: application/json
    Authorization: Bearer {{token}}

    {
        "messages": [
            {
                "role": "user",
                "content": [
                    {
                        "type": "text",
                        "text": "Why do suburban belts display larger December brightening than urban cores even though absolute light levels are higher downtown? Why is the Phoenix nighttime street grid is so sharply visible from space, whereas large stretches of the interstate between midwestern cities remain comparatively dim?"
                    }
                ]
            }
        ],
        "knowledgeSourceParams": [
        {
            "knowledgeSourceName": "{{knowledge-source-name}}",
            "kind": "searchIndex",
            "includeReferences": true,
            "includeReferenceSourceData": true,
            "alwaysQuerySource": true,
            "rerankerThreshold": 2.5
        }
    ],
    "includeActivity": true,
    "retrievalReasoningEffort": { "kind": "low" }
    }
レスポンスには以下情報が含まれます:
- 生成した回答
- 活動ログ(生成フェーズの内訳)
- 参照ドキュメント
- Reranker スコア
{
  "response": [
    {
      "content": [
        {
          "type": "text",
          "text": "The retrieved documents do not provide an explanation for why suburban belts show larger December brightening than urban cores, so no reason for that seasonal contrast is given in these sources [ref_id:0][ref_id:1]. Phoenix’s street grid is sharply visible from orbit because the metropolitan area is laid out on a regular street‑block grid [ref_id:0][ref_id:1], with brightly lit linear corridors like Grand Avenue [ref_id:0][ref_id:1] and concentrated lights from industrial/commercial properties and shopping nodes at intersections [ref_id:0][ref_id:1], while dark areas such as the Phoenix Mountains, agricultural fields, and the Salt River channel increase contrast and make the grid stand out [ref_id:0][ref_id:1]."
        }
      ]
    }
  ],
  "activity": [
    {
      "type": "modelQueryPlanning",
      "id": 0,
      "inputTokens": 1350,
      "outputTokens": 1538,
      "elapsedMs": 20780
    },
    {
      "type": "searchIndex",
      "id": 1,
      "knowledgeSourceName": "earth-knowledge-source",
      "queryTime": "2025-11-05T19:42:09.673Z",
      "count": 0,
      "elapsedMs": 694,
      "searchIndexArguments": {
        "search": "December brightening in satellite night lights: why do suburban belts show larger December brightening than urban cores? causes: snow reflectance, holiday/residential lighting, leaf-off, VIIRS/DMSP sensor saturation",
        "filter": null
      }
    },
    {
      "type": "searchIndex",
      "id": 2,
      "knowledgeSourceName": "earth-knowledge-source",
      "queryTime": "2025-11-05T19:42:09.999Z",
      "count": 2,
      "elapsedMs": 325,
      "searchIndexArguments": {
        "search": "Why is the Phoenix nighttime street grid so sharply visible from space while long stretches of interstate between Midwestern cities remain comparatively dim? factors: streetlight spacing, lighting type/shielding, vegetation/tree cover, land use, VIIRS DNB detection",
        "filter": null
      }
    },
    {
      "type": "agenticReasoning",
      "id": 3,
      "retrievalReasoningEffort": {
        "kind": "low"
      },
      "reasoningTokens": 1566
    },
    {
      "type": "modelAnswerSynthesis",
      "id": 4,
      "inputTokens": 3656,
      "outputTokens": 1909,
      "elapsedMs": 21988
    }
  ],
  "references": [
    {
      "type": "searchIndex",
      "id": "0",
      "activitySource": 2,
      "sourceData": {
        "id": "earth_at_night_508_page_104_verbalized",
        "page_chunk": "<!-- PageHeader=\"Urban Structure\" -->\n\n### Location of Phoenix, Arizona\n\nThe image depicts a globe highlighting the location of Phoenix, Arizona, in the southwestern United States, marked with a blue pinpoint on the map of North America. Phoenix is situated in the central part of Arizona, which is in the southwestern region of the United States.\n\n---\n\n### Grid of City Blocks-Phoenix, Arizona\n\nLike many large urban areas of the central and western United States, the Phoenix metropolitan area is laid out along a regular grid of city blocks and streets. While visible during the day, this grid is most evident at night, when the pattern of street lighting is clearly visible from the low-Earth-orbit vantage point of the ISS.\n\nThis astronaut photograph, taken on March 16, 2013, includes parts of several cities in the metropolitan area, including Phoenix (image right), Glendale (center), and Peoria (left). While the major street grid is oriented north-south, the northwest-southeast oriented Grand Avenue cuts across the three cities at image center. Grand Avenue is a major transportation corridor through the western metropolitan area; the lighting patterns of large industrial and commercial properties are visible along its length. Other brightly lit properties include large shopping centers, strip malls, and gas stations, which tend to be located at the intersections of north-south and east-west trending streets.\n\nThe urban grid encourages growth outwards along a city's borders by providing optimal access to new real estate. Fueled by the adoption of widespread personal automobile use during the twentieth century, the Phoenix metropolitan area today includes 25 other municipalities (many of them largely suburban and residential) linked by a network of surface streets and freeways.\n\nWhile much of the land area highlighted in this image is urbanized, there are several noticeably dark areas. The Phoenix Mountains are largely public parks and recreational land. To the west, agricultural fields provide a sharp contrast to the lit streets of residential developments. The Salt River channel appears as a dark ribbon within the urban grid.\n\n\n<!-- PageFooter=\"Earth at Night\" -->\n<!-- PageNumber=\"88\" -->",
        "page_number": 104
      },
      "rerankerScore": 2.6394622,
      "docKey": "earth_at_night_508_page_104_verbalized"
    },
    {
      "type": "searchIndex",
      "id": "1",
      "activitySource": 2,
      "sourceData": {
        "id": "earth_at_night_508_page_105_verbalized",
        "page_chunk": "# Urban Structure\n\n## March 16, 2013\n\n### Phoenix Metropolitan Area at Night\n\nThis figure presents a nighttime satellite view of the Phoenix metropolitan area, highlighting urban structure and transport corridors. City lights illuminate the layout of several cities and major thoroughfares.\n\n**Labeled Urban Features:**\n\n- **Phoenix:** Central and brightest area in the right-center of the image.\n- **Glendale:** Located to the west of Phoenix, this city is also brightly lit.\n- **Peoria:** Further northwest, this area is labeled and its illuminated grid is seen.\n- **Grand Avenue:** Clearly visible as a diagonal, brightly lit thoroughfare running from Phoenix through Glendale and Peoria.\n- **Salt River Channel:** Identified in the southeast portion, running through illuminated sections.\n- **Phoenix Mountains:** Dark, undeveloped region to the northeast of Phoenix.\n- **Agricultural Fields:** Southwestern corner of the image, grid patterns are visible but with much less illumination, indicating agricultural land use.\n\n**Additional Notes:**\n\n- The overall pattern shows a grid-like urban development typical of western U.S. cities, with scattered bright nodes at major intersections or city centers.\n- There is a clear transition from dense urban development to sparsely populated or agricultural land, particularly evident towards the bottom and left of the image.\n- The illuminated areas follow the existing road and street grids, showcasing the extensive spread of the metropolitan area.\n\n**Figure Description:**  \nA satellite nighttime image captured on March 16, 2013, showing Phoenix and surrounding areas (including Glendale and Peoria). Major landscape and infrastructural features, such as the Phoenix Mountains, Grand Avenue, the Salt River Channel, and agricultural fields, are labeled. The image reveals the extent of urbanization and the characteristic street grid illuminated by city lights.\n\n---\n\nPage 89",
        "page_number": 105
      },
      "rerankerScore": 2.565024,
      "docKey": "earth_at_night_508_page_105_verbalized"
    }
  ]
}
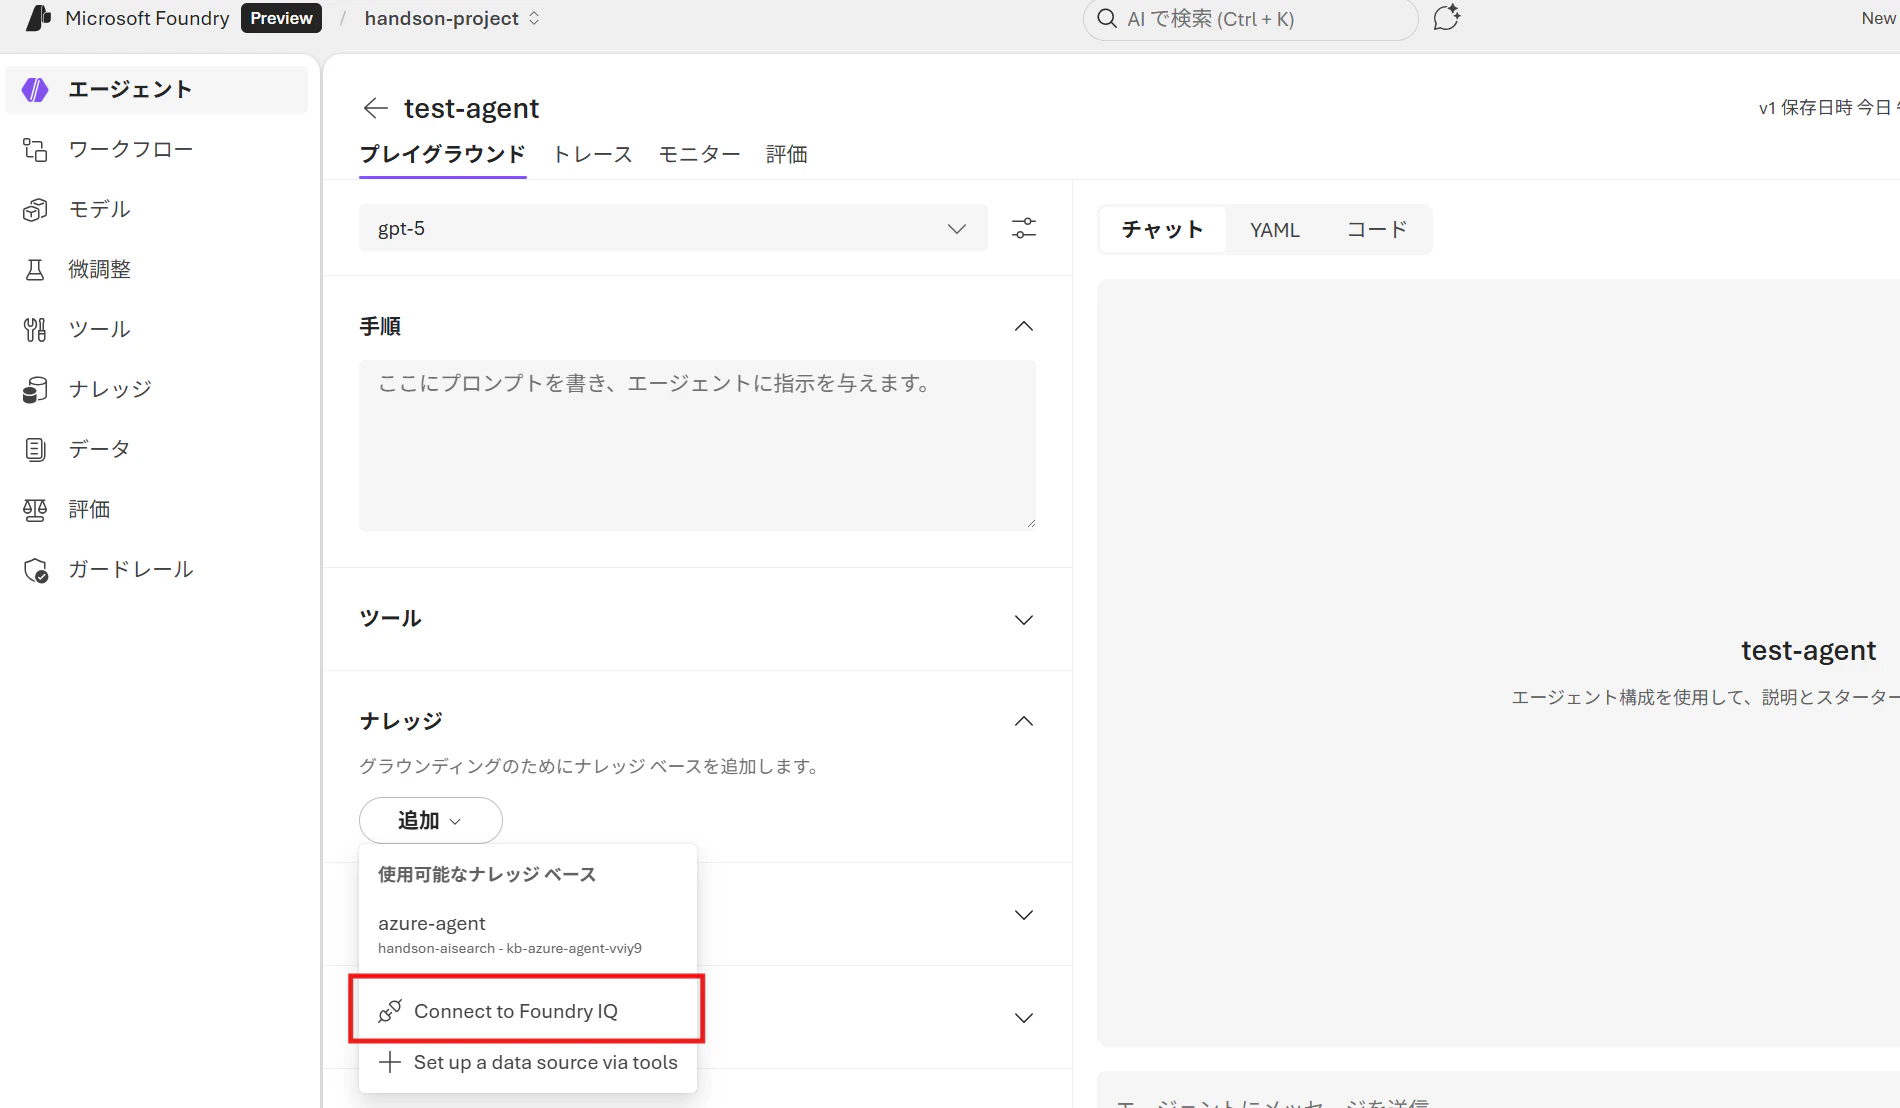
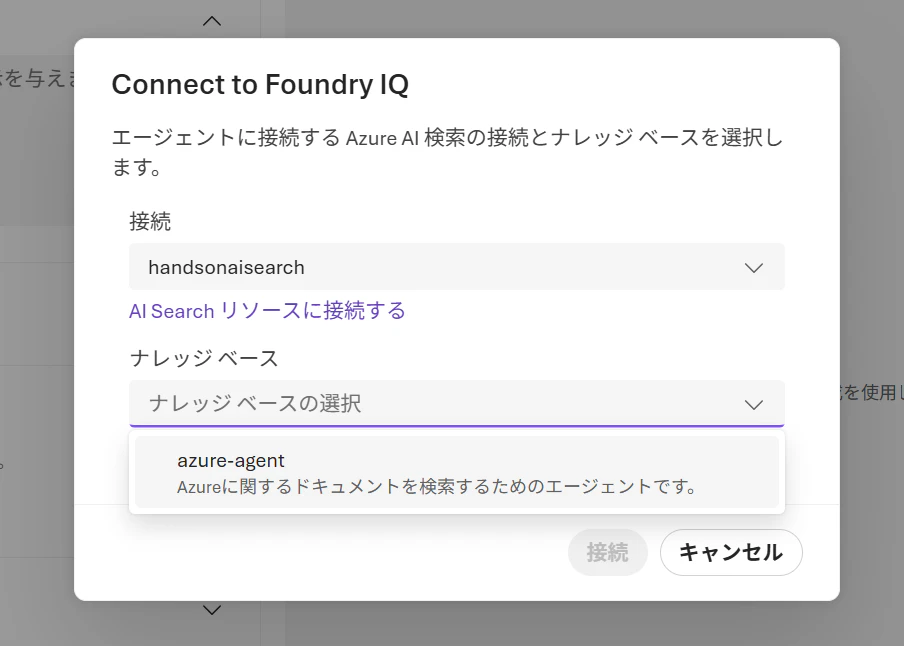
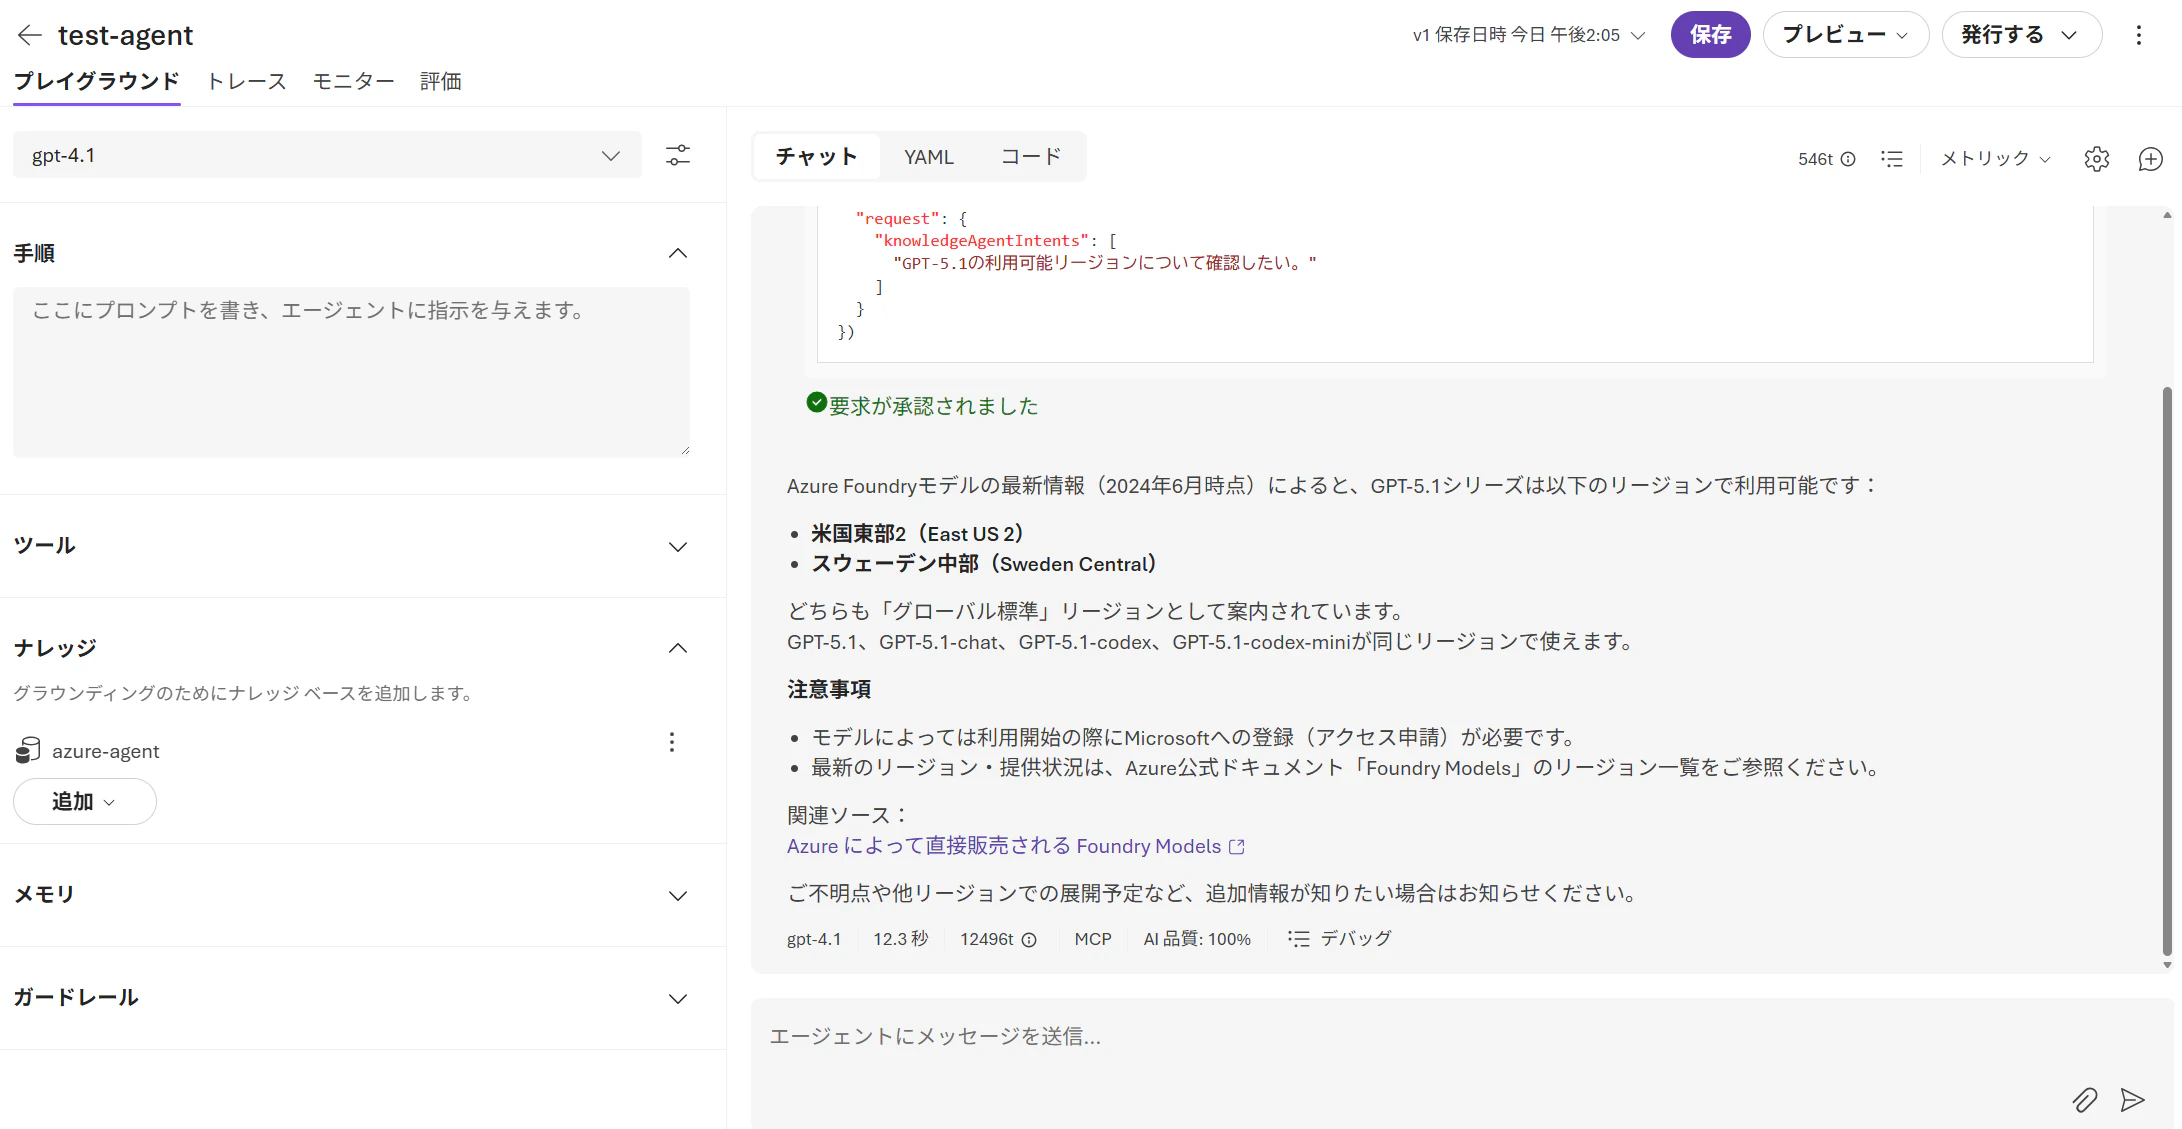
さらに作成したナレッジベースはMicrosoft Foundryのエージェントからも呼び出し可能です。
まとめ
ついにAzure AI SearchとAI Foundry側がシームレスに統合されましたね!
今後の使い分けとしては:
| 用途 | おすすめ |
|---|---|
| 複数のソースに横断的に深く検索したい | ナレッジベース |
| 単一インデックスにシンプルに検索したい | 従来の Search API |
さらに、SharePoint や Web(Grounding with Bing Search)をナレッジソースに追加できるため、利用シーンが一気に広がりそうです。