はじめに
Oracleのグラフネットワーク分析用ツールPGXをJupyterから実行し、
結果をグラフとしてJupyter notebook上に可視化させる。
PGX実行には、Javaのライブラリを呼び出して使う。
そのために、PythonのライブラリのJPypeを利用する。
可視化には、vis.jsを利用する。
Jupyterからvis.jsを実行させる方法について詳細はこちら。
(2019年7月25日修正)
可視化はpyvisがより便利だったのでこちらを利用するように修正。
参考:
https://gianniceresa.com/2017/07/pgx-client-tool-language/
https://blogs.oracle.com/bigdataspatialgraph/using-pgql-in-python
本内容のNotebookはこちら。
実行環境
CentOS
openJDK 8
python 3.6.6
Jupyter notebook 4.3.0
Oracle PGX 19.1.0
- Server (suitable for standalone use)
- Java client
JPype 0.6.3
pyvis 0.1.6.0
準備
インストール
-
PGX
Oracle PGX server と Java client をインストール -
Python ライブラリ
JPype をインストール -
pyvis
pyvis をインストール 詳細はこちら。
PGX パラメータ変更
- グラフデータをローカルファイルから読み込むために以下のパラメータを変更
$ vi $PGX_HOME/conf/pgx.conf
"allow_local_filesystem":true
- PGXをサーバーモードで起動するために、以下のパラメータを変更
$ vi $PGX_HOME/conf/server.conf
{
  "port": 7007,
  "context_path": "/",
  "working_dir": "<system-tmp-dir>",
  "enable_tls": false,
  "enable_client_authentication": false
}
PGX サーバーモードで起動
$ $PGX_HOME/bin/start-server
データ
データはローカルファイルからデータを読み込み(Flat File フォーマット)
実行
Jupyter notebookから以下の内容を実行
* 便利のためにglobも利用しているので必要に応じてインストール
JVM起動、PGXセッション作成
from jpype import *
import glob

# set a class path
filenames = glob.glob('/home/miotakei/Applications/pgx-19.1.0/lib/*')
pgx_jar_classpath = ':'.join(filenames)

# start JVM
startJVM(getDefaultJVMPath(), "-ea", "-Djava.class.path=" + pgx_jar_classpath )

pgxClass = JClass('oracle.pgx.api.Pgx')

# create a session on a PGX server
session = pgxClass.createSession('http://localhost:7007', 'session1')
グラフデータ読み込み、分析、可視化用データ作成
# read Graph
graph = session.readGraphWithProperties("<path of json file>")

# analysis
analyst = session.createAnalyst()
dc = analyst.degreeCentrality(graph)

# check vertex name
# print(graph.getVertexProperties())

# get result
# node data
pgxResultSetNode = graph.queryPgql("""
  SELECT id(n), n.name, n.prob, e.times
  MATCH (n)
       ,(x)-[e]->(y)
  WHERE ((n) = (x) OR (n) = (y))
  AND e.times >= 100
""")

it_node = pgxResultSetNode.getResults().iterator()
node_size = []
node_label =[]
node_value = []
for i in it_node:
    size = i.get(0)
    if size not in node_size:
        node_size.append(size)
        node_label.append(i.get(1))
        node_value.append(i.get(2))

# edge data

pgxResultSetEdge = graph.queryPgql("""
  SELECT id(x), id(y), e.times/30
  MATCH (x)-[e]->(y)
  WHERE e.times >= 100
""")

it_edge = pgxResultSetEdge.getResults().iterator()
edge_list = []
for i in it_edge:
    edge_tuple = (i.get(0), i.get(1), i.get(2))
    edge_list.append(edge_tuble)

# print iteration data
'''
while (it.hasNext()):
    element = it.next();
    print(element.toString())
'''
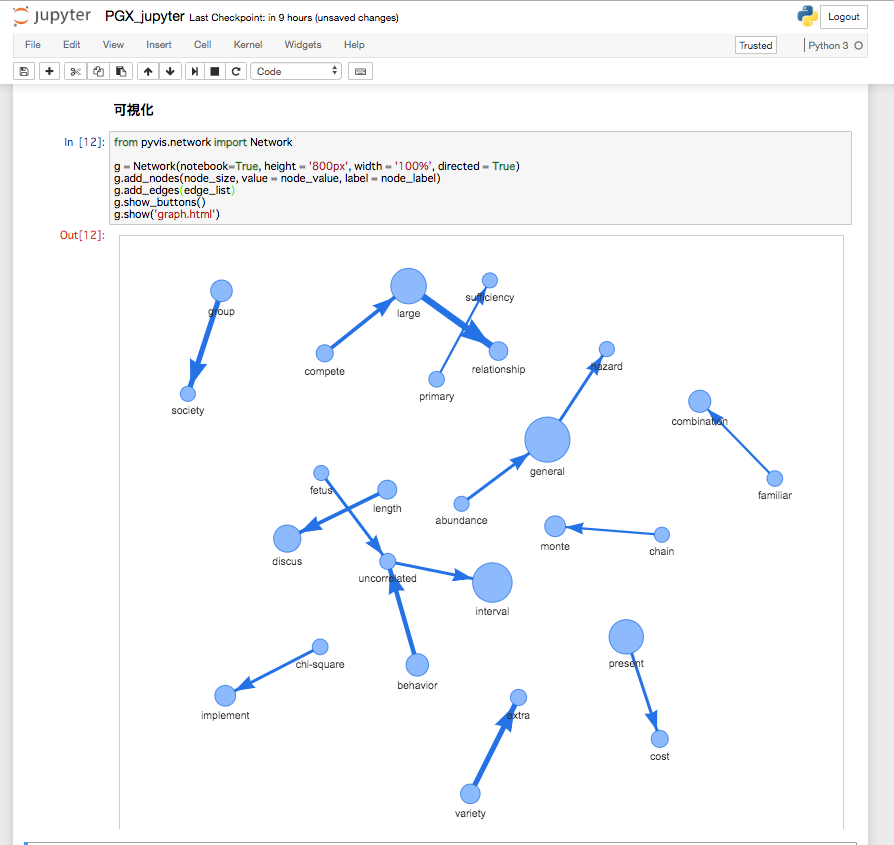
可視化
# make
from pyvis.network import Network
g = Network(notebook=True, height = '800px', width = '100%', directed = True)
g.add_nodes(node_size, value = node_value, label = node_label)
g.add_edges(edge_list)
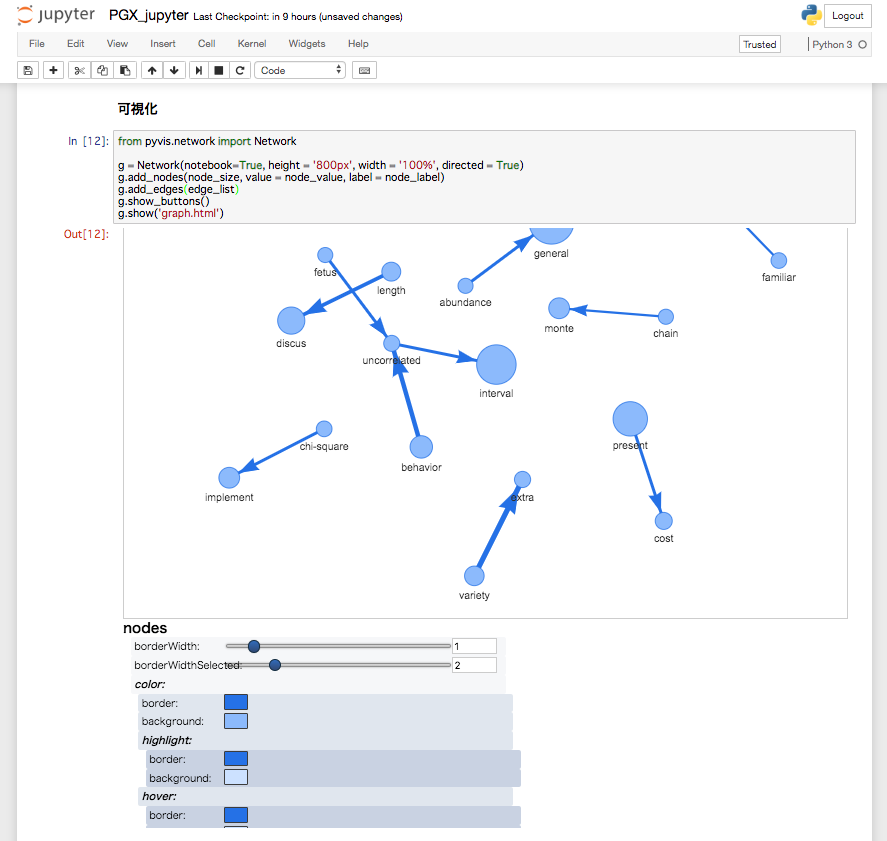
g.show_buttons()
g.show('graph.html')
結果
g.show_buttons()を設定しているため描画されているセルのスクロールを下げると表示をカスタマイズできるUIが表示されている。
詳細はこちら
その他
実行後はシャットダウン
# shutdownJVM()
shutdownJVM()
Jupyter notebookの横幅を広げたい時
%%HTML
<style>
    div#notebook-container    { width: 95%; }
    div#menubar-container     { width: 65%; }
    div#maintoolbar-container { width: 99%; }
</style>