はじめに
グラフを用いて分析した結果をすぐに確認するために、
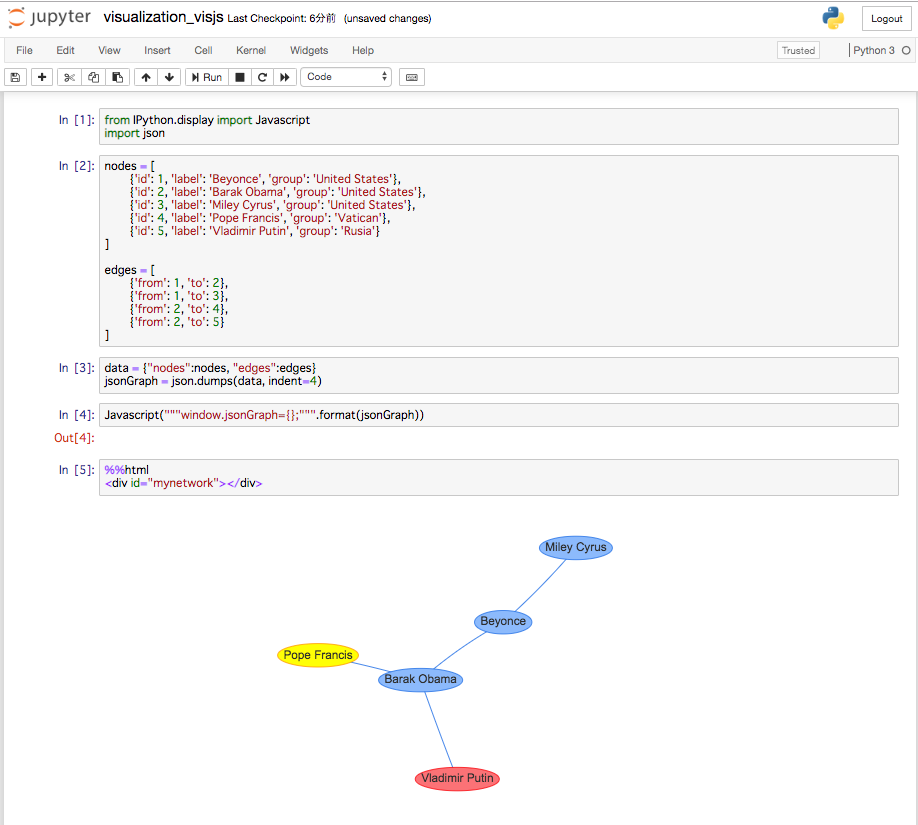
Jupyter notebook 上で vis.js を使ってグラフを描画したい。
以下サイトに設定方法が載っていたのでやってみた。
参考:https://www.codementor.io/isaib.cicourel/visjs-visualization-in-jupyter-notebook-phgb3fjv0
本内容のNotebookはこちら。
実行環境
mac OS
Jupyter notebook 4.4.0
Python 3.6.6
vis.js 4.21.0
--
準備
- vis.js をダウンロード
vis.js をダウンロードして、適当な場所でunzip
- Jupyter notebook のconfig ファイルの変更
./jupyter/jupyter_notebook_config.py にvis.js のパスを設定
## Extra paths to search for serving static files.
#
#  This allows adding javascript/css to be available from the notebook server
#  machine, or overriding individual files in the IPython

c.NotebookApp.extra_static_paths = ['/Users/miotakei/Applications/vis-4.21.0/dist']
** ./jupyter/jupyter_notebook_config.py がない場合は以下コマンドを実行
$ jupyter notebook --generate-config
- Jupyter notebook を起動
実行
グラフのデータを作成し、JSON 形式に変更後Javascript を生成
from IPython.display import Javascript
import json

nodes = [
        {'id': 1, 'label': 'Beyonce', 'group': 'United States'},
        {'id': 2, 'label': 'Barak Obama', 'group': 'United States'},
        {'id': 3, 'label': 'Miley Cyrus', 'group': 'United States'},
        {'id': 4, 'label': 'Pope Francis', 'group': 'Vatican'},
        {'id': 5, 'label': 'Vladimir Putin', 'group': 'Rusia'}
]

edges = [
        {'from': 1, 'to': 2},
        {'from': 1, 'to': 3},
        {'from': 2, 'to': 4},
        {'from': 2, 'to': 5}
]

# Transform the graph into a JSON graph
data = {"nodes":nodes, "edges":edges}
jsonGraph = json.dumps(data, indent=4)

# Send to Javascript
Javascript("""window.jsonGraph={};""".format(jsonGraph))
HTMLを作成
%%html
<div id="mynetwork"></div>
先ほど作成した、グラフデータの変数を受け取るようなJavascript のコードを作成
%%javascript
requirejs.config({
    paths: {
        vis: 'vis'
    }
});

require(['vis'], function(vis){

    // create a network
    var container = document.getElementById('mynetwork');
    var options = {
        width: '800px',
        height: '400px'
    };

    // We load the JSON graph we generated from input
    var graph = window.jsonGraph;

    // Display Graph
    var network = new vis.Network(container, graph, options);
});
結果