1
4

Delete article

Deleted articles cannot be recovered.

Draft of this article would be also deleted.

Are you sure you want to delete this article?

More than 3 years have passed since last update.

Power BI Desktop で欠損がある時系列データの折れ線グラフを連続にする

Last updated at Posted at 2021-01-04

はじめに

Power BI Desktop で時系列データを折れ線グラフにした場合、データに欠損があると折れ線グラフも途切れます。
データが無かった場合、値を 0 として折れ線グラフを連続的に描画してみます。

つまり、こんなデータが
image.png

こうなるのを
image.png

こうしたい。
image.png

データの無い項目の表示

そもそも初期状態ではデータが無ければ表示されません。上記の例の場合、このように4月, 5月を除いたグラフが生成されます。
image.png

この場合、「視覚化」タブの「軸」から「データのない項目を表示する」をチェックする事で表示できます。
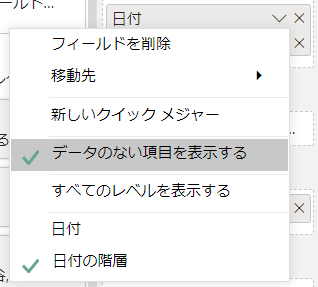
image.png

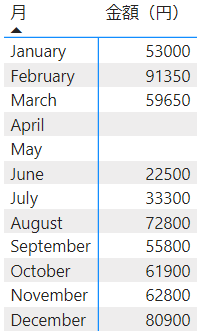
ただし、値が null となるので、この場合数値の 0 に変換する必要があります。

メジャーの追加

新しいメジャーを作成し、以下のように DAX を記述します。
既存のカラム「金額」を集計した結果に 0 を加算しています。ここは こちらの記事 を参考にさせていただきました。

合計金額 = 
CALCULATE(
  SUM('Data'[金額])
) + 0

これにより、データが無い場合は 0 を値として持つようになります。
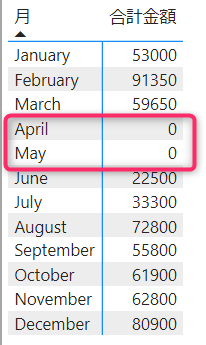
image.png

グラフも連続的になりました!
image.png

おわりに

Power BI Desktop でデータの無い項目の値を 0 として折れ線グラフを連続的に描画しました。今回は参考記事そのままに「0 を加算する」やり方で簡単に実現できました。

Power BI は初めて使いましたが、DAX を使いこなす事が出来れば色々出来て面白そうですね。
参考

1
4
0

Register as a new user and use Qiita more conveniently

  1. You get articles that match your needs
  2. You can efficiently read back useful information
  3. You can use dark theme
What you can do with signing up
1
4

Delete article

Deleted articles cannot be recovered.

Draft of this article would be also deleted.

Are you sure you want to delete this article?