概要
最近この夏が暑すぎて気象データについて色々と分析されているので(「今年の夏は暑い 解析」とかでまあまあヒットします)、私も自分なりに分析してみました。統計については今勉強途中です。
参考記事
あまりに暑いので,140年分の気温をProphetで分析した
東京の夏が「昔より断然暑い」決定的な裏づけ
ただpandas,matplotlib,sklearnを使ってみたかっただけですが、、、、
データセット
データは気象庁のサイトにある年ごとの値を取ってきました。1ページのみだったのでコピペでCSVファイルに書き込みました。
過去の気象データ>年ごとの値
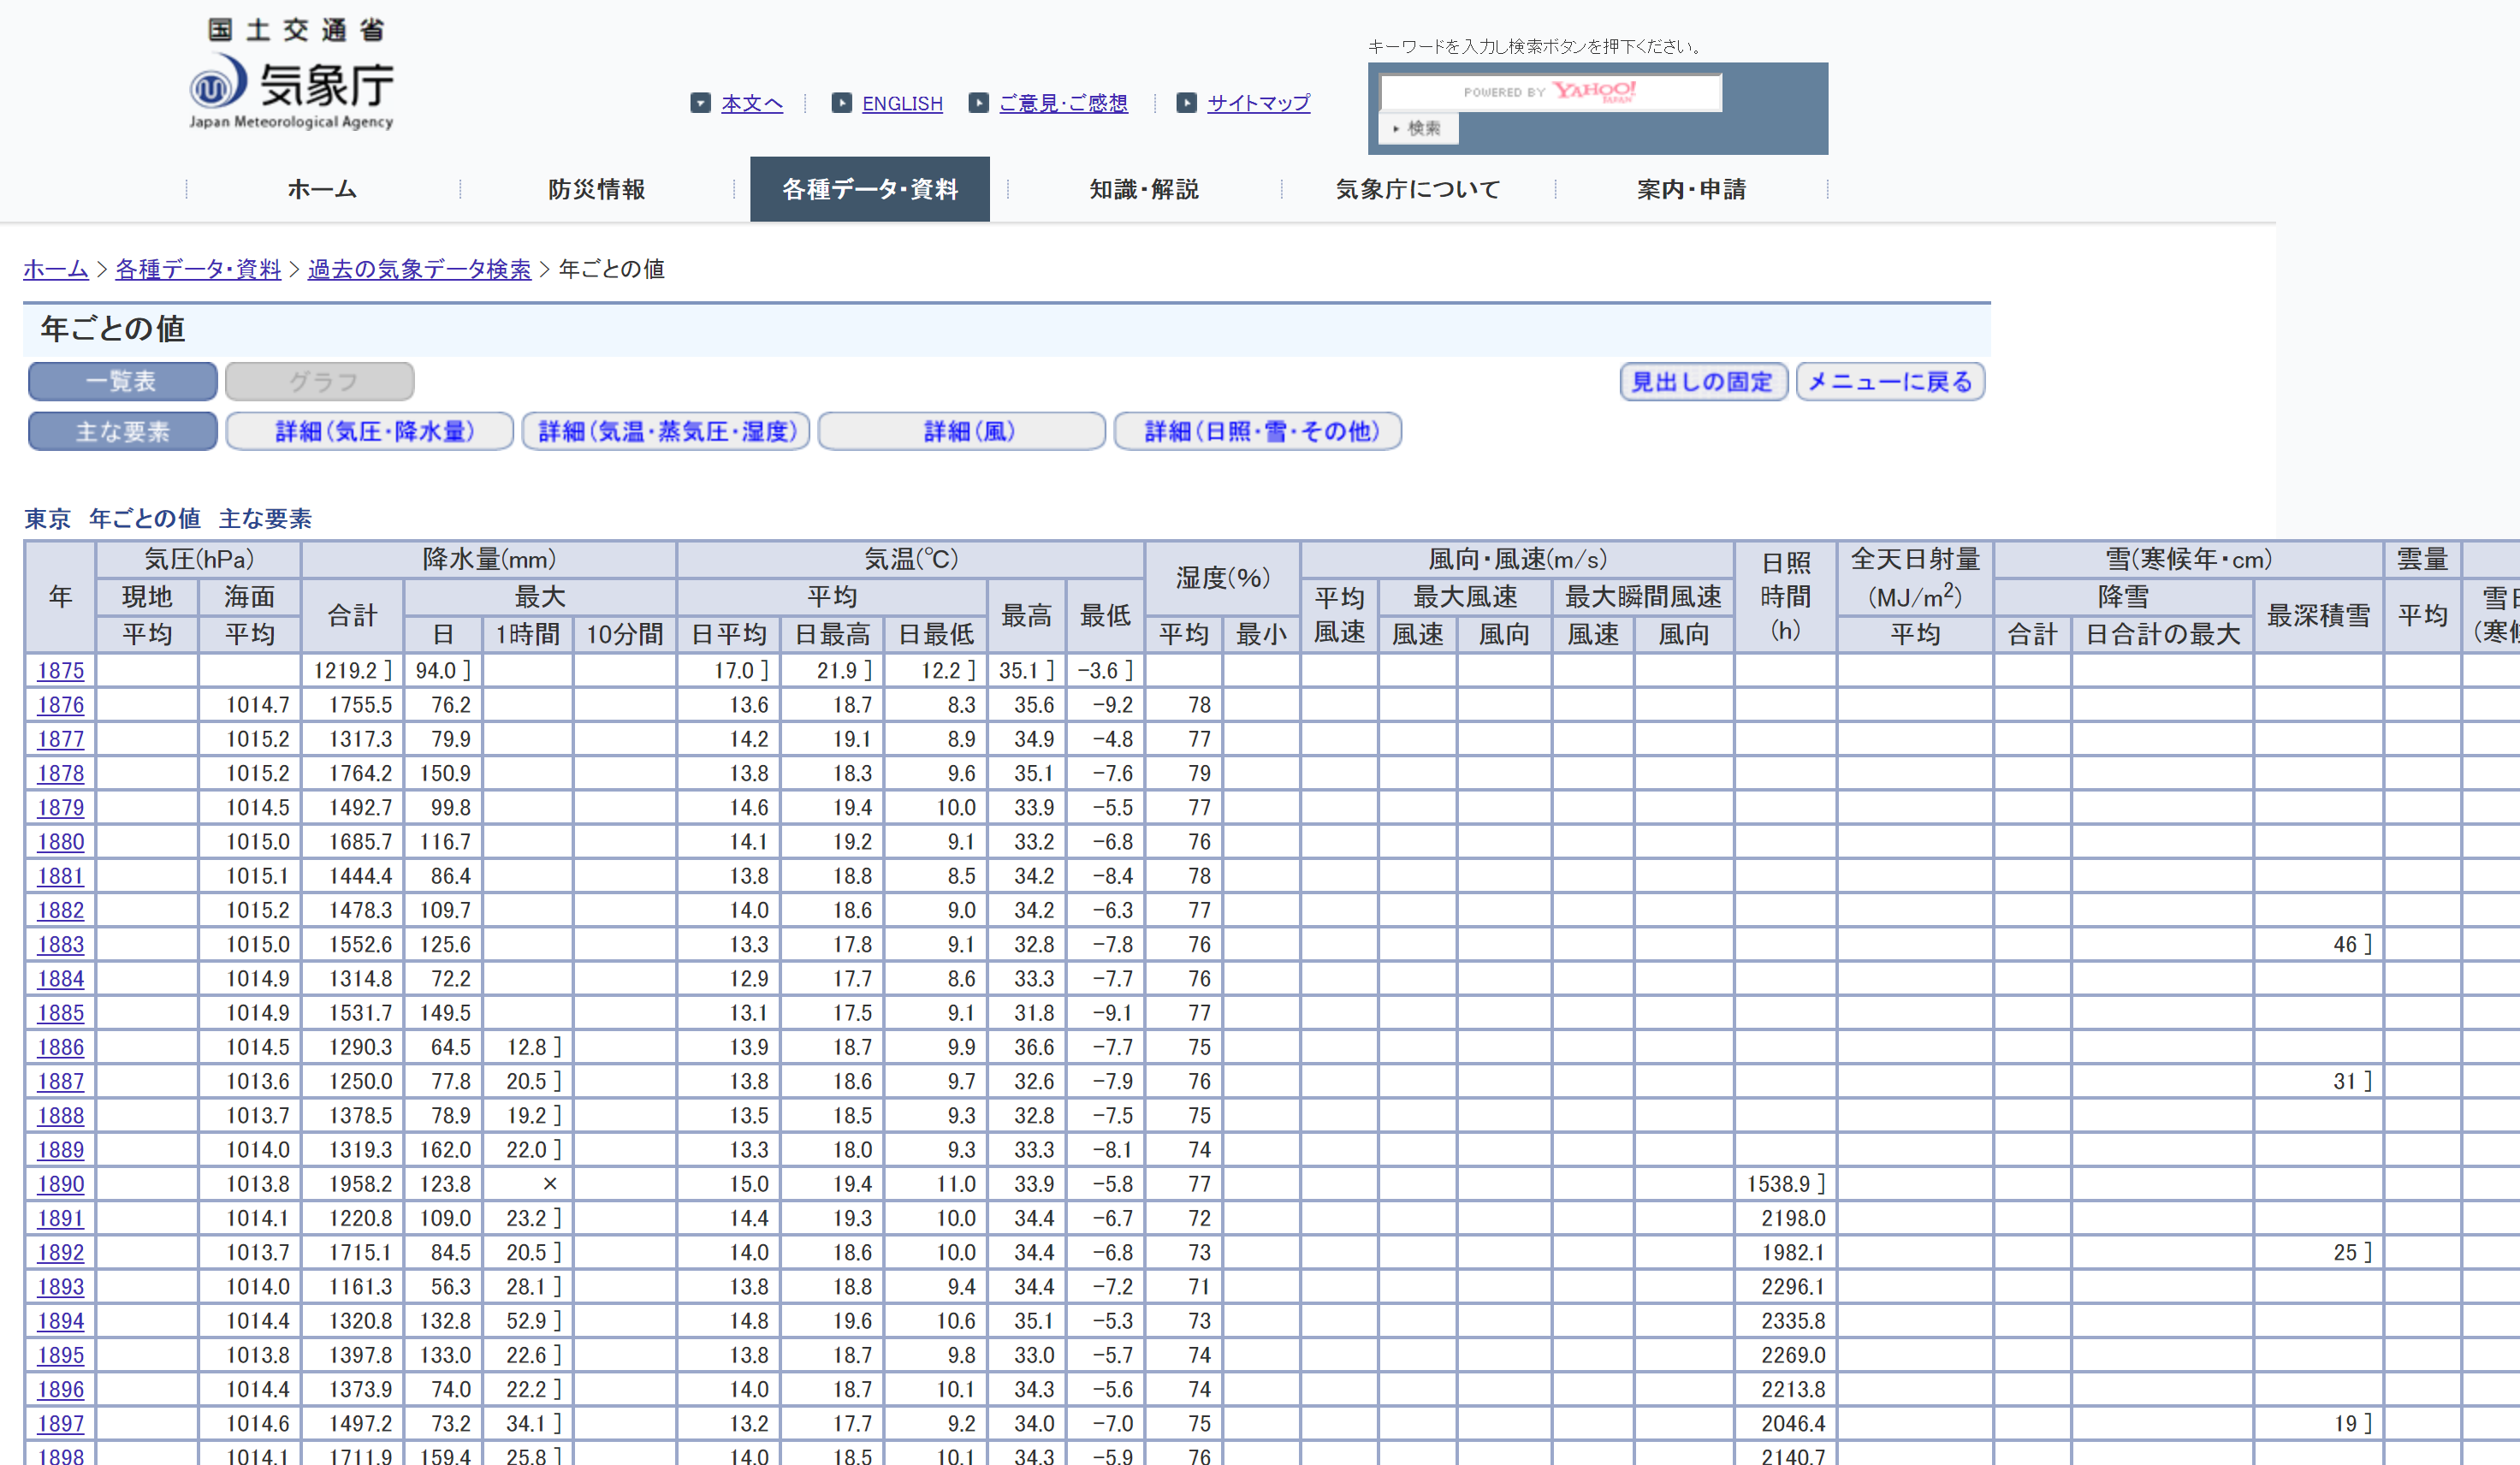
とってきた変数は以下の通りです。
- year: 年
- pressure : 気圧平均
- rain-sum: 年合計降水量
- rain-max: 日最大降水量
- temp-mean: 日平均気温の平均
- maxtemp-mean: 日最高気温の平均
- mintemp-mean: 日最低気温の平均
- temp-max : 年最高気温
- temp-min: 年最低気温
- humidity: 湿度平均
分析
ここからものすごく簡単に分析していきます。
実行環境はJuyter Notebookを使っています。
コード読んだだけでわかるようにするためにコメント多数入れています。
# モジュールのインポート
import pandas as pd
import numpy as np
import matplotlib.pyplot as plt
import seaborn as sns
# グラフ表示させるためのおまじない
%matplotlib inline

# データの読み込み
data = pd.read_csv('data.csv')
data.info()
RangeIndex: 144 entries, 0 to 143
Data columns (total 10 columns):
year 144 non-null int64
pressure 143 non-null float64
rain-sum 144 non-null float64
rain-max 144 non-null float64
temp-mean 144 non-null float64
maxtemp-mean 144 non-null float64
mintemp-mean 144 non-null float64
temp-max 144 non-null float64
temp-min 144 non-null float64
humidity 143 non-null float64
dtypes: float64(9), int64(1)
memory usage: 11.3 KB
欠損値があるので省いていきます。また2018年も7月までのデータが載っていたのですが、まだ年の途中ということから除きました。
data = data.dropna() #欠損値がある行を削除
data = data[data['year'] != 2018]
data.info()
Int64Index: 142 entries, 1 to 142
Data columns (total 10 columns):
year 142 non-null int64
pressure 142 non-null float64
rain-sum 142 non-null float64
rain-max 142 non-null float64
temp-mean 142 non-null float64
maxtemp-mean 142 non-null float64
mintemp-mean 142 non-null float64
temp-max 142 non-null float64
temp-min 142 non-null float64
humidity 142 non-null float64
dtypes: float64(9), int64(1)
memory usage: 12.2 KB
グラフを書いていきます
fig = plt.figure(figsize=(15, 12))
plt.plot(data['year'],data['maxtemp-mean'],c='r',label='max temp')
plt.plot(data['year'],data['temp-mean'],c='g',label='mean temp')
plt.plot(data['year'],data['mintemp-mean'],c='b',label='min temp')
plt.legend(loc='best') #ラベルを最適な位置に配置
plt.show()
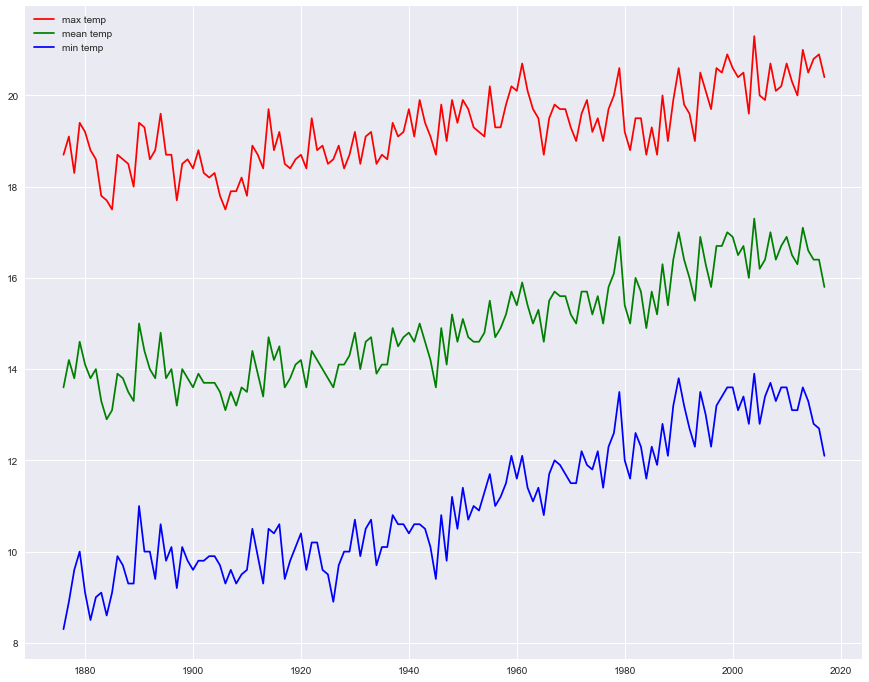
これをみても年々気温が上がっているのがわかりますね。
視覚的だけでなく、数値的にも上がっていることを見たいので線形回帰してみたいと思います。
とその前に周期的な特徴を少なくするためにそれぞれの変数ごとに移動平均を取りたいと思います。
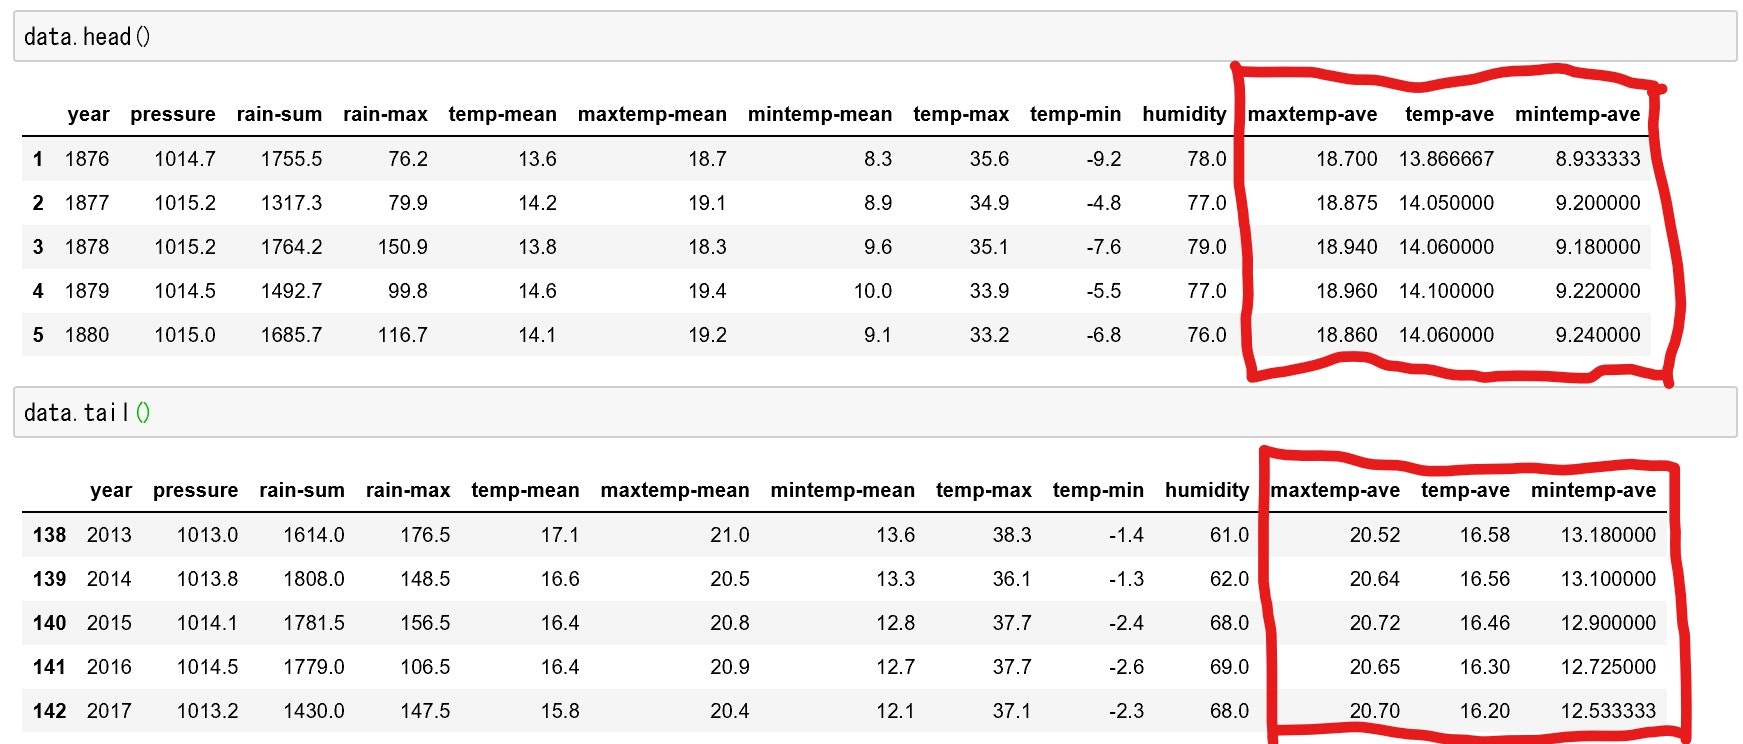
data['maxtemp-ave'] = data['maxtemp-mean'].rolling(window=5,min_periods=1,center=True).mean()
data['temp-ave'] = data['temp-mean'].rolling(window=5,min_periods=1,center=True).mean()
data['mintemp-ave'] = data['mintemp-mean'].rolling(window=5,min_periods=1,center=True).mean()
pandasでの移動平均の取り方は以下を参考にしました。
Pandas: DataFrame.rolling()のごく簡単な例
うまく移動平均が取れていることがわかります。
ここでこれらの移動平均を線形回帰してみます。
from sklearn.linear_model import LinearRegression

# 最高気温
X = data.loc[:,['year']].as_matrix()
Y = data['maxtemp-ave'].as_matrix()
clf = LinearRegression()
clf.fit(X,Y)

# 回帰係数と切片の抽出
a1 = clf.coef_
b1 = clf.intercept_
# 回帰係数
print('最高気温')
print("回帰係数:", a1)
print("切片:", b1)
print("決定係数:", clf.score(X, Y))
print('\n')

# 平均気温
Y = data['temp-ave'].as_matrix()
clf = LinearRegression()
clf.fit(X,Y)

# 回帰係数と切片の抽出
a2 = clf.coef_
b2 = clf.intercept_
# 回帰係数
print('平均気温')
print("回帰係数:", a2)
print("切片:", b2)
print("決定係数:", clf.score(X, Y))
print('\n')

# 最低気温
Y = data['mintemp-ave'].as_matrix()
clf = LinearRegression()
clf.fit(X,Y)

# 回帰係数と切片の抽出
a3 = clf.coef_
b3 = clf.intercept_
# 回帰係数
print('最低気温')
print("回帰係数:", a3)
print("切片:", b3)
print("決定係数:", clf.score(X, Y))

# 線形回帰直線の定義
def maxtemp(x):
    return a1*x + b1

def meantemp(x):
    return a2*x + b2

def mintemp(x):
    return a3*x + b3
最高気温
回帰係数: [0.01539812]
切片: -10.696915344170439
決定係数: 0.7776057261812741
平均気温
回帰係数: [0.02410148]
切片: -32.00426120079095
決定係数: 0.9040503946647872
最低気温
回帰係数: [0.03258983]
切片: -52.367154539097854
決定係数: 0.9243975151086714
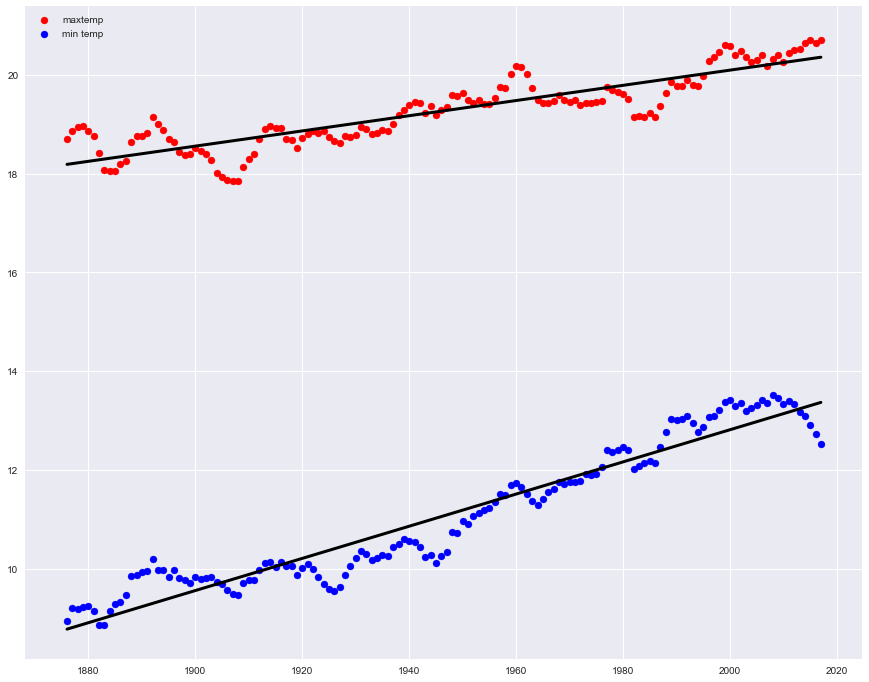
回帰係数が正ということで確かに日本が暑くなっていることがわかりますね。平均気温でいうと100年で約2.4℃あがるということですね。
ここで最低気温の回帰係数が最高気温の回帰係数の2倍であり、日本は暑くなったというより、むしろ寒くなくなっているのもしっかりと確認できます。
グラフを描いてみると明らかです。
fig = plt.figure(figsize=(15, 12))
plt.plot(X,maxtemp(X),c='black',lw=3)
plt.plot(X,mintemp(X),c='black',lw=3)
plt.scatter(data['year'],data['maxtemp-ave'],c='r')
plt.scatter(data['year'],data['mintemp-ave'],c='b')
plt.show()
まとめ
今回やりつくされた分析をやりましたが、pandas,matplotlib,sklearnのいい練習にはなりました。
今後は「kaggle」でデータ解析の知識をつけていければなと思います。
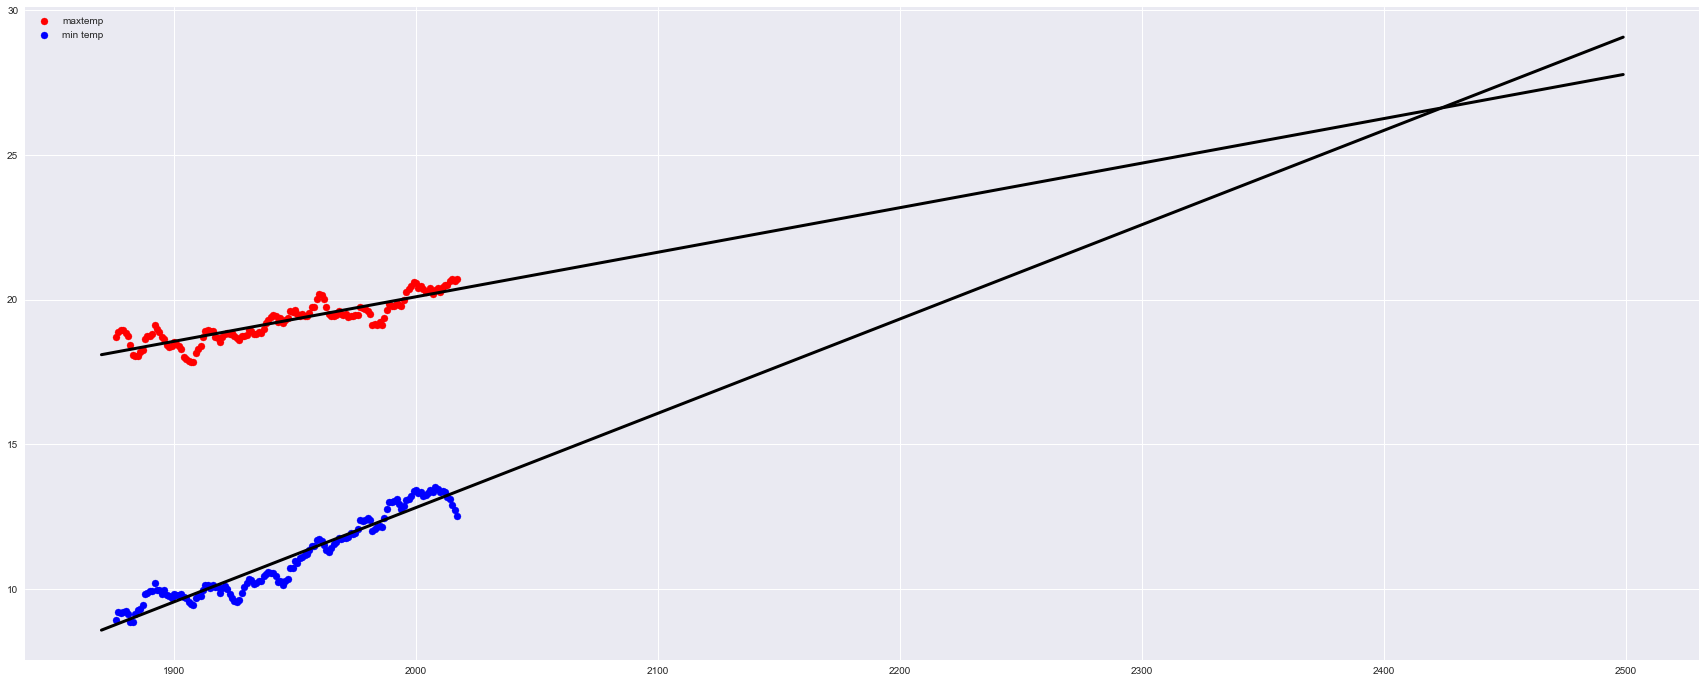
2430年ごろに最低気温と最高気温が逆転しますね。
はい。ふざけました。
※記事の改善、アドバイスなどございましたらご指摘いただけると幸いです。
