はじめに
この記事は EKS Fargate環境でContainer Insightsを有効にする手順についての備忘録です。
Amazon EKS Fargate環境でContainer Insightsを有効にすることで、Podレベルのメトリクス監視が可能になります。
ドキュメントで手順を確認すると、AWS Distro for OpenTelemetry (ADOT) コレクターを導入し利用する方法は出てきますが、EKS の ADOT Addon を利用する方法は記載がありません。また、生成AIに質問すると、EKS Fargate で ADOT Addon を利用し、Container Insights を有効にできないと出てきます。
しかし、ADOT Addon 自体は Fargate も利用できることが書かれており、ADOT Addon で立ち上がる ADOT コレクターを設定すれば Container Insights を利用できると考え試しました。
というわけで、本記事では、AWS Distro for OpenTelemetry (ADOT) Addonを使用して、EKS FargateでContainer Insightsを0から構築する手順を詳しく解説します。
前提条件
本記事の手順を実行するために、以下の環境が必要です:
- AWS CLI v2がインストール・設定済み
- kubectl がインストール・設定済み
- eksctl がインストール・設定済み
- 適切なIAM権限(EKS、CloudWatch、IAM、EC2の操作権限)
Step 0: 環境変数の設定
まず、作業全体で使用する環境変数を設定します:
# 以下の値を実際の環境に合わせて設定してください
export CLUSTER_NAME="sample-cluster"
export AWS_REGION="us-east-1"
export AWS_ACCOUNT_ID=$(aws sts get-caller-identity --query Account --output text)

# Fargate Pod Execution Role ARN(後で作成します)
export FARGATE_POD_EXECUTION_ROLE_ARN="arn:aws:iam::${AWS_ACCOUNT_ID}:role/eks-fargate-pod-execution-role"

echo "設定された環境変数:"
echo "CLUSTER_NAME: $CLUSTER_NAME"
echo "AWS_REGION: $AWS_REGION"
echo "AWS_ACCOUNT_ID: $AWS_ACCOUNT_ID"
echo "FARGATE_POD_EXECUTION_ROLE_ARN: $FARGATE_POD_EXECUTION_ROLE_ARN"
Step 1: EKSクラスターとFargate Pod Execution Roleの作成
1.1 Fargate Pod Execution Roleの作成
# Fargate Pod Execution Role用の信頼ポリシー作成
cat << EOF > fargate-pod-execution-role-trust-policy.json
{
  "Version": "2012-10-17",
  "Statement": [
    {
      "Effect": "Allow",
      "Condition": {
         "ArnLike": {
            "aws:SourceArn": "arn:aws:eks:${AWS_REGION}:${AWS_ACCOUNT_ID}:fargateprofile/${CLUSTER_NAME}/*"
         }
      },
      "Principal": {
        "Service": "eks-fargate-pods.amazonaws.com"
      },
      "Action": "sts:AssumeRole"
    }
  ]
}
EOF

# Fargate Pod Execution Roleを作成
aws iam create-role \
  --role-name eks-fargate-pod-execution-role \
  --assume-role-policy-document file://fargate-pod-execution-role-trust-policy.json

# 必要なポリシーをアタッチ
aws iam attach-role-policy \
  --role-name eks-fargate-pod-execution-role \
  --policy-arn arn:aws:iam::aws:policy/AmazonEKSFargatePodExecutionRolePolicy

# ロール作成の確認
aws iam get-role --role-name eks-fargate-pod-execution-role
1.2 EKSクラスターの作成
# EKSクラスター作成(Fargateプロファイル付き)
eksctl create cluster \
  --name $CLUSTER_NAME \
  --region $AWS_REGION \
  --fargate

# クラスター作成の確認
kubectl get nodes
aws eks describe-cluster --name $CLUSTER_NAME --region $AWS_REGION --query 'cluster.status'
Step 2: cert-managerアドオンのインストール
ADOT Addonの前提条件として、cert-managerコミュニティアドオンをインストールします。
2.1 cert-managerアドオンのインストール
# cert-managerコミュニティアドオンをインストール
aws eks create-addon \
  --cluster-name $CLUSTER_NAME \
  --addon-name cert-manager \
  --addon-version v1.18.2-eksbuild.2 \
  --region $AWS_REGION

# インストール状況の確認
aws eks describe-addon --cluster-name $CLUSTER_NAME --addon-name cert-manager --region $AWS_REGION --query 'addon.status'
2.2 cert-manager用Fargateプロファイルの作成
# cert-manager用Fargateプロファイルを作成
aws eks create-fargate-profile \
  --cluster-name $CLUSTER_NAME \
  --fargate-profile-name cert-manager \
  --pod-execution-role-arn $FARGATE_POD_EXECUTION_ROLE_ARN \
  --selectors namespace=cert-manager \
  --region $AWS_REGION

# Fargateプロファイル作成の確認
aws eks describe-fargate-profile \
  --cluster-name $CLUSTER_NAME \
  --fargate-profile-name cert-manager \
  --region $AWS_REGION \
  --query 'fargateProfile.status'
2.3 cert-managerの動作確認
# cert-managerのPod状態を確認
kubectl get pods -n cert-manager

# 全てのPodがRunning状態になるまで待機(最大5分)
kubectl wait --for=condition=Ready pod --all -n cert-manager --timeout=300s

# 成功確認
if [ $? -eq 0 ]; then
  echo "✅ cert-manager正常に起動しました"
else
  echo "❌ cert-managerの起動に失敗しました。ログを確認してください:"
  kubectl get events -n cert-manager --sort-by='.lastTimestamp'
fi
Step 3: ADOT Addonのインストール
3.1 ADOT Addonのインストール
# 利用可能なADOTアドオンバージョンを確認
ADOT_VERSION=$(aws eks describe-addon-versions --addon-name adot --region $AWS_REGION --query 'addons[0].addonVersions[0].addonVersion' --output text)
echo "利用可能なADOTバージョン: $ADOT_VERSION"

# ADOTアドオンをインストール
aws eks create-addon \
  --cluster-name $CLUSTER_NAME \
  --addon-name adot \
  --addon-version $ADOT_VERSION \
  --region $AWS_REGION

# インストール状況の確認
aws eks describe-addon --cluster-name $CLUSTER_NAME --addon-name adot --region $AWS_REGION --query 'addon.status'
3.2 ADOT用Fargateプロファイルの作成
# ADOT用Fargateプロファイルを作成
aws eks create-fargate-profile \
  --cluster-name $CLUSTER_NAME \
  --fargate-profile-name adot-profile \
  --pod-execution-role-arn $FARGATE_POD_EXECUTION_ROLE_ARN \
  --selectors namespace=opentelemetry-operator-system \
  --region $AWS_REGION

# Fargateプロファイル作成の確認
aws eks describe-fargate-profile \
  --cluster-name $CLUSTER_NAME \
  --fargate-profile-name adot-profile \
  --region $AWS_REGION \
  --query 'fargateProfile.status'
3.3 ADOT Addonの動作確認
# OpenTelemetry Operatorの確認
kubectl get pods -n opentelemetry-operator-system

# OpenTelemetry Operatorが起動するまで待機(最大5分)
kubectl wait --for=condition=Ready pod --all -n opentelemetry-operator-system --timeout=300s

# 成功確認
if [ $? -eq 0 ]; then
  echo "✅ ADOT Addon正常に起動しました"
  kubectl get pods -n opentelemetry-operator-system
else
  echo "❌ ADOT Addonの起動に失敗しました。ログを確認してください:"
  kubectl get events -n opentelemetry-operator-system --sort-by='.lastTimestamp'
fi
アーキテクチャ概要
EKS FargateでContainer Insightsを実現するアーキテクチャは以下の通りです:
┌─────────────────┐    ┌──────────────────┐    ┌─────────────────┐
│   EKS Fargate   │    │   ADOT Addon     │    │  CloudWatch     │
│                 │    │                  │    │                 │
│  ┌───────────┐  │    │ ┌──────────────┐ │    │ ┌─────────────┐ │
│  │Application│  │───▶│ │OpenTelemetry │ │───▶│ │Container    │ │
│  │   Pods    │  │    │ │  Collector   │ │    │ │ Insights    │ │
│  └───────────┘  │    │ └──────────────┘ │    │ └─────────────┘ │
│                 │    │                  │    │                 │
└─────────────────┘    └──────────────────┘    └─────────────────┘
ADOT Collectorは以下の流れでメトリクスを収集・送信します:
- Prometheus ReceiverがKubernetes API Server経由でkubeletのcAdvisorメトリクスを収集
- メトリクス処理パイプラインでContainer Insights形式に変換
- CloudWatch EMF ExporterでCloudWatch Logsに送信
- CloudWatchが自動的にメトリクスを生成してContainer Insightsダッシュボードに表示
重要なポイント
EKS FargateでのContainer Insightsの制約
-
ノードレベルメトリクス: Fargateでは
cluster_node_count等のノードレベルメトリクスは収集できません -
Podレベルメトリクス:
pod_cpu_utilization,pod_memory_utilization等のPodレベルメトリクスは収集可能 - ダッシュボード表示: Container Insightsの「Pods performance and status」セクションが表示されます
ADOT Addonの利点
- EKSによる管理: バージョン管理と更新の自動化
- Kubernetesネイティブ: OpenTelemetryCollector CRDによる宣言的設定
- 統合管理: EKSコンソールでの一元管理
- 自動ライフサイクル: Operatorによる自動Pod管理
Step 4: Container Insights用の設定
4.1 Namespace作成とFargateプロファイル設定
# Container Insights用namespace作成
kubectl create namespace fargate-container-insights

# Container Insights用Fargateプロファイル作成
aws eks create-fargate-profile \
  --cluster-name $CLUSTER_NAME \
  --fargate-profile-name fargate-container-insights \
  --pod-execution-role-arn $FARGATE_POD_EXECUTION_ROLE_ARN \
  --selectors namespace=fargate-container-insights \
  --region $AWS_REGION

# Fargateプロファイル作成の確認
aws eks describe-fargate-profile \
  --cluster-name $CLUSTER_NAME \
  --fargate-profile-name fargate-container-insights \
  --region $AWS_REGION \
  --query 'fargateProfile.status'
4.2 IAMサービスアカウントの作成
Container InsightsメトリクスをCloudWatchに送信するため、適切なIAM権限を持つサービスアカウントを作成します。
# IAMサービスアカウント作成
eksctl create iamserviceaccount \
  --cluster=$CLUSTER_NAME \
  --region=$AWS_REGION \
  --name=adot-collector \
  --namespace=fargate-container-insights \
  --role-name=EKS-Fargate-ADOT-ServiceAccount-Role \
  --attach-policy-arn=arn:aws:iam::aws:policy/CloudWatchAgentServerPolicy \
  --approve

# サービスアカウント作成の確認
kubectl get serviceaccount adot-collector -n fargate-container-insights -o yaml

# IAMロールの確認
aws iam get-role --role-name EKS-Fargate-ADOT-ServiceAccount-Role
4.3 RBAC権限の設定
ADOT CollectorがKubernetes APIを通じてメトリクスを収集するために必要な権限を設定します。
# container-insights-rbac.yaml を作成
cat << 'EOF' > container-insights-rbac.yaml
apiVersion: rbac.authorization.k8s.io/v1
kind: ClusterRole
metadata:
  name: container-insights-collector
rules:
  - apiGroups: [""]
    resources:
      - nodes
      - nodes/proxy
      - nodes/metrics
      - services
      - endpoints
      - pods
      - pods/proxy
    verbs: ["get", "list", "watch"]
  - nonResourceURLs: ["/metrics/cadvisor"]
    verbs: ["get", "list", "watch"]
---
apiVersion: rbac.authorization.k8s.io/v1
kind: ClusterRoleBinding
metadata:
  name: container-insights-collector
subjects:
  - kind: ServiceAccount
    name: adot-collector
    namespace: fargate-container-insights
roleRef:
  kind: ClusterRole
  name: container-insights-collector
  apiGroup: rbac.authorization.k8s.io
EOF

# RBAC権限を適用
kubectl apply -f container-insights-rbac.yaml

# RBAC権限の確認
kubectl get clusterrole container-insights-collector
kubectl get clusterrolebinding container-insights-collector
Step 5: Container Insights OpenTelemetryCollectorの作成
5.1 OpenTelemetryCollector設定ファイルの作成
重要: OpenTelemetryCollectorのCRD(Custom Resource Definition)を作成すると、実際にはADOTコレクターのPodが起動します。ADOT addonをインストールした後、OpenTelemetryCollectorリソースを作成することで、そのADOT addonが提供するOpenTelemetry Operatorが管理するコレクターインスタンスが動作する仕組みです。
EKS Fargate用に最適化されたContainer Insights設定を作成します。この設定は公式のAWS推奨設定に基づいています。
# container-insights-collector.yaml を作成
cat << EOF > container-insights-collector.yaml
apiVersion: opentelemetry.io/v1beta1
kind: OpenTelemetryCollector
metadata:
  name: container-insights
  namespace: fargate-container-insights
spec:
  mode: deployment
  serviceAccount: adot-collector
  env:
    - name: OTEL_RESOURCE_ATTRIBUTES
      value: "ClusterName=$CLUSTER_NAME"
  config:
    receivers:
      prometheus:
        config:
          global:
            scrape_interval: 1m
            scrape_timeout: 40s
          scrape_configs:
          - job_name: 'kubelets-cadvisor-metrics'
            sample_limit: 10000
            scheme: https
            kubernetes_sd_configs:
            - role: node
            tls_config:
              ca_file: /var/run/secrets/kubernetes.io/serviceaccount/ca.crt
            bearer_token_file: /var/run/secrets/kubernetes.io/serviceaccount/token
            relabel_configs:
              - action: labelmap
                regex: __meta_kubernetes_node_label_(.+)
              - target_label: __address__
                replacement: kubernetes.default.svc:443
              - source_labels: [__meta_kubernetes_node_name]
                regex: (.+)
                target_label: __metrics_path__
                replacement: /api/v1/nodes/\$\${1}/proxy/metrics/cadvisor
            metric_relabel_configs:
              - action: replace
                source_labels: [id]
                regex: '^/machine\.slice/machine-rkt\\x2d([^\\]+)\.+/([^/]+)\.service\$'
                target_label: rkt_container_name
                replacement: '\$\${2}-\$\${1}'
              - action: replace
                source_labels: [id]
                regex: '^/system\.slice/(.+)\.service\$'
                target_label: systemd_service_name
                replacement: '\$\${1}'

    processors:
      # Rename labels
      metricstransform/label_1:
        transforms:
          - include: .*
            match_type: regexp
            action: update
            operations:
              - action: update_label
                label: name
                new_label: container_id
              - action: update_label
                label: kubernetes_io_hostname
                new_label: NodeName
              - action: update_label
                label: eks_amazonaws_com_compute_type
                new_label: LaunchType

      # Add cluster name from env variable and EKS metadata
      resourcedetection:
        detectors: [env, eks]

      # Rename container and pod metrics
      metricstransform/rename:
        transforms:
          # Container level metrics
          - include: container_spec_cpu_quota
            new_name: new_container_cpu_limit_raw
            action: insert
            match_type: regexp
            experimental_match_labels: {"container": "\\S", "LaunchType": "fargate"}
          - include: container_spec_cpu_shares
            new_name: new_container_cpu_request
            action: insert
            match_type: regexp
            experimental_match_labels: {"container": "\\S", "LaunchType": "fargate"}
          - include: container_cpu_usage_seconds_total
            new_name: new_container_cpu_usage_seconds_total
            action: insert
            match_type: regexp
            experimental_match_labels: {"container": "\\S", "LaunchType": "fargate"}
          - include: container_spec_memory_limit_bytes
            new_name: new_container_memory_limit
            action: insert
            match_type: regexp
            experimental_match_labels: {"container": "\\S", "LaunchType": "fargate"}
          - include: container_memory_working_set_bytes
            new_name: new_container_memory_working_set
            action: insert
            match_type: regexp
            experimental_match_labels: {"container": "\\S", "LaunchType": "fargate"}
          - include: container_memory_failures_total
            new_name: new_container_memory_hierarchical_pgfault
            action: insert
            match_type: regexp
            experimental_match_labels: {"container": "\\S", "LaunchType": "fargate", "failure_type": "pgfault", "scope": "hierarchy"}
          - include: container_memory_failures_total
            new_name: new_container_memory_hierarchical_pgmajfault
            action: insert
            match_type: regexp
            experimental_match_labels: {"container": "\\S", "LaunchType": "fargate", "failure_type": "pgmajfault", "scope": "hierarchy"}
          - include: container_memory_failures_total
            new_name: new_container_memory_pgfault
            action: insert
            match_type: regexp
            experimental_match_labels: {"container": "\\S", "LaunchType": "fargate", "failure_type": "pgfault", "scope": "container"}
          - include: container_memory_failures_total
            new_name: new_container_memory_pgmajfault
            action: insert
            match_type: regexp
            experimental_match_labels: {"container": "\\S", "LaunchType": "fargate", "failure_type": "pgmajfault", "scope": "container"}
          # Pod level metrics
          - include: container_spec_cpu_quota
            new_name: pod_cpu_limit_raw
            action: insert
            match_type: regexp
            experimental_match_labels: {"image": "^\$", "container": "^\$", "pod": "\\S", "LaunchType": "fargate"}
          - include: container_spec_cpu_shares
            new_name: pod_cpu_request
            action: insert
            match_type: regexp
            experimental_match_labels: {"image": "^\$", "container": "^\$", "pod": "\\S", "LaunchType": "fargate"}
          - include: container_cpu_usage_seconds_total
            new_name: pod_cpu_usage_seconds_total
            action: insert
            match_type: regexp
            experimental_match_labels: {"image": "^\$", "container": "^\$", "pod": "\\S", "LaunchType": "fargate"}
          - include: container_spec_memory_limit_bytes
            new_name: pod_memory_limit
            action: insert
            match_type: regexp
            experimental_match_labels: {"image": "^\$", "container": "^\$", "pod": "\\S", "LaunchType": "fargate"}
          - include: container_memory_working_set_bytes
            new_name: pod_memory_working_set
            action: insert
            match_type: regexp
            experimental_match_labels: {"image": "^\$", "container": "^\$", "pod": "\\S", "LaunchType": "fargate"}
          - include: container_memory_failures_total
            new_name: pod_memory_hierarchical_pgfault
            action: insert
            match_type: regexp
            experimental_match_labels: {"image": "^\$", "container": "^\$", "pod": "\\S", "LaunchType": "fargate", "failure_type": "pgfault", "scope": "hierarchy"}
          - include: container_memory_failures_total
            new_name: pod_memory_hierarchical_pgmajfault
            action: insert
            match_type: regexp
            experimental_match_labels: {"image": "^\$", "container": "^\$", "pod": "\\S", "LaunchType": "fargate", "failure_type": "pgmajfault", "scope": "hierarchy"}
          - include: container_memory_failures_total
            new_name: pod_memory_pgfault
            action: insert
            match_type: regexp
            experimental_match_labels: {"image": "^\$", "container": "^\$", "pod": "\\S", "LaunchType": "fargate", "failure_type": "pgfault", "scope": "container"}
          - include: container_memory_failures_total
            new_name: pod_memory_pgmajfault
            action: insert
            match_type: regexp
            experimental_match_labels: {"image": "^\$", "container": "^\$", "pod": "\\S", "LaunchType": "fargate", "failure_type": "pgmajfault", "scope": "container"}
          - include: container_network_receive_bytes_total
            new_name: pod_network_rx_bytes
            action: insert
            match_type: regexp
            experimental_match_labels: {"pod": "\\S", "LaunchType": "fargate"}
          - include: container_network_receive_packets_dropped_total
            new_name: pod_network_rx_dropped
            action: insert
            match_type: regexp
            experimental_match_labels: {"pod": "\\S", "LaunchType": "fargate"}
          - include: container_network_receive_errors_total
            new_name: pod_network_rx_errors
            action: insert
            match_type: regexp
            experimental_match_labels: {"pod": "\\S", "LaunchType": "fargate"}
          - include: container_network_receive_packets_total
            new_name: pod_network_rx_packets
            action: insert
            match_type: regexp
            experimental_match_labels: {"pod": "\\S", "LaunchType": "fargate"}
          - include: container_network_transmit_bytes_total
            new_name: pod_network_tx_bytes
            action: insert
            match_type: regexp
            experimental_match_labels: {"pod": "\\S", "LaunchType": "fargate"}
          - include: container_network_transmit_packets_dropped_total
            new_name: pod_network_tx_dropped
            action: insert
            match_type: regexp
            experimental_match_labels: {"pod": "\\S", "LaunchType": "fargate"}
          - include: container_network_transmit_errors_total
            new_name: pod_network_tx_errors
            action: insert
            match_type: regexp
            experimental_match_labels: {"pod": "\\S", "LaunchType": "fargate"}
          - include: container_network_transmit_packets_total
            new_name: pod_network_tx_packets
            action: insert
            match_type: regexp
            experimental_match_labels: {"pod": "\\S", "LaunchType": "fargate"}

      # Filter only renamed metrics
      filter:
        metrics:
          include:
            match_type: regexp
            metric_names:
              - new_container_.*
              - pod_.*

      # Convert cumulative to delta
      cumulativetodelta:
        include:
          metrics:
            - new_container_cpu_usage_seconds_total
            - pod_cpu_usage_seconds_total
            - pod_memory_pgfault
            - pod_memory_pgmajfault
            - pod_memory_hierarchical_pgfault
            - pod_memory_hierarchical_pgmajfault
            - pod_network_rx_bytes
            - pod_network_rx_dropped
            - pod_network_rx_errors
            - pod_network_rx_packets
            - pod_network_tx_bytes
            - pod_network_tx_dropped
            - pod_network_tx_errors
            - pod_network_tx_packets
            - new_container_memory_pgfault
            - new_container_memory_pgmajfault
            - new_container_memory_hierarchical_pgfault
            - new_container_memory_hierarchical_pgmajfault
          match_type: strict

      # Convert delta to rate
      deltatorate:
        metrics:
          - new_container_cpu_usage_seconds_total
          - pod_cpu_usage_seconds_total
          - pod_memory_pgfault
          - pod_memory_pgmajfault
          - pod_memory_hierarchical_pgfault
          - pod_memory_hierarchical_pgmajfault
          - pod_network_rx_bytes
          - pod_network_rx_dropped
          - pod_network_rx_errors
          - pod_network_rx_packets
          - pod_network_tx_bytes
          - pod_network_tx_dropped
          - pod_network_tx_errors
          - pod_network_tx_packets
          - new_container_memory_pgfault
          - new_container_memory_pgmajfault
          - new_container_memory_hierarchical_pgfault
          - new_container_memory_hierarchical_pgmajfault

      # Generate new metrics
      metricsgeneration/1:
        rules:
          - name: pod_network_total_bytes
            unit: Bytes/Second
            type: calculate
            metric1: pod_network_rx_bytes
            metric2: pod_network_tx_bytes
            operation: add
          - name: pod_memory_utilization_over_pod_limit
            unit: Percent
            type: calculate
            metric1: pod_memory_working_set
            metric2: pod_memory_limit
            operation: percent
          - name: pod_cpu_usage_total
            unit: Millicore
            type: scale
            metric1: pod_cpu_usage_seconds_total
            operation: multiply
            scale_by: 1000
          - name: pod_cpu_limit
            unit: Millicore
            type: scale
            metric1: pod_cpu_limit_raw
            operation: divide
            scale_by: 100

      metricsgeneration/2:
        rules:
          - name: pod_cpu_utilization_over_pod_limit
            type: calculate
            unit: Percent
            metric1: pod_cpu_usage_total
            metric2: pod_cpu_limit
            operation: percent

      # Add Type label and rename
      metricstransform/label_2:
        transforms:
          - include: pod_.*
            match_type: regexp
            action: update
            operations:
              - action: add_label
                new_label: Type
                new_value: "Pod"
          - include: new_container_.*
            match_type: regexp
            action: update
            operations:
              - action: add_label
                new_label: Type
                new_value: Container
          - include: .*
            match_type: regexp
            action: update
            operations:
              - action: update_label
                label: namespace
                new_label: Namespace
              - action: update_label
                label: pod
                new_label: PodName
          - include: ^new_container_(.*)\$
            match_type: regexp
            action: update
            new_name: container_\$1

      batch:
        timeout: 30s
        send_batch_size: 1000
        send_batch_max_size: 1500

    exporters:
      awsemf:
        log_group_name: '/aws/containerinsights/{ClusterName}/performance'
        log_stream_name: '{PodName}'
        namespace: 'ContainerInsights'
        region: $AWS_REGION
        resource_to_telemetry_conversion:
          enabled: true
        eks_fargate_container_insights_enabled: true
        parse_json_encoded_attr_values: ["kubernetes"]
        dimension_rollup_option: NoDimensionRollup
        metric_declarations:
          - dimensions: [ [ClusterName, LaunchType], [ClusterName, Namespace, LaunchType], [ClusterName, Namespace, PodName, LaunchType]]
            metric_name_selectors:
              - pod_cpu_utilization_over_pod_limit
              - pod_cpu_usage_total
              - pod_cpu_limit
              - pod_memory_utilization_over_pod_limit
              - pod_memory_working_set
              - pod_memory_limit
              - pod_network_rx_bytes
              - pod_network_tx_bytes

    service:
      pipelines:
        metrics:
          receivers: [prometheus]
          processors: [metricstransform/label_1, resourcedetection, metricstransform/rename, filter, cumulativetodelta, deltatorate, metricsgeneration/1, metricsgeneration/2, metricstransform/label_2, batch]
          exporters: [awsemf]
  resources:
    limits:
      cpu: 200m
      memory: 512Mi
    requests:
      cpu: 100m
      memory: 128Mi
EOF
5.2 OpenTelemetryCollectorの適用と確認
# Container Insights OpenTelemetryCollectorを適用
kubectl apply -f container-insights-collector.yaml

# OpenTelemetryCollectorリソースの確認
kubectl get opentelemetrycollector -n fargate-container-insights

# Container Insights CollectorのPod状態確認
kubectl get pods -n fargate-container-insights

# Podが起動するまで待機(最大5分)
kubectl wait --for=condition=Ready pod --all -n fargate-container-insights --timeout=300s

# 成功確認
if [ $? -eq 0 ]; then
  echo "✅ Container Insights Collector正常に起動しました"
  kubectl get pods -n fargate-container-insights -o wide
else
  echo "❌ Container Insights Collectorの起動に失敗しました。詳細を確認してください:"
  kubectl describe pod -n fargate-container-insights -l app.kubernetes.io/name=container-insights-collector
fi
Step 6: 動作確認と検証
6.1 環境変数の再確認
Part 1で設定した環境変数が有効であることを確認します:
# 環境変数の確認
echo "CLUSTER_NAME: $CLUSTER_NAME"
echo "AWS_REGION: $AWS_REGION"

# 未設定の場合は再設定
if [ -z "$CLUSTER_NAME" ] || [ -z "$AWS_REGION" ]; then
  echo "環境変数を再設定してください:"
  echo "export CLUSTER_NAME=\"your-cluster-name\""
  echo "export AWS_REGION=\"us-east-1\""
  exit 1
fi
6.2 Container Insights Collectorの状態確認
# OpenTelemetryCollectorリソースの確認
kubectl get opentelemetrycollector -n fargate-container-insights

# Container Insights CollectorのPod状態確認
kubectl get pods -n fargate-container-insights -o wide

# Podが起動するまで待機(最大5分)
kubectl wait --for=condition=Ready pod --all -n fargate-container-insights --timeout=300s

# 成功確認
if [ $? -eq 0 ]; then
  echo "✅ Container Insights Collector正常に動作中"
  kubectl get pods -n fargate-container-insights
else
  echo "❌ Container Insights Collectorに問題があります。トラブルシューティングセクションを参照してください。"
fi
6.3 ログ確認とClusterName検出の確認
# Container Insights Collectorのログ確認(ClusterNameが正しく検出されることを確認)
echo "Container Insights Collectorのログを確認中..."
kubectl logs -n fargate-container-insights deployment/container-insights-collector --tail=50

# ClusterNameの検出確認
echo ""
echo "ClusterName検出状況の確認:"
kubectl logs -n fargate-container-insights deployment/container-insights-collector --tail=100 | grep -i "clustername\|detected resource"

# 正常な場合、以下のようなログが表示されます:
# - "detected resource information" with "ClusterName":"your-cluster-name"
# - "Starting discovery manager"
# - "Scrape job added" with "jobName": "kubelets-cadvisor-metrics"
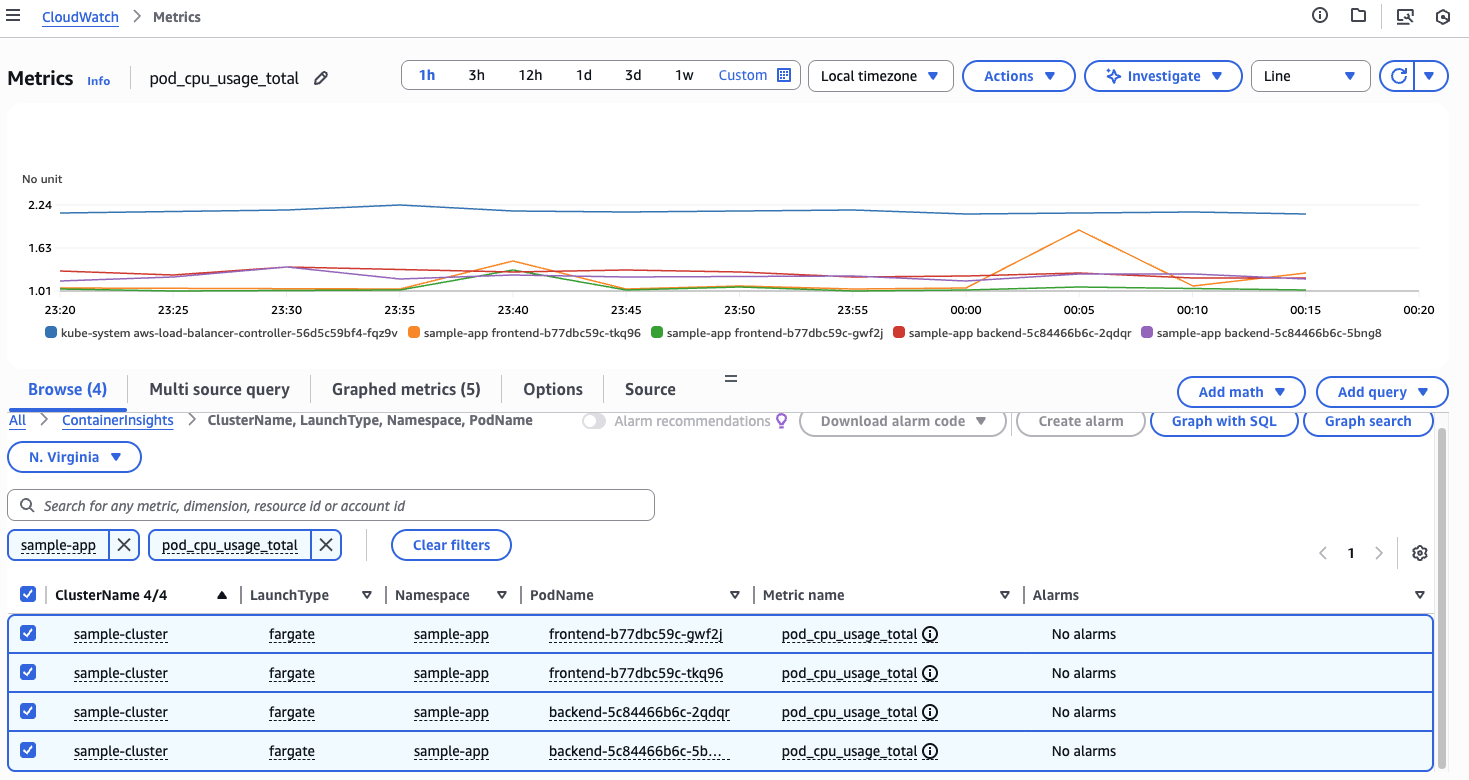
6.4 CloudWatchメトリクスの確認
echo "CloudWatchメトリクスの確認を開始します..."
echo "注意: メトリクスが表示されるまで5-10分かかる場合があります。"

# Container Insightsメトリクスの数を確認
METRICS_COUNT=$(aws cloudwatch list-metrics \
  --namespace "ContainerInsights" \
  --dimensions Name=ClusterName,Value=$CLUSTER_NAME \
  --region $AWS_REGION \
  --query 'length(Metrics)' \
  --output text)

echo "検出されたContainer Insightsメトリクス数: $METRICS_COUNT"

if [ "$METRICS_COUNT" -gt "0" ]; then
  echo "✅ Container Insightsメトリクスが正常に送信されています"

  # 具体的なメトリクス例を確認
  echo ""
  echo "メトリクス例(最初の5件):"
  aws cloudwatch list-metrics \
    --namespace "ContainerInsights" \
    --dimensions Name=ClusterName,Value=$CLUSTER_NAME \
    --region $AWS_REGION \
    --query 'Metrics[0:5].{MetricName:MetricName,Dimensions:Dimensions}' \
    --output table
else
  echo "⚠️  まだメトリクスが表示されていません。以下を確認してください:"
  echo "1. Collectorが5-10分以上動作していること"
  echo "2. アプリケーションPodが動作していること"
  echo "3. IAM権限が正しく設定されていること"
fi

# CloudWatchロググループの確認
echo ""
echo "CloudWatchロググループの確認:"
aws logs describe-log-groups \
  --log-group-name-prefix "/aws/containerinsights/$CLUSTER_NAME" \
  --region $AWS_REGION \
  --query 'logGroups[*].{LogGroupName:logGroupName,StoredBytes:storedBytes,CreationTime:creationTime}' \
  --output table
6.5 テストアプリケーションのデプロイ(メトリクス生成用)
メトリクスを確実に生成するため、テスト用のアプリケーションをデプロイします:
# テスト用namespace作成
kubectl create namespace test-app --dry-run=client -o yaml | kubectl apply -f -

# テスト用Fargateプロファイル作成
aws eks create-fargate-profile \
  --cluster-name $CLUSTER_NAME \
  --fargate-profile-name test-app \
  --pod-execution-role-arn $FARGATE_POD_EXECUTION_ROLE_ARN \
  --selectors namespace=test-app \
  --region $AWS_REGION

# シンプルなテストアプリケーションをデプロイ
cat << EOF | kubectl apply -f -
apiVersion: apps/v1
kind: Deployment
metadata:
  name: test-app
  namespace: test-app
spec:
  replicas: 2
  selector:
    matchLabels:
      app: test-app
  template:
    metadata:
      labels:
        app: test-app
    spec:
      containers:
      - name: test-app
        image: nginx:latest
        resources:
          requests:
            cpu: 100m
            memory: 128Mi
          limits:
            cpu: 200m
            memory: 256Mi
        ports:
        - containerPort: 80
EOF

# テストアプリケーションの起動確認
kubectl wait --for=condition=Ready pod --all -n test-app --timeout=300s
kubectl get pods -n test-app -o wide
6.6 Container Insightsダッシュボードの確認
echo "Container Insightsダッシュボードの確認手順:"
echo "1. AWS Management Console (https://console.aws.amazon.com) にログイン"
echo "2. CloudWatchサービスに移動"
echo "3. 左側メニューから「Container Insights」を選択"
echo "4. 「EKS Clusters」タブで「$CLUSTER_NAME」を選択"
echo "5. 「Pods performance and status」セクションが表示されることを確認"
echo ""
echo "ダッシュボードURL(リージョンを確認してください):"
echo "https://$AWS_REGION.console.aws.amazon.com/cloudwatch/home?region=$AWS_REGION#container-insights:performance/EKS:Cluster?~(query~(~'$CLUSTER_NAME)~context~())"
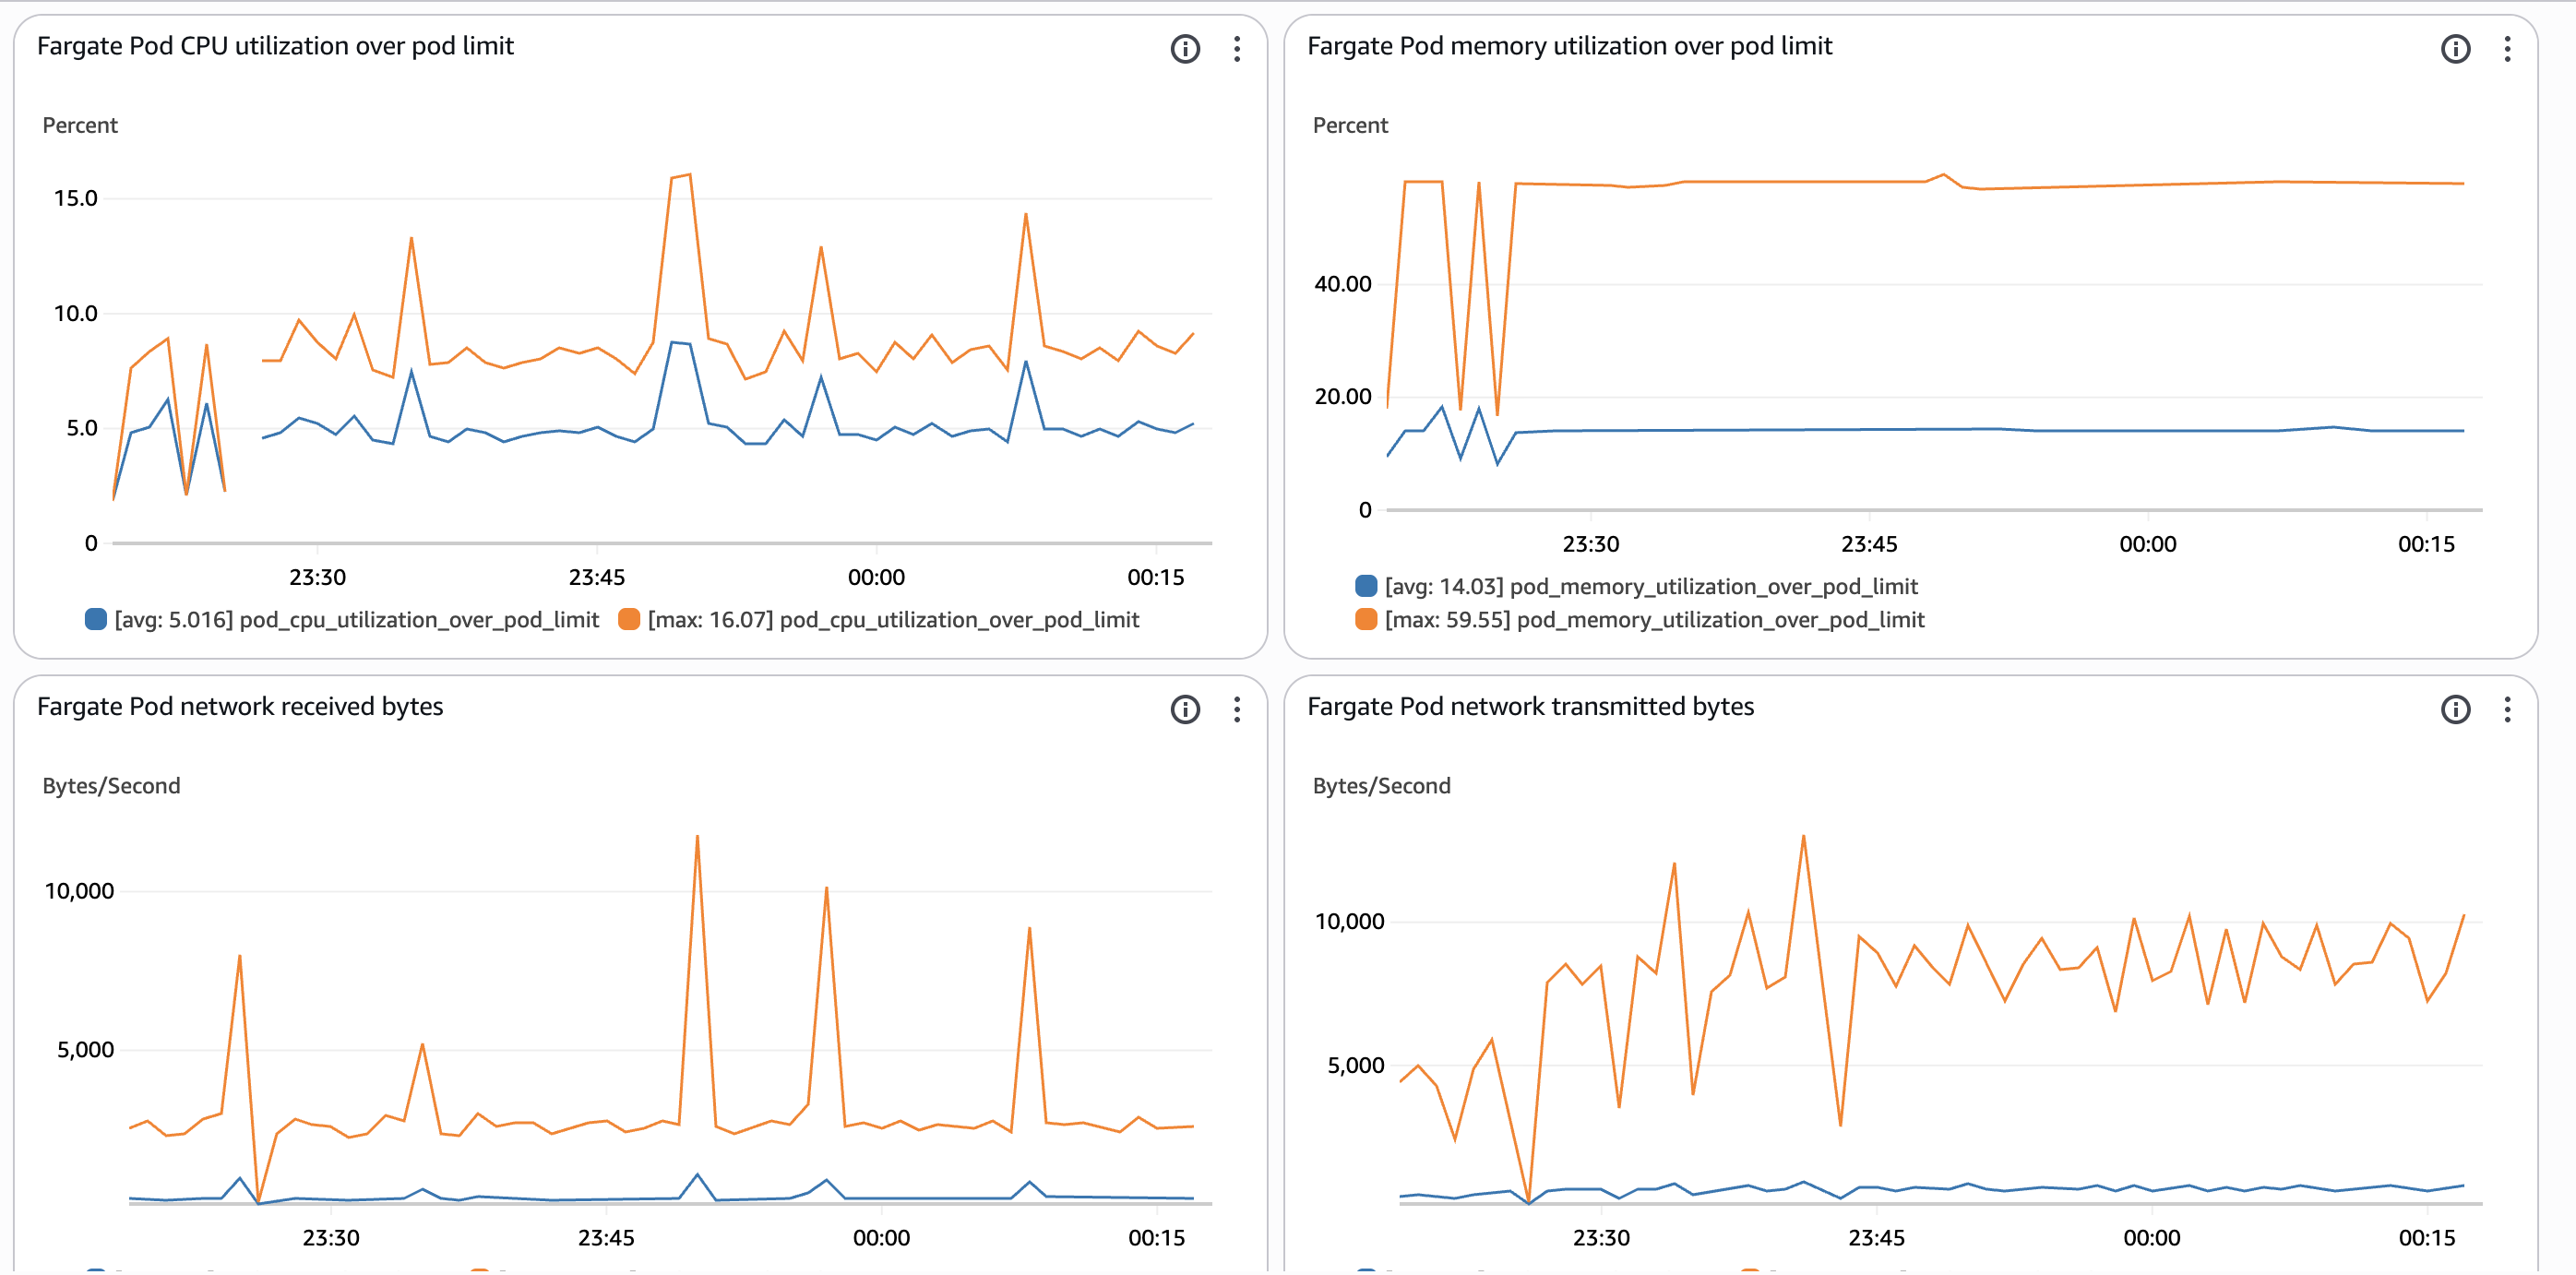

収集されるメトリクス
EKS FargateのContainer Insightsでは、以下のPodレベルメトリクスが収集されます:
CPUメトリクス
-
pod_cpu_utilization_over_pod_limit: Pod CPU使用率(制限値に対する割合) -
pod_cpu_usage_total: Pod CPU使用量(ミリコア) -
pod_cpu_limit: Pod CPU制限値(ミリコア)
メモリメトリクス
-
pod_memory_utilization_over_pod_limit: Podメモリ使用率(制限値に対する割合) -
pod_memory_working_set: Podメモリワーキングセット(バイト) -
pod_memory_limit: Podメモリ制限値(バイト)
ネットワークメトリクス
-
pod_network_rx_bytes: Pod受信バイト数 -
pod_network_tx_bytes: Pod送信バイト数
ディメンション
各メトリクスは以下の3つのディメンションセットで収集されます:
[ClusterName, LaunchType][ClusterName, Namespace, LaunchType][ClusterName, Namespace, PodName, LaunchType]

トラブルシューティング
よくある問題と解決方法
1. Podが Pending 状態
症状: Container Insights CollectorのPodがPending状態のまま
原因: Fargateプロファイルが正しく設定されていない
診断コマンド:
# Podの詳細確認
kubectl describe pod -n fargate-container-insights -l app.kubernetes.io/name=container-insights-collector

# Fargateプロファイルの確認
aws eks describe-fargate-profile \
  --cluster-name $CLUSTER_NAME \
  --fargate-profile-name fargate-container-insights \
  --region $AWS_REGION
解決方法:
# Fargateプロファイルの再作成
aws eks delete-fargate-profile \
  --cluster-name $CLUSTER_NAME \
  --fargate-profile-name fargate-container-insights \
  --region $AWS_REGION

# 削除完了まで待機
aws eks wait fargate-profile-deleted \
  --cluster-name $CLUSTER_NAME \
  --fargate-profile-name fargate-container-insights \
  --region $AWS_REGION

# 再作成
aws eks create-fargate-profile \
  --cluster-name $CLUSTER_NAME \
  --fargate-profile-name fargate-container-insights \
  --pod-execution-role-arn $FARGATE_POD_EXECUTION_ROLE_ARN \
  --selectors namespace=fargate-container-insights \
  --region $AWS_REGION
2. RBAC権限エラー
症状: ログに「nodes is forbidden」エラーが表示
原因: ClusterRoleとClusterRoleBindingが正しく設定されていない
診断コマンド:
# RBAC権限の確認
kubectl get clusterrole container-insights-collector
kubectl get clusterrolebinding container-insights-collector

# サービスアカウントの確認
kubectl get serviceaccount adot-collector -n fargate-container-insights -o yaml
解決方法:
# RBAC権限の再適用
kubectl delete clusterrole container-insights-collector --ignore-not-found=true
kubectl delete clusterrolebinding container-insights-collector --ignore-not-found=true
kubectl apply -f container-insights-rbac.yaml

# OpenTelemetryCollectorの再起動
kubectl rollout restart deployment -n fargate-container-insights
3. ClusterName未検出
症状: ログに「ClusterName」が表示されない
原因: OTEL_RESOURCE_ATTRIBUTES環境変数が正しく設定されていない
診断コマンド:
# OpenTelemetryCollectorの環境変数確認
kubectl get opentelemetrycollector container-insights -n fargate-container-insights -o yaml | grep -A 10 env

# Podの環境変数確認
kubectl exec -n fargate-container-insights deployment/container-insights-collector -- env | grep OTEL
解決方法:
# OpenTelemetryCollectorの設定を修正して再適用
kubectl apply -f container-insights-collector.yaml

# Podの再起動
kubectl rollout restart deployment -n fargate-container-insights
4. メトリクス未送信
症状: CloudWatchにメトリクスが表示されない
原因: IAM権限が不足している
診断コマンド:
# IAMロールの権限確認
aws iam list-attached-role-policies --role-name EKS-Fargate-ADOT-ServiceAccount-Role

# サービスアカウントのアノテーション確認
kubectl get serviceaccount adot-collector -n fargate-container-insights -o yaml | grep -A 5 annotations
解決方法:
# IAMサービスアカウントの再作成
eksctl delete iamserviceaccount \
  --cluster=$CLUSTER_NAME \
  --region=$AWS_REGION \
  --name=adot-collector \
  --namespace=fargate-container-insights

eksctl create iamserviceaccount \
  --cluster=$CLUSTER_NAME \
  --region=$AWS_REGION \
  --name=adot-collector \
  --namespace=fargate-container-insights \
  --role-name=EKS-Fargate-ADOT-ServiceAccount-Role \
  --attach-policy-arn=arn:aws:iam::aws:policy/CloudWatchAgentServerPolicy \
  --approve

# OpenTelemetryCollectorの再起動
kubectl rollout restart deployment -n fargate-container-insights
総合デバッグコマンド
# 全体的な状態確認スクリプト
echo "=== Container Insights 診断レポート ==="
echo "日時: $(date)"
echo "クラスター: $CLUSTER_NAME"
echo "リージョン: $AWS_REGION"
echo ""

echo "1. OpenTelemetryCollector状態:"
kubectl get opentelemetrycollector -n fargate-container-insights

echo ""
echo "2. Pod状態:"
kubectl get pods -n fargate-container-insights -o wide

echo ""
echo "3. サービスアカウント:"
kubectl get serviceaccount adot-collector -n fargate-container-insights

echo ""
echo "4. RBAC権限:"
kubectl get clusterrole container-insights-collector
kubectl get clusterrolebinding container-insights-collector

echo ""
echo "5. 最新ログ(最後の10行):"
kubectl logs -n fargate-container-insights deployment/container-insights-collector --tail=10

echo ""
echo "6. CloudWatchメトリクス数:"
aws cloudwatch list-metrics \
  --namespace "ContainerInsights" \
  --dimensions Name=ClusterName,Value=$CLUSTER_NAME \
  --region $AWS_REGION \
  --query 'length(Metrics)' \
  --output text

echo ""
echo "=== 診断完了 ==="
まとめ
本記事では、EKS FargateでADOT Addonを使用してContainer Insightsを構築する手順を詳しく解説しました。
重要なポイント
- ADOT Addon + OpenTelemetryCollector CRD: 手動デプロイではなく、EKS管理のADOT Addonを活用
- 完全なメトリクス処理パイプライン: AWS公式推奨の処理順序を実装
- 適切な権限設定: RBAC権限とIAMサービスアカウントの両方が必要
- Fargate最適化: EKS Fargate環境に特化した設定
期待される結果
- CloudWatch Container Insightsダッシュボードで「Pods performance and status」が表示
- Podレベルのメトリクス(CPU、メモリ、ネットワーク)が監視可能
- リアルタイムでのPodパフォーマンス分析が可能
この設定により、EKS Fargate環境でも効果的なContainer Insightsによる監視が実現できます。