JupyterLab で分析した結果を報告する時、資料として ipynb もしくはそれを HTML 等に変換したものを使って良いのであれば、一番ラクだ。せっかく Markdown だって書けることだし。
でもまぁほとんどの場合が PowerPoint なり Google Slide なりを作ることになるんじゃなかろうか。
その時に一番イヤなのが、表を書き写す事ね。これに尽きる。
値を間違ってはいけないし、適切な桁で四捨五入したり、隣のセルと見間違えたり。
ある時ヒラメいた。これ、画像にしてコピペしちゃえばいいんじゃね?
準備
必要なもの
-
pandas
- 当たり前
-
tabulate
- pandas.DataFrame を HTML 変換するときに暗に必要
-
html2image
- HTML 出力した表を画像にする
-
Pillow
- 画像の調整
-
matplotlib
- 画像の表示
-
jupyterlab
- JupyterLab でやるからね
関数の実装
import os

%matplotlib inline
import matplotlib.pyplot as plt
import pandas as pd
from html2image import Html2Image
from PIL import Image

pd.set_option("display.float_format", "{:.4f}".format)


def show_table(
    table: pd.DataFrame,
    *,
    index: bool | None = True,
    font_size: str | None = "18px",
    dpi: float | None = 0.8,
) -> None:
    """displays Table as an image.

    Args:
        table (pandas.DataFrame): the Table.
        index (:obj:`bool`, optional): print index (default: True)
        font_size (:obj:`str`, optional): font size (default: "18px")
        dpi (:obj:`float`, optional): DPI (default: 0.8)
    """
    css = f"""
table.dataframe {{
    border: none;
    border-collapse: collapse;
    border-spacing: 0;
    color: black;
    font-family: Noto Sans JP;
    font-size: {font_size};
    table-layout: fixed;
}}
table.dataframe thead {{
    border-bottom: 1px solid black;
    vertical-align: bottom;
}}
table.dataframe tr, table.dataframe th, table.dataframe td {{
    text-align: right;
    vertical-align: middle;
    padding: 0.5em 0.5em;
    line-height: normal;
    white-space: nowrap;
    max-width: none;
    border: none;
}}
table.dataframe th {{
    font-weight: bold;
}}
table.dataframe tbody tr:nth-child(even) {{
    background: #f5f5f5;
}}
"""
    path: str = "_show_table_temp.png"
    hti: Html2Image = Html2Image(disable_logging=True)
    _ = hti.screenshot(
        html_str=table.to_html(index=index),
        css_str=css,
        save_as=path,
    )
    img: Image = Image.open(path)
    img = img.crop(img.getbbox())
    fig, ax = plt.subplots(
        nrows=1, ncols=1, figsize=img.size, dpi=dpi, layout="tight"
    )
    ax.imshow(img)
    ax.axis("off")
    plt.show(fig)
    plt.clf()
    plt.close()
    os.remove(path)
    return
CSS をベタ書きしてるから長ったらしい関数に見えるけど、中身はそれほどでもない。
- まず重要なのが、pandas.set() で
display.float_formatを指定していること- これによって表示する際に自動的に四捨五入して小数の桁数が揃う
- Html2Image.screenshot() は HTML テキストを Web ブラウザで表示して、その画面のスクリーンショットを撮って画像にするもの(っぽい)
- pandas.DataFrame を to_html() で HTML にして、こいつに渡す
- この時に、Jupyter(iPython)と同じ様に表示することを狙ったため、CSS が長くなった
- 生成される画像は、適当なファイル名で一時的に保存することにする
- この画像は、非常に大きくて余白が多すぎる(たぶんディスプレイのサイズ)
- そこで保存した画像を Pillow で読み込み、getbbox() で BoundingBox(何かが写っている矩形領域)を取得し、そこだけを crop() で切り抜く
- そうした画像をまたファイルに保存してもいいんだけど、いちいちファイル名を考えるのが面倒くさいので、JupyterLab に貼り付けることにする
- 普通に pandas.DataFrame を表示するのと同じ感じで使えるように
- 表示したら、一時的に保存したファイルを消す
カスタマイズできること
- 列名を表示するか否かは引数で設定できるようにした
- フォントサイズ・DPI も引数で変更できるようにした
- とりあえず iPython と同じ感じになるようにしたけど、お好みで
- フォントは決め打ちで Noto Sans JP を使っているけど、これもお好みで
関数名は・・・私はネーミングセンスが無いので・・・
使ってみる
サンプルとして、適当に iris でも予測してみることにする。
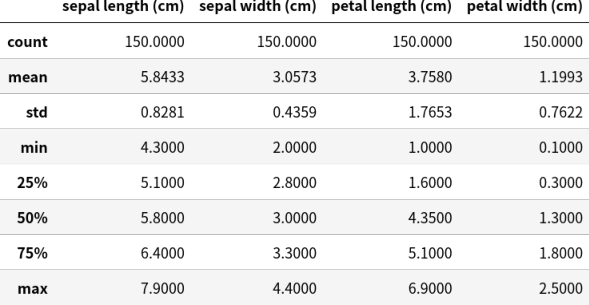
まずはデータを読み込んで、特徴量の分布を見てみよう。
from sklearn.datasets import load_iris
from sklearn.utils import Bunch

iris: Bunch = load_iris()
show_table(
    pd.DataFrame(
        iris.data,
        columns=iris.feature_names,
    ).describe(),
)
次に、いつものように学習する。適当に LinearSVC でも使えばいいか。
from typing import Any
import numpy as np
from scipy.stats import expon
from sklearn.preprocessing import StandardScaler
from sklearn.model_selection import (
    train_test_split,
    RandomizedSearchCV,
    StratifiedKFold,
)
from sklearn.svm import LinearSVC

(
    x_train,
    x_test,
    y_train,
    y_test,
) = train_test_split(
    iris.data,
    iris.target,
    test_size=0.3,
    shuffle=True,
    stratify=iris.target,
    random_state=12,
)
svc_params: dict[str, Any] = {
    "penalty": ["l1", "l2"],
    "C": expon(),
    "class_weight": [None, "balanced"],
}
ss: StandardScaler = StandardScaler().fit(x_train)
estimator: LinearSVC = LinearSVC(
    multi_class="ovr",
    dual="auto",
    fit_intercept=True,
    max_iter=10000,
    random_state=12,
)
skf: StratifiedKFold = StratifiedKFold(
    n_splits=5,
    shuffle=True,
    random_state=12,
)
rcv: RandomizedSearchCV = RandomizedSearchCV(
    estimator,
    svc_params,
    n_iter=1000,
    scoring="f1_macro",
    n_jobs=-1,
    refit=True,
    cv=skf,
    random_state=12,
).fit(
    ss.transform(x_train),
    y=y_train,
)
pred_test: np.ndarray = rcv.best_estimator_.predict(
    ss.transform(x_test),
)
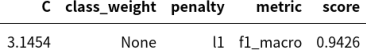
CrossValidation で得られた Hyper Parameter の値や score を見てみよう。
show_table(
    pd.DataFrame(
        [
            dict(
                rcv.best_params_,
                **{"metric": "f1_macro", "score": rcv.best_score_}
            )
        ]
    ),
    index=False,
)
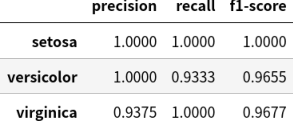
テストデータにおける metrics を見てみよう。
from sklearn.metrics import classification_report

show_table(
    pd.DataFrame(
        classification_report(
            y_test,
            pred_test,
            target_names=iris.target_names,
            output_dict=True,
            zero_division=0,
        )
    )
    .iloc[:3, : iris.target_names.shape[0]]
    .T
)
最後に、テストデータの confusion matrix を見てみよう。
from sklearn.metrics import confusion_matrix

matrix: pd.DataFrame = pd.DataFrame(
    confusion_matrix(y_test, pred_test),
    index=iris.target_names,
    columns=iris.target_names,
)
matrix = pd.concat(
    [
        matrix,
        pd.Series(matrix.sum(axis="columns"), name="実際合計"),
    ],
    axis="columns",
)
matrix = pd.concat(
    [
        matrix,
        pd.Series(matrix.sum(axis="index"), name="予測合計").to_frame().T,
    ],
    axis="index",
)
show_table(matrix)

綺麗に出力されているね!(これが言いたかっただけ)
JupyterLab のテンプレートを使う
作ってみて思った。
- こんな長ったらしい関数、覚えておきたくないし、どっかからコピペするのもイヤだ
- かといってパッケージ化するのもメンドイ
そんなときに jupyterlab-templates ですよ。
インストール方法は上記リンクに載っているからいいとして、設定にちょっとクセがある。
まずは JupyterLab の config path を確認する。
pipx に JupyterLab を入れている人は、pipx run --spec jupyterlab jupyter --config-dir(普通に仮想環境等に入れている人は jupyter --config-dir)の結果が config path。
これが ~/.jupyter だったものとする。(上記結果の表示はフルパスだろうけど)
次に ~/.jupyter/jupyter_lab_config.py を以下のように作成/編集する。
import os

c = get_config()  # noqa
c.JupyterLabTemplates.include_default = False
c.JupyterLabTemplates.include_core_paths = False
c.JupyterLabTemplates.template_dirs = [os.path.expanduser("~/.jupyter/templates")]
include_default と include_core_paths を False にしているのは、jupyterlab-templates に入っているデフォルトのテンプレートを読み込まないようにする設定。
そして template_dirs を ~/.jupyter/templates に設定している。
なので次はそのディレクトリを作りテンプレートとなる ipynb を入れるのだが、ここで注意。
template_dirs に設定したディレクトリ(上記の例では ~/.jupyter/templates)に、さらにディレクトリを掘り、その下にテンプレートとなる ipynb を入れないとダメ。
要するに、こういうことをしなきゃいけない。
mkdir -p ~/.jupyter/templates/jupyterlab_templates
cp template.ipynb ~/.jupyter/templates/jupyterlab_templates/.
これ、設定するたびに毎回忘れて数時間は焦る。
一緒にテンプレートしたい設定
せっかくテンプレートを作るので、他にも入れるべきものは入れてしまいたい。
そこでお薦めしたいのは「JupyterLab の Notebook、code cell の行間を狭くする」設定。
これ、JupyterLab のどこの設定をいじっても、どこの CSS をいじっても狭くならない。
それでも解決策ではないのだが、以下の code cell を実行することで強制的に変更するということをしている。
%%html
<!-- set height of code lines narrow -->
<style>
div.cm-content { line-height: 1.05 !important; }
</style>
最後に
こんな場当たり的な方法ではなく、ちゃんと JupyterLab code cell の行間を狭くする方法をご存知の方がいらっしゃったら是非教えてください。