前口上
男の子なら中心をトコトン追いかけたいもの。台風の中心を追いかけるスクリプトを書いたので,絵描いて確認することにしました。パソコンなんだから紙前提のスタンプマップ(切手のようにsubplotsを並べたもの)はないだろうと思い,matplotlib.animation APIに挑戦しました。最終結果Animation.ipynbは,gistに上げてあります。内容をかいつまんで説明します。
本物の台風の代わりにcos型の山で代用します。
import numpy as np

lon = np.linspace(120, 150, 31)
lat = np.linspace(20, 50, 31)

X, Y = np.meshgrid(lon, lat)

def cosbel(x, y, height = -1, radius = 5):
    r = np.sqrt(x**2 + y**2)
    z = 0.5 * height * (1 +np.cos(np.pi * r / radius))
    z[r > radius] = 0
    return z
楽したい
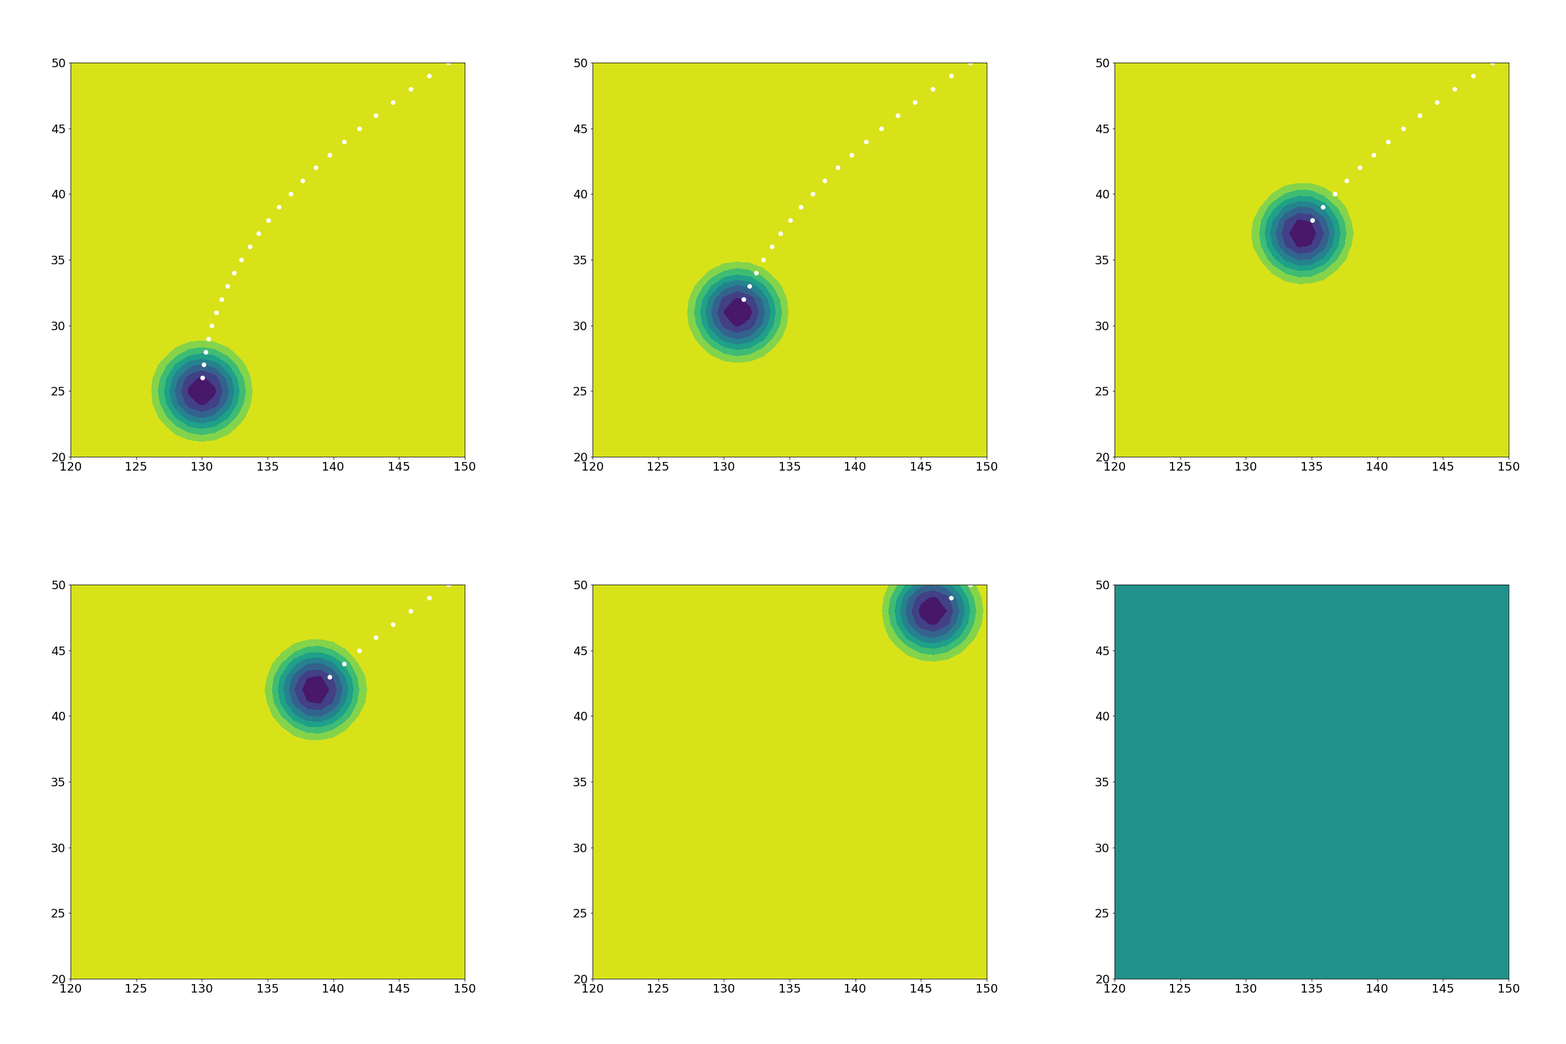
人間ならなるべく楽をしたいもの。ArtistsAnimationから手をつけました。が,scatterで描いた点は最初のフレームから全てが表示され,時間が進むとPAC-MAN™のように点が台風に食われていきます。みていて面白いのですが,中心と一致しているか確認しづらく,描きたかったものではありません。陰影も点もArtistsなのですが,両方リストに追加するとチカチカしてしまいますし,気難しいArtistsを融合させる方法は分かりませんでした。
import numpy as np
import matplotlib.pyplot as plt
from matplotlib import animation

plt.rcParams['animation.html'] = 'html5'
plt.rcParams['font.size'] = 18

fig, ax = plt.subplots(figsize=(11,11))
ax.set_aspect('equal')
ax.set_xlim(120, 150)
ax.set_ylim(20, 50)

ims = []

for i in range(30):
    lonc = 130 + 0.03*i**2
    latc = 25 + i
    Z = 1000 + cosbel(X - lonc, Y - latc, height=-40)
    ax.scatter(lonc, latc, c="white")
    im = ax.contourf(X, Y, Z)
    ims.append(im.collections)

ani = animation.ArtistAnimation(fig, ims)
仕方がない
大人は追い詰められると腹をくくります。FuncAnimationに挑戦しました。最初以外のステップはax.cla()で消去せよと書いてあります。alpha=0.2などとするとよく分かりますが,クリアしないと確かに重なって表示されます。クリアするといつも共通の軸や目盛を毎回描かないといけません。時間もかかるし,コードも汚いです。
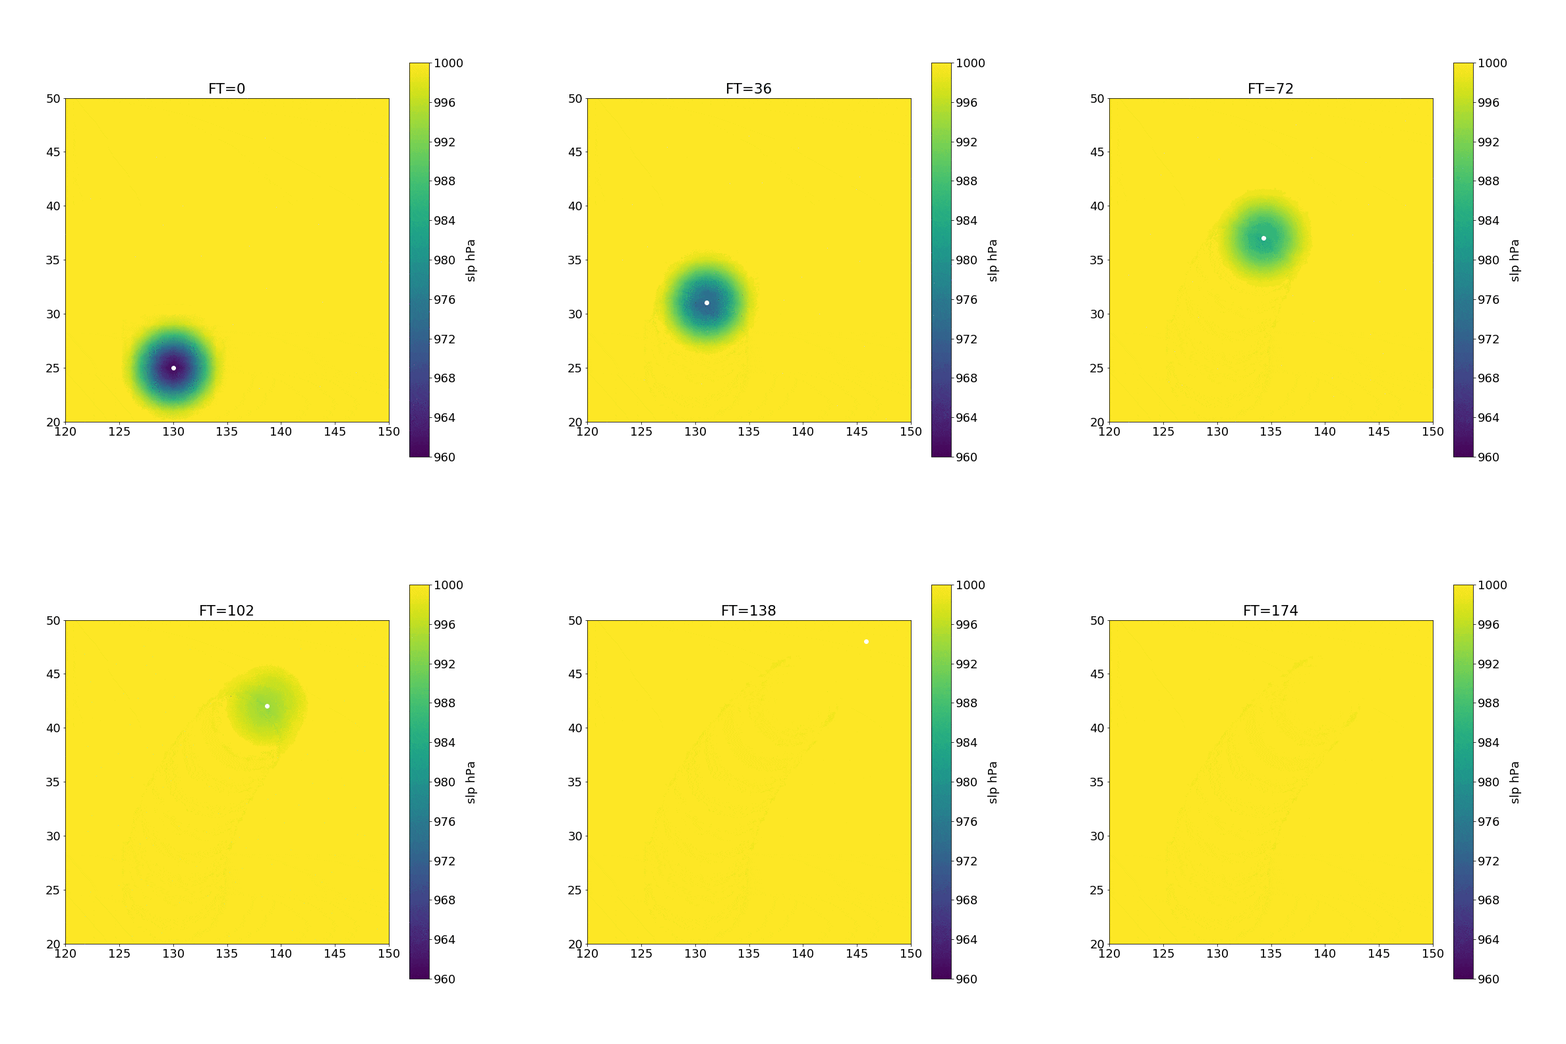
「Matplotlib animations the easy way」を読んで気づきました。まず1枚絵を描いて,変わるところだけ入れ替えれば良いのです。「早く知っておきたかったmatplotlibの基礎知識、あるいは見た目の調整が捗るArtistの話」にある通り,matplotlibは本来オブジェクト指向です。
%matplotlib inline
import numpy as np
import matplotlib.pyplot as plt
from matplotlib import animation

plt.rcParams['animation.html'] = 'html5'
plt.rcParams['font.size'] = 18

fig, ax = plt.subplots(figsize=(11,11))
ax.set_aspect('equal')
ax.set_xlim(120, 150)
ax.set_ylim(20, 50)
ti = ax.set_title("FT=0")

lon0 = 130
lat0 =  25
p0 = 1000
dp = 40

Z = p0 + cosbel(X - lon0, Y - lat0, height=-dp)
sc = ax.scatter(lonc, latc, c="white")
pm = ax.pcolormesh(X, Y, Z, shading='gouraud')

cbar = fig.colorbar(pm)
cbar.set_clim(p0-dp, p0)
cbar.set_ticks(np.linspace(p0-dp, p0, 11))
cbar.set_label('slp hPa')

def update(i):
    lonc = lon0 + 0.03*i**2
    latc = lat0 + i
    Z = p0 + cosbel(X - lonc, Y - latc, height = -dp + 2 * i)
    sc.set_offsets((lonc, latc))
    pm.set_array(Z.ravel()) # convert array to 1d with ravel()
    sc.set_zorder(1) # need to set drawing order with pcolormesh
    pm.set_zorder(0)
    ti.set_text("FT={}".format(i * 6))

ani = animation.FuncAnimation(fig, update, frames=30)
plt.close()

