やりたいこと
XGBoostの元になったGradient Boosting Decision Treeを用いたモデルトレーニングを体験する。
Gradient Boosting Decision TreeとXGBoostとの大きな違いは、実行速度らしい。
コード
'''
Created on 2019/05/14
@author: tatsunidas
'''
# 勾配加速決定木モデルインポート
from sklearn.ensemble import GradientBoostingClassifier
# 訓練データとテストデータを分けるファンクション
from sklearn.model_selection import train_test_split
# データの読み込み
from sklearn.datasets import load_breast_cancer
dataset = load_breast_cancer()
# 目的変数(y)と説明変数(X)を設定
X = dataset.data
y = dataset.target#[0 = 'malignant' 1 = 'benign']
# 訓練データとテストデータに分ける
X_train, X_test, y_train, y_test = train_test_split(X,y,test_size=0.1,random_state=0)
# 決定木をトレーニング
gbdt = GradientBoostingClassifier(criterion="friedman_mse")#n_estimators : int (default=100)
gbdt.fit(X_train, y_train)
pred = gbdt.predict(X_test)
print(pred, y_test, sep = '\n')
print("Accuracy of GBDT model is: ", gbdt.score(X_test, y_test))
'''
どのestimatorのtreeを取得するか
gbdt.estimators_[(num of estimators - 1),0]
'''
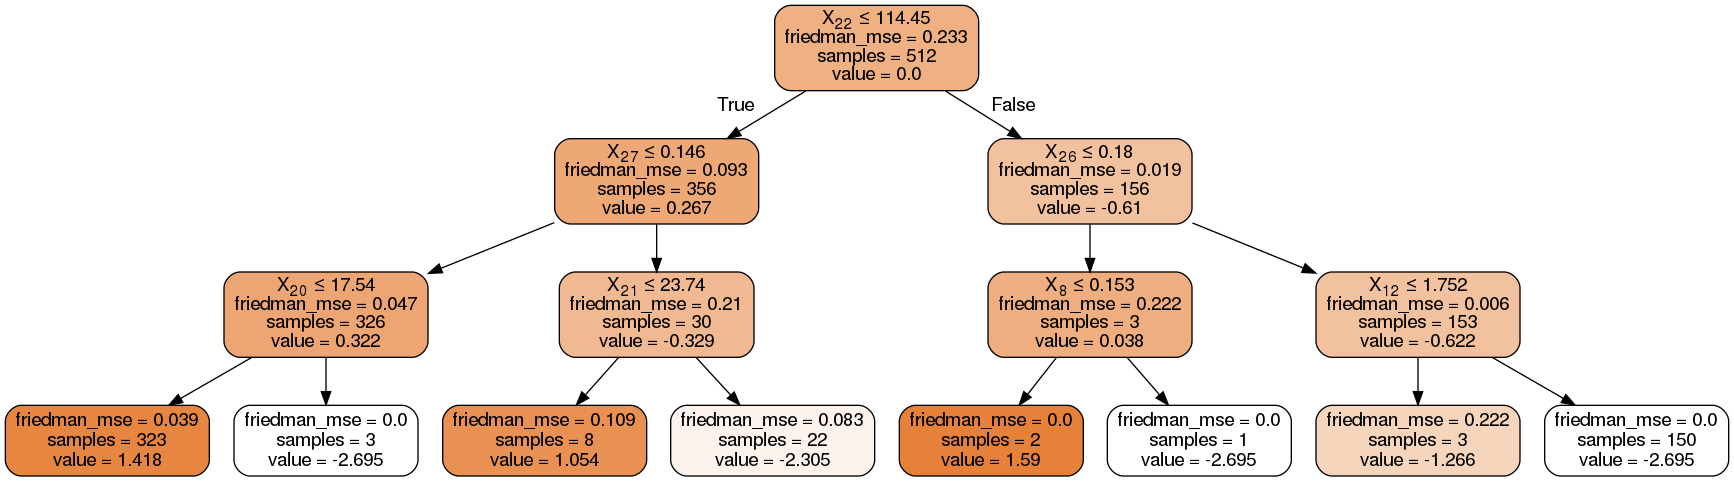
# 可視化する graphviz
from sklearn.tree import export_graphviz
import pydotplus
dot_data = export_graphviz(gbdt.estimators_[0,0], out_file=None,
filled=True, rounded=True,
special_characters=True)
graph = pydotplus.graph_from_dot_data(dot_data)
graph.write_png('test_graph.png')
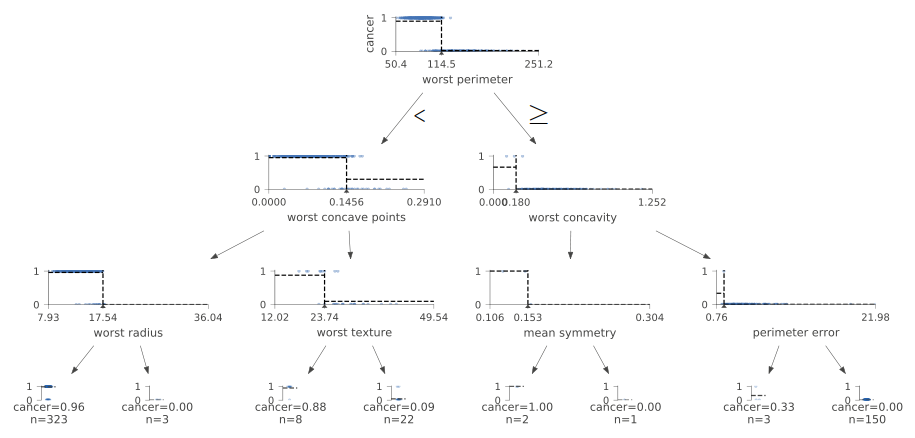
# 可視化する dtreeviz
from dtreeviz.trees import *
viz = dtreeviz(gbdt.estimators_[0,0],
X_train,
y_train,
target_name='cancer',
class_names=["malignant", "benign"],
feature_names=dataset.feature_names)
viz.view() # save as svg to tmp dir
結果
予測
[0 1 1 1 1 1 1 1 1 1 1 1 1 0 1 0 1 0 0 0 0 0 1 1 0 1 1 0 1 0 1 0 1 0 1 0 1
0 1 0 1 1 0 1 1 0 1 1 1 0 0 0 0 1 1 1 1]
正解ラベル
[0 1 1 1 1 1 1 1 1 1 1 1 1 1 1 0 1 0 0 0 0 0 1 1 0 1 1 0 1 0 1 0 1 0 1 0 1
0 1 0 0 1 0 1 1 0 1 1 1 0 0 0 0 1 1 1 1]
Accuracy of GBDT model is: 0.9649122807017544
可視化1(graphviz)
可視化2(dtreeviz)
決定木モデルの可視化はscikit-learn 0.21以上でscikit-learnデフォルトのグラフ関数が使えそう。執筆時点では推奨バージョンが0.20だったため、未テスト。