やりたいこと
普段、JuliaのPlots.jlで色々をグラフを描いているのですが、対数を描画することも多くあります。
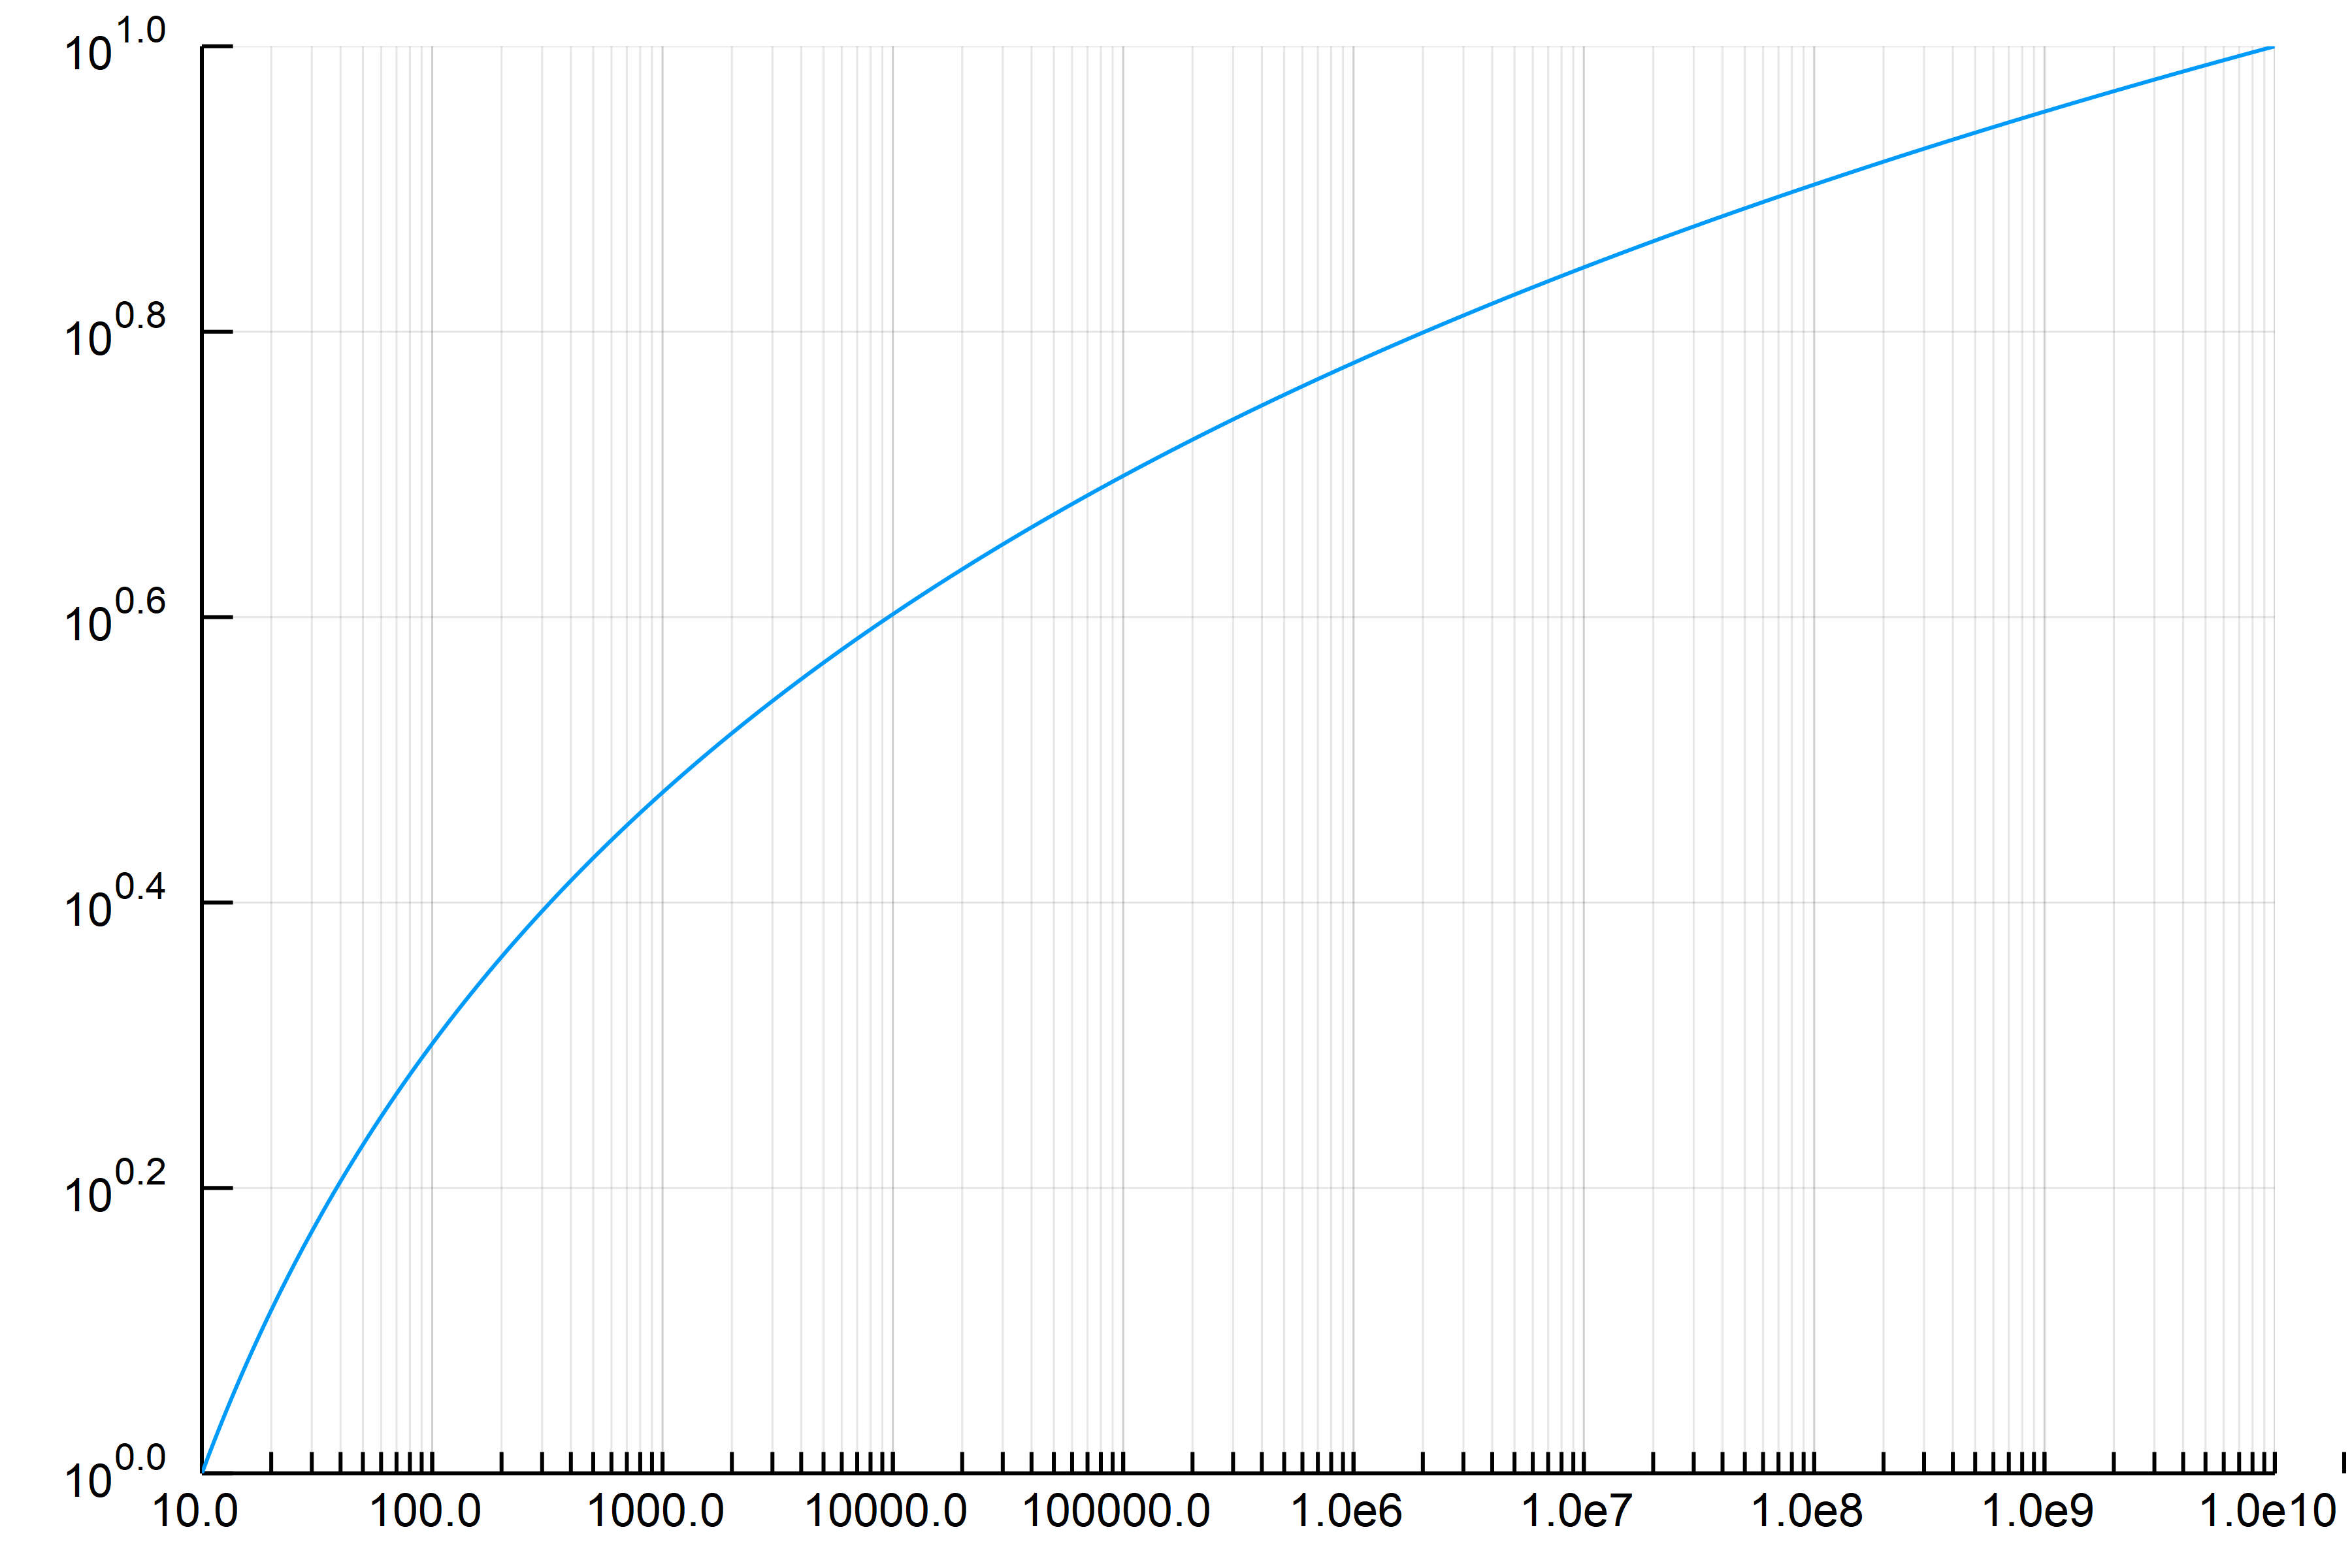
例えばx軸を対数にするためには、xscale=:log10 とするだけでOKなのですが、残念ながらGRやPyPlotをバックエンドに選択した場合は、補助目盛が表示されません。
(環境やバージョンによっては、上記バックエンドを指定しても、デフォルトで補助目盛が表示される可能性もありますが)
普通に補助目盛を入れようとすると、ticksで値を入れることができますが、数値も一緒に表示されてしまい非常に邪魔です。
そのような場合に、面倒ですがとりあえず、補助目盛を入れる方法を記載します。
やりかた
一応、Plots.jlのAttributesに記載があります。
http://docs.juliaplots.org/latest/attributes/
具体的には、ticksの項目に以下のような記載があります。
Vector of numbers (set the tick values), Tuple of (tickvalues, ticklabels), or
:auto
つまり、plot関数のキーワード引数で、ticks=([], [])と指定をすればよいだけですね。
とりあえず、以下のような形で実行が可能でした。
using Plots; gr()

xlab, xval = Float64[], Float64[]
for i in 1:10, j in 1:10
    push!(xval, i*10^j)
    i==1 && push!(xlab, 10^j)
end

plot(logspace(1,10,1000), log10.(x), scale=:log10, xticks=(xval, xlab), legend=false)
実行結果は以下の通りです。
同じことしか書いていませんが、gistは以下の通りです。
https://gist.github.com/tatssuki/3966268f380511eabe6690ad66aafc3f
