はじめに
Dockerを使用する中で、この子たちがどのくらいメモリを食っているのかを確認したくなったので、調べました。
確認方法
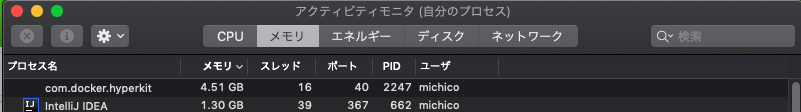
アクティビティモニタで確認
docker stats
実行中のDocker Containerのメモリ使用量を docker stats コマンドを使って調べることができるみたいです。
$ docker stats
CONTAINER ID        NAME                          CPU %               MEM USAGE / LIMIT     MEM %               NET I/O             BLOCK I/O           PIDS
0d173431ff71        concourse-worker_1   14.37%              32.16MiB / 1.943GiB   1.62%               53.4MB / 86.6MB     0B / 0B             22
91e1a99d4d30        concourse-web_1      24.25%              32.19MiB / 1.943GiB   1.62%               356MB / 318MB       0B / 0B             13
189cc19df954        concourse-db_1       0.82%               49.21MiB / 1.943GiB   2.47%               249MB / 230MB       0B / 0B             24
47590fe69e09        sonarqube-db_1       0.00%               6.246MiB / 1.943GiB   0.31%               6.57kB / 1.22kB     0B / 0B             7
| 内容 | |
|---|---|
| CONTAINER ID | ContainerのID |
| NAME | Containerの名前 |
| CPU % | Containerが使用しているCPU使用率 |
| MEM USAGE / LIMIT | 使用しているメモリ / Dockerに許可されたメモリ(Docker > Stettings > Resources) |
| MEM % | Containerが使用しているメモリ使用率 |
| NET I/O | Containerが送受信したデータ量 |
| BLOCK I/O | Containerがブロックデバイスに読み書きしたデータ量 |
| PIDS | プロセスID |
オプション
$ docker stats --help

Usage:	docker stats [OPTIONS] [CONTAINER...]

Display a live stream of container(s) resource usage statistics

Options:
  -a, --all             Show all containers (default shows just running)
      --format string   Pretty-print images using a Go template
      --no-stream       Disable streaming stats and only pull the first result
      --no-trunc        Do not truncate output
起動中の全Container表示
$ docker stats -a
CONTAINER ID        NAME                          CPU %               MEM USAGE / LIMIT     MEM %               NET I/O             BLOCK I/O           PIDS
ea19cee314d2        studyyml_concourse-worker_1   0.16%               49.73MiB / 1.943GiB   2.50%               302kB / 487kB       0B / 0B             20
11150df2f0af        studyyml_concourse-web_1      0.25%               27.84MiB / 1.943GiB   1.40%               1.85MB / 1.8MB      0B / 0B             10
17a9843e204a        studyyml_sonarqube_1          0.00%               0B / 0B               0.00%               0B / 0B             0B / 0B             0
876602d0178e        studyyml_concourse-db_1       0.01%               45.26MiB / 1.943GiB   2.27%               1.46MB / 1.3MB      0B / 0B             22
06b430623fc0        studyyml_sonarqube-db_1       0.00%               6.891MiB / 1.943GiB   0.35%               4.23kB / 2.44kB     0B / 0B             7
リアルタイムで更新されていくのですが、 control + C で中止することができます。(最初これ知らなくて焦りました・・・)
フォーマットして表示
.Container , .Name , .ID , .CPUPerc , .MemUsage , .NetIO , .BlockIO , .MemPerc , .PIDs が選択可能。
$ docker stats --format "{{.Name}} : {{.MemUsage}}"
studyyml_concourse-worker_1 : 50.04MiB / 1.943GiB
studyyml_concourse-web_1 : 28.21MiB / 1.943GiB
studyyml_concourse-db_1 : 46.7MiB / 1.943GiB
studyyml_sonarqube-db_1 : 6.883MiB / 1.943GiB
一度だけ表示
$ docker stats --no-stream
CONTAINER ID        NAME                          CPU %               MEM USAGE / LIMIT     MEM %               NET I/O             BLOCK I/O           PIDS
ea19cee314d2        studyyml_concourse-worker_1   0.14%               50.05MiB / 1.943GiB   2.52%               851kB / 1.38MB      0B / 0B             21
11150df2f0af        studyyml_concourse-web_1      0.27%               28.23MiB / 1.943GiB   1.42%               4.7MB / 4.39MB      0B / 0B             10
876602d0178e        studyyml_concourse-db_1       0.14%               46.62MiB / 1.943GiB   2.34%               3.5MB / 3.26MB      0B / 0B             23
06b430623fc0        studyyml_sonarqube-db_1       0.00%               6.902MiB / 1.943GiB   0.35%               4.44kB / 2.44kB     0B / 0B             7
切り捨て表示しない
ContainerIDが全表示になりました。
$ docker stats --no-trunc
CONTAINER ID                                                       NAME                          CPU %               MEM USAGE / LIMIT     MEM %               NET I/O             BLOCK I/O           PIDS
ea19cee314d2aa230ae71215fbae442b08386bcc4c3d963f1e02550c1b51f909   studyyml_concourse-worker_1   3.35%               49.99MiB / 1.943GiB   2.51%               923kB / 1.49MB      0B / 0B             21
11150df2f0af1198e3fe689697621a3cb5270d81a572de6a6d67a588b2b17173   studyyml_concourse-web_1      0.00%               28.28MiB / 1.943GiB   1.42%               5.04MB / 4.71MB     0B / 0B             10
876602d0178eb1ae7b7333c2203837fa2f292dc9f89a2832f6622111b2be054c   studyyml_concourse-db_1       0.09%               46.86MiB / 1.943GiB   2.35%               3.75MB / 3.48MB     0B / 0B             23
06b430623fc0a59df6bc2ca9cf9c7add45465c59ff3ad08e28661fe871a1687f   studyyml_sonarqube-db_1       0.02%               6.883MiB / 1.943GiB   0.35%               4.44kB / 2.44kB     0B / 0B             7