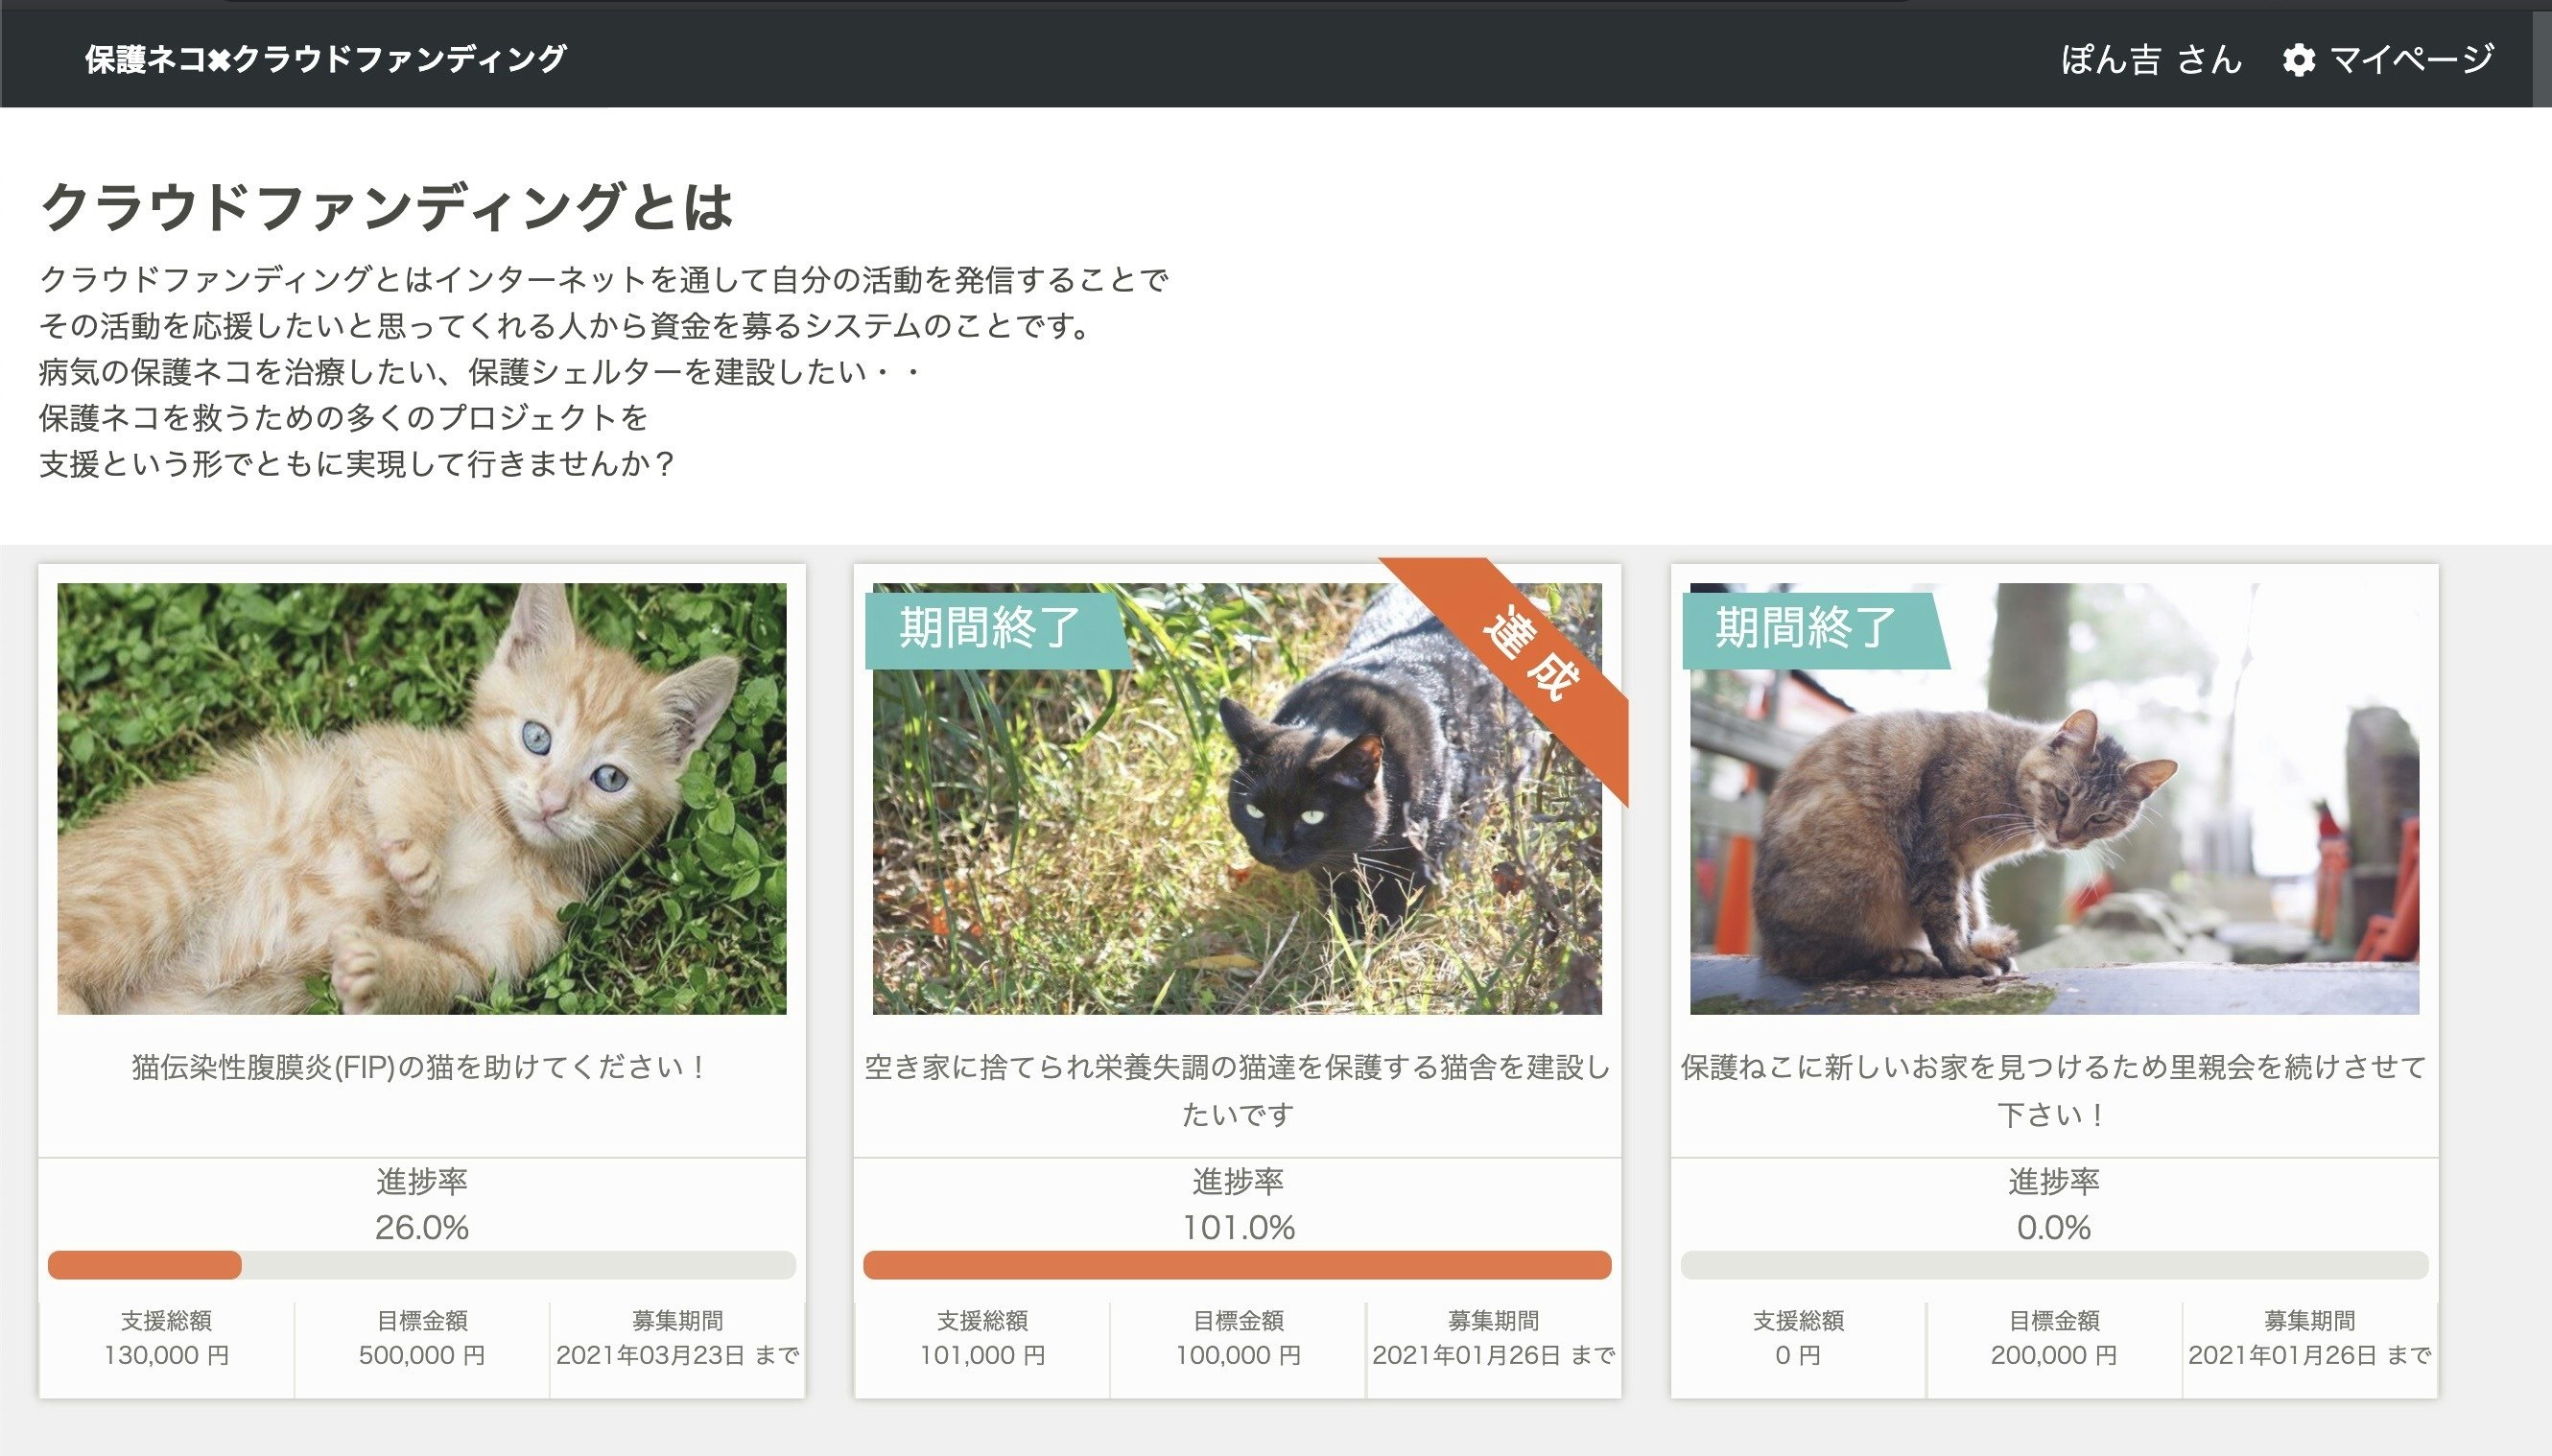
はじめに
オリジナルアプリでクラウドファンディングサイトを作成した際に、
jQueryを使って進捗率ゲージを作成したので紹介します。
前回、詳細画面での作成方法を紹介しましたが
今回は一覧表示画面での作成方法です。
詳細画面での作成はこちら→
https://qiita.com/takiguchiharuna1221/items/df517f2a9e4b74299328#comment-bd0d8efa2c7c3dc7651e
※こちらではlinear-gradientを使った別の方法も投稿していただいています。
初学者なのでより良い方法が他にもあるかもしれませんが、どなたかの参考になれば嬉しいです。
環境
・Rails 6.0.0
・Ruby 2.6.5
・jQuery
作成手順
【view】
.Contents__projects
  - @projects.each do |project|
  # 一部省略
    .Projects
      = link_to display_project_path(project.id) , class: "Box3"do
        .Box1
          = image_tag project.image.url.to_s, class: "Box1__image"
        .Box2
          %p.Box2__title= project.title
          %p.Box2__percent__contents 進捗率
          - @percent = number_to_percentage(@total.to_f/project.target_amount*100,precision: 1)
          = @percent
          .contents-pacent__box2__graph1
            .contents-pacent__box2__graph2
              %input{name: "percent", type: "hidden", value:@percent, class: 'percent' }
①ゲージを挿入したい部分にクラスを設定します。
→.contents-pacent_box2_graph2の部分
②inptを用いてDBのインスタンス変数の値を取得します。
→inputのvalueに変数を設定することでjQueryで変数を使えるようにします。
※今回は変数の詳細は割愛します。
参考記事:https://qiita.com/Kohei_Kishimoto0214/items/d919b00d75dec0699cf0
【CSS】
.contents-pacent__box2__graph2{
  background-color: #ea662d;
  height: 15px;
  border-radius: 6px;
  max-width: 100%;
}
③CSSは以上の通りです。
進捗率が100%以上になっても突き抜けてしまわないように
max-width: 100%;を設定しています。
【jQuery】
$(function() {
  $('.percent').each(function(i){
    $(this).attr('id', `percent_${i}`);
  });
  $('.contents-pacent__box2__graph2').each(function(i){
    $(this).attr('id', `graph_${i}`);
  });

  (window.onload = function() {
    var ele = document.getElementsByClassName("Projects");
    for(var i = 0; i < ele.length; i++){
      $("#graph_"+i).css({ 'width' : $( "#percent_"+ i).val() } );
    };
  });
});
④.percentと.contents-pacent__box2_graph2のそれぞれにidを振ります。
⑤リロードのタイミングでProjectsの数を数え、その回数だけ
”.contents-pacent__box2_graph2のwidthの値を@percentからとる”
を繰り返すように①で付与したidを使ってfor文で設定します。
最後に
idの使い方やfor文の設定が自分では使ったことがなかったので苦労しました。
日々勉強します。
