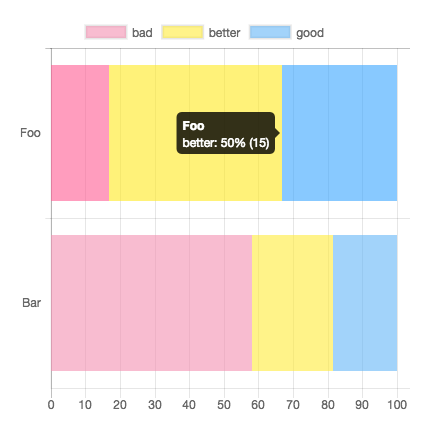
JavaScriptのグラフ描画ライブラリであるChart.js(v2.5.0)では、帯グラフ(100%積み上げ棒グラフ)を描画することはできません。純粋な積み上げ棒グラフはオプションで指定できますが、比率をグラフ化したかったのです。
幸いなことにChart.jsは簡単にpluginが書けるので、作ってみました。以下のようになります。
セットアップ
ここに書いているので、最初にプラグインをChart.jsに登録してください。
使い方
chart optionsに { stacked: '100%' } を渡すだけです。
new Chart(document.getElementById('stage'), {
  type: 'horizontalBar',
  data: {
    labels: ["Foo", "Bar"],
    datasets: [
      { label: "bad",    data: [5, 25],  backgroundColor: "rgba(244, 143, 177, 0.6)" },
      { label: "better", data: [15, 10], backgroundColor: "rgba(255, 235, 59, 0.6)" },
      { label: "good",   data: [10, 8],  backgroundColor: "rgba(100, 181, 246, 0.6)" }
    ]
  },
  options: { stacked: "100%" }
});
注意点など
- パーセンテージは小数2位を四捨五入して小数1位までとしています。そのため、全て足しても100%にならないことがあります。ただしx軸はmax100としているので、そのへんは大丈夫です。(多少はみ出るかもですが、誤差レベルかなと)
- 以下のオプションはプラグイン内で上書きしています。
- options.scales.xAxes[].stacked, options.scales.yAxes[].stacked
- options.scales.xAxes[].ticks.min, options.scales.xAxes[].ticks.max
- options.tooltips.callbacks.label
- ツールチップにはパーセンテージとカッコ内に元の数値を表示しています。
