Webでデータを見せるときによく使われているD3.jsを使ってグラフを書いていきます。
D3.jsはデータを視覚化するときに便利なJavaScriptのライブラリです。
D3とはData-Driven Documentsのことだそうです。
今回主に使用するSVGについては下記記事をご参照ください。
SVGの描画領域
SVGの扱い方
SVGの記述方法
CSSによるSVGアニメーション
JavaScriptによるSVGアニメーション
1. D3.jsを使う準備
CDNを使用する場合の例
プロジェクトフォルダ
 ├ index.html
 ├ main.js
 └ style.css
<head>
  <script src="https://d3js.org/d3.v7.min.js"></script>
  <script src="main.js" type="module"></script>
</head>
ローカルにダウンロードして使用する場合の例
https://d3js.org/d3.v7.min.js をダウンロードして任意の場所に配置し、HTMLから読み込みます。
例はmain.jsと同じ階層に配置した場合のパスです。
プロジェクトフォルダ
 ├ index.html
 ├ main.js
 ├ style.css
 └ d3.v7.min.js
<head>
  <script src="d3.v7.min.js"></script>
  <script src="main.js" type="module"></script>
</head>
2. D3.jsでできることの紹介
データの視覚化を行う前に、D3.jsの機能を紹介していきます。
2-1. HTML要素の追加や変更
| メソッド | 説明 |
|---|---|
| select("セレクタ") | HTML要素の選択(セレクタに合う最初の要素のみ) |
| selectAll("セレクタ") | HTML要素の選択(セレクタに合う全ての要素を選択) |
| style("CSSのプロパティ名",値) | CSSの操作 プロパティ名はケバブケース(ハイフンつなぎ 例:background-color)のまま |
| attr("HTMLの属性名",値) | HTML要素の属性の操作 |
| text("テキスト") | 追加する文字列の設定 |
| append(“要素”) | 子要素の追加 |
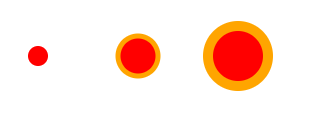
HTML要素の追加
circle要素を追加してみます。
<!DOCTYPE html>
<html lang="ja">
<head>
  <meta charset="utf-8">
  <title>circle</title>
  <script src="https://d3js.org/d3.v7.min.js"></script>
  <script src="main.js" type="module"></script>
</head>
<body>
  <svg id="svgArea"></svg>
</body>
</html>
//円の半径、X座標、線幅設定用データ
const dataset = [10, 20, 30];

d3
  //IDがsvgAreaの要素の子要素のcircle要素を全て選択
  .select("#svgArea")
  .selectAll("circle")

  //データの投入
  .data(dataset)

  //新規追加するcircle要素をDOMに反映
  .enter()

  //circle要素を追加
  .append("circle")

  //円の中心点のY座標の設定
  .attr("cy", 60)

  //円の中心点のX座標の設定
  .attr("cx", (data, index) => {
    return index * 100 + 30;
  })

  //円の半径の設定
  .attr("r", (data) => {
    return data;
  })

  //色の設定
  .style("fill", "red")
    .attr("stroke", "orange")
    .attr("stroke-width", (data, index) => {
      return index * 5;
    });
HTML要素の変更
p要素の文字色をランダムに変更してみます。
色変更前
色変更後(実行ごとに色が変わります)
<!DOCTYPE html>
<html lang="ja">
<head>
  <meta charset="utf-8">
  <title>p</title>
  <script src="https://d3js.org/d3.v7.min.js"></script>
  <script src="main.js" type="module"></script>
</head>
<body>
  <p>apple</p>
  <p>banana</p>
  <p>orange</p>
  <p>peach</p>
  </body>
</html>
//P要素全てを取得
d3.selectAll("p")

  //文字色をランダムに変更
  .style("color", () => {
    return "hsl(" + Math.random() * 360 + ",100%,50%)";
  });
2-2. データをHTML要素として反映させる
| メソッド | 説明 |
|---|---|
| data(データセット) | 使用するデータを投入 |
| enter() | 新規要素を反映(既存要素は上書きしない) |
| merge() | 新規要素、既存要素の両方とも反映 |
| exit().remove() | 不要な要素の削除を反映 |
※enterをつけないと暗黙的にupdate処理になる(updateは明示しない)
新規要素の反映
<!DOCTYPE html>
<html lang="ja">
<head>
<title>enter</title>
  <meta charset="utf-8">
  <script src="https://d3js.org/d3.v7.min.js"></script>
  <script src="main.js" type="module"></script>
</head>
<body>
  <svg id="svgArea"></svg>
</body>
</html>
//使用するデータの準備
const dataset = [5, 10, 15, 20, 25];

d3.select("#svgArea")
  .selectAll("text")
  .data(dataset)
  .enter()
  .append("text")
  .attr("y", (data) => {
    return data * 5;
  })
  .text((data,index) => {
    return `${index + 1}日目の売上は${data}万円です`;
  });
1日目の売上は5万円です //新規要素の追加
2日目の売上は10万円です //新規要素の追加
3日目の売上は15万円です //新規要素の追加
4日目の売上は20万円です //新規要素の追加
5日目の売上は25万円です //新規要素の追加
既存要素の上書き
enterの場合の挙動
まずenter()で既存の要素がある場合の挙動の確認してみます。
<!DOCTYPE html>
<html lang="ja">
<head>
  <title>enter</title>
  <meta charset="utf-8">
  <script src="https://d3js.org/d3.v7.min.js"></script>
  <script src="main.js" type="module"></script>
</head>
<body>
  <svg id="svgArea">
    <text y="25">1日目の売上は0円です</text>
    <text y="50">2日目の売上は0万円です</text>
  </svg>
</body>
</html>
//使用するデータの準備
const dataset = [5, 10, 15, 20, 25];

d3.select("#svgArea")
  .selectAll("text")
  .data(dataset)
  .enter()
  .append("text")
  .attr("y", (data) => {
    return data * 5;
  })

  .text((data,index) => {
    return `${index + 1}日目の売上は${data}万円です`;
  });
既存の要素がある場合はそのまま保持されます。
 1日目の売上は0円です//上書きされていない
 2日目の売上は0円です//上書きされていない
 3日目の売上は15万円です //新規要素の追加
 4日目の売上は20万円です //新規要素の追加
 5日目の売上は25万円です //新規要素の追加
updateの場合
enter()を書かないとupdateになります。
上書きなのでappendは不要です。
<!DOCTYPE html>
<html lang="ja">
<head>
  <title>update</title>
  <meta charset="utf-8">
  <script src="https://d3js.org/d3.v7.min.js"></script>
  <script src="main.js" type="module"></script>
</head>
<body>
  <svg id="svgArea">
    <text y="25">1日目の売上は0円です</text>
    <text y="50">2日目の売上は0円です</text>
   </svg>
 </body>
 </html>
const dataset = [5, 10, 15, 20, 25];

d3.select("#svgArea")
  .selectAll("text")
  .data(dataset)
  .attr("y", (data, index) => {
    return index * 20 + 20;
  })
  .text((data, index) => {
    return `${index + 1}日目の売上は${data}万円です`;
  });
1日目の売上は5万円です //既存要素への上書き
2日目の売上は10万円です //既存要素への上書き
//3つ目以降の要素の新規追加は行われない
新規要素の反映と既存要素の上書きをまとめて行う
<!DOCTYPE html>
<html lang="ja">
<head>
  <title>merge</title>
  <meta charset="utf-8">
  <script src="https://d3js.org/d3.v7.min.js"></script>
  <script src="main.js" type="module"></script>
  <link rel="stylesheet" href="style.css">
</head>
<body>
  <svg id="svgArea">
    <text y="25">1日目の売上は0円です</text>
    <text y="50">2日目の売上は0円です</text>
  </svg>
</body>
</html>
//使用するデータの準備
const dataset = [5, 10, 15, 20, 25];

d3.select("#svgArea")
  .selectAll("text")
  .data(dataset)
  .enter()
  .append("text")
  //既存要素への更新をマージ
  .merge(d3.select("#svgArea").selectAll("text").data(dataset))
  .attr("y", (data, index) => {
    return index * 20 + 20;
  })
  .text((data, index) => {
    return `${index + 1}日目の売上は${data}万円です`;
  });
1日目の売上は5万円です //既存要素への上書き
2日目の売上は10万円です //既存要素への上書き
3日目の売上は15万円です //新規要素の追加
4日目の売上は20万円です //新規要素の追加
5日目の売上は25万円です //新規要素の追加
不要になった要素の削除
enter、update、mergeだけでは、既存の要素の数が変更後に必要な数より多い時に不要な要素が残ってしまうので、削除が必要になります。
既存の要素の数が更新後に必要な数より多い場合にmergeで新規追加、既存更新した場合の挙動
<!DOCTYPE html>
<html lang="ja">
<head>
  <title>merge</title>
  <meta charset="utf-8">
  <script src="https://d3js.org/d3.v7.min.js"></script>
  <script src="main.js" type="module"></script>
  <link rel="stylesheet" href="style.css">
</head>
<body>
  <svg id="svgArea">
    <text y="25">1日目の売上は0円です</text>
    <text y="50">2日目の売上は0円です</text>
    <text y="60">3日目の売上は0円です</text>
    <text y="80">4日目の売上は0円です</text>
    <text y="100">5日目の売上は0円です</text>
  </svg>
</body>
</html>
//使用するデータの準備(既存5つに対して4つだけ)
const dataset = [5, 10, 15, 20];

d3.select("#svgArea")
  .selectAll("text")
  .data(dataset)
  .enter()
  .append("text")
  //既存要素への更新をマージ
  .merge(d3.select("#svgArea").selectAll("text").data(dataset))
  .attr("y", (data, index) => {
    return index * 20 + 20;
  })
  .text((data, index) => {
    return `${index + 1}日目の売上は${data}万円です`;
  });
1日目の売上は5万円です //既存要素への上書き
2日目の売上は10万円です //既存要素への上書き
3日目の売上は15万円です //既存要素への上書き
4日目の売上は20万円です //既存要素への上書き
5日目の売上は0円です //意図せず既存要素がそのまま残ってしまっている
exit().remove()を使った場合
<!DOCTYPE html>
<html lang="ja">
<head>
  <title>exit remove</title>
  <meta charset="utf-8">
  <script src="https://d3js.org/d3.v7.min.js"></script>
  <script src="main.js" type="module"></script>
  <link rel="stylesheet" href="style.css">
</head>
<body>
  <svg id="svgArea">
    <text y="25">1日目の売上は0円です</text>
    <text y="50">2日目の売上は0円です</text>
    <text y="60">3日目の売上は0円です</text>
    <text y="80">4日目の売上は0円です</text>
    <text y="100">5日目の売上は0円です</text>
  </svg>
</body>
</html>
//使用するデータの準備
const dataset = [5, 10, 15, 20];

d3.select("#svgArea")
  .selectAll("text")
  .data(dataset)
  .enter()
  .append("text")

  //既存要素への更新をマージ
  .merge(d3.select("#svgArea").selectAll("text").data(dataset))
  .attr("y", (data, index) => {
    return index * 20 + 20;
  })
  .text((data, index) => {
    return `${index + 1}日目の売上は${data}万円です`;
  });

d3
  .select("#svgArea")
  .selectAll("text")
  .data(dataset)

  //既存要素で余分なものを削除
  .exit().remove();
1日目の売上は5万円です //既存要素への上書き
2日目の売上は10万円です //既存要素への上書き
3日目の売上は15万円です //既存要素への上書き
4日目の売上は20万円です //既存要素への上書き
//不要だった5つ目の要素が消えている
2-3. 外部からデータを取得する
CSV
プロジェクトフォルダ
 ├ index.html
 ├ main.js
 ├ style.css
 └ resource.csv
<!DOCTYPE html>
<html lang="ja">
<head>
  <meta charset="utf-8">
  <title>CSV</title>
  <script src="https://d3js.org/d3.v7.min.js"></script>
  <script src="main.js" type="module"></script>
</head>
<body>
  <svg id="svgArea"></svg>
</body>
</html>
fruit,price
apple,400
banana,300
orange,300
peach,700
d3.csv("resource.csv")
  .then((data) => console.log(data))
  .catch((error) => console.log(error))
取得したデータ
{fruit: 'apple', price: '400'}
{fruit: 'banana', price: '300'}
{fruit: 'orange', price: '300'}
{fruit: 'peach', price: '700'}
JSON
プロジェクトフォルダ
 ├ index.html
 ├ main.js
 ├ style.css
 └ resource.json
<!DOCTYPE html>
<html lang="ja">
<head>
  <meta charset="utf-8">
  <title>json</title>
  <script src="https://d3js.org/d3.v7.min.js"></script>
  <script src="main.js" type="module"></script>
</head>
<body>
  <svg id="svgArea"></svg>
</body>
</html>
[
  {
    "fruit": "apple",
    "price": 400
  },
  {
    "fruit": "banana",
    "price": 300
  },
  {
    "fruit": "orange",
    "price": 300
  },
  {
    "fruit": "peach",
    "price": 700
  }
]
d3.json("resource.json")
  .then((data) => console.log(data))
  .catch((error) => console.log(error));
取得したデータ
{fruit: 'apple', price: 400}
{fruit: 'banana', price: 300}
{fruit: 'orange', price: 300}
{fruit: 'peach', price: 700}
2-4. アニメーション

| メソッド | 説明 |
|---|---|
| transition() | アニメーションの設定開始 |
| duration() | アニメーションの最初から最後までにかける時間の設定 |
| ease() | アニメーションのイージングの種類の設定 |
| delay() | アニメーションの開始をどれだけ遅延させるかの設定 |
<!DOCTYPE html>
<html lang="ja">
<head>
  <title>animation</title>
  <meta charset="utf-8">
  <meta name="viewport" content="width=device-width, initial-scale=1.0">
  <script src="https://d3js.org/d3.v7.min.js"></script>
  <script src="main.js" type="module"></script>
</head>
<body>
  <svg id="svgArea"></svg>
</body>
</html>
circle要素を移動させる
d3
  //IDがsvgAreaの要素を選択
  .select("#svgArea")

  //circle要素を追加
  .append("circle")

  //circle要素の中心点のX座標を30に設定
  .attr("cx", 30)

  //circle要素の中心点のY座標を70に設定
  .attr("cy", 70)

  //circle要素の半径を20に設定
  .attr("r", 20)

  //塗りの色を赤に設定
  .style("fill", "red")

  //アニメーションの設定開始
  .transition()

  //アニメーションにかける時間を1000ミリ秒に設定
  .duration(1000)

  //イージングをeaseSinOutに設定
  .ease(d3.easeSinOut)

  //アニメーションの終点の中心点のX座標を200に設定
  .attr("cx", 200)

  //アニメーションの設定開始
  .transition()

  //アニメーションにかける時間を1000ミリ秒に設定
  .duration(1000)

  //イージングをeaseSinOutに設定
  .ease(d3.easeExpIn)

  //アニメーションの終点の中心点のY座標を200に設定
  .attr("cy", 200);
イージング
イージングの種類
- d3.easeLinear
- d3.easePolyIn
- d3.easePolyOut
- d3.easePoly(d3.easePolyInOut)
- d3.easeQuadIn
- d3.easeQuadOut
- d3.easeQuad(d3.easeQuadInOut)
- d3.easeCubicIn
- d3.easeCubicOut
- d3.easeCubic(d3.easeCubicInOut)
- d3.easeSinIn Sin
- d3.easeSinOut
- d3.easeSin(d3.easeSinInOut)
- d3.easeExpIn
- d3.easeExpOut
- d3.easeExp(d3.easeExpInOut)
- d3.easeCircleIn
- d3.easeCircleOut
- d3.easeCircle(d3.easeCircleInOut)
- d3.easeElasticIn
- d3.easeElastic(d3.easeElasticOut)
- d3.easeElasticInOut
- d3.easeBackIn
- d3.easeBackOut
- d3.easeBack(d3.easeBackInOut)
- d3.easeBounceIn Bounce
- d3.easeBounce(d3.easeBounceOut)
- d3.easeBounceInOut
各イージングのinの実際の動き
<!DOCTYPE html>
<html lang="ja">
<head>
  <title>easing</title>
  <meta charset="utf-8">
  <script src="https://d3js.org/d3.v7.min.js"></script>
  <script src="main.js" type="module"></script>
  <link rel="stylesheet" href="style.css">
</head>
<body>
  <p>sin</p>
  <svg id="sin"></svg>

  <p>quad</p>
  <svg id="quad"></svg>

  <p>poly</p>
  <svg id="poly"></svg>

  <p>cubic</p>
  <svg id="cubic"></svg>

  <p>circle</p>
  <svg id="circle"></svg>

  <p>exp</p>
  <svg id="exp"></svg>

</body>
</html>
//Sin
d3
  //SVG要素の選択と背景色の設定
  .select("#sin")
  .style("background-color", "#F2F2F2")

  //circle要素の選択
  .selectAll("circle")
  .data([{ positionX: 100, positionY: 10, radius: 10 }])
  .enter()
  .append("circle")
  .attr("cx", (data) => {
    return data.positionX;
  })
   .attr("cy", (data) => {
     return data.positionY;
   })
   .attr("r", (data) => {
     return data.radius;
   })
   .style("fill", "red")

   //circle要素のアニメーションの作成
   .transition()
   .duration(2000)
   .delay(1000)
   .ease(d3.easeSinIn)
   .attr("cx", 990);

 //Quad
 d3
   //SVG要素の選択と背景色の設定
   .select("#quad")
   .style("background-color", "#F2F2F2")

   //circle要素の作成
   .selectAll("circle")
   .data([{ positionX: 100, positionY: 10, radius: 10 }])
   .enter()
   .append("circle")
   .attr("cx", (data) => {
     return data.positionX;
   })
   .attr("cy", (data) => {
     return data.positionY;
   })
   .attr("r", (data) => {
     return data.radius;
   })
   .style("fill", "red")

   //circle要素のアニメーションの作成
   .transition()
   .duration(2000)
   .delay(1000)
   .ease(d3.easeQuadIn)
   .attr("cx", 990);

 //Poly
 d3
   //SVG要素の選択と背景色の設定
   .select("#poly")
   .style("background-color", "#F2F2F2")

   //circle要素の選択
   .selectAll("circle")
   .data([{ positionX: 100, positionY: 10, radius: 10 }])
   .enter()
   .append("circle")
   .attr("cx", (data) => {
     return data.positionX;
   })
   .attr("cy", (data) => {
     return data.positionY;
   })
   .attr("r", (data) => {
     return data.radius;
   })
   .style("fill", "red")

   //circle要素のアニメーションの作成
   .transition()
   .duration(2000)
   .delay(1000)
   .ease(d3.easePolyIn)
   .attr("cx", 990);

 //Cubic
 d3
   //SVG要素の選択と背景色の設定
   .select("#cubic")
   .style("background-color", "#F2F2F2")

   //circle要素の作成
   .selectAll("circle")
   .data([{ positionX: 100, positionY: 10, radius: 10 }])
   .enter()
   .append("circle")
   .attr("cx", (data) => {
     return data.positionX;
   })
   .attr("cy", (data) => {
     return data.positionY;
   })
   .attr("r", (data) => {
     return data.radius;
   })
   .style("fill", "red")

   //circle要素のアニメーションの作成
   .transition()
   .duration(2000)
   .delay(1000)
   .ease(d3.easeCubicIn)
   .attr("cx", 990);

 //Circle
 d3
   //SVG要素の選択と背景色の設定
   .select("#Circle")
   .style("background-color", "#F2F2F2")

   //circle要素の作成
   .selectAll("circle")
   .data([{ positionX: 100, positionY: 10, radius: 10 }])
   .enter()
   .append("circle")
   .attr("cx", (data) => {
     return data.positionX;
   })
   .attr("cy", (data) => {
     return data.positionY;
   })
   .attr("r", (data) => {
     return data.radius;
   })
   .style("fill", "red")

   //circle要素のアニメーションの作成
   .transition()
   .duration(2000)
   .delay(1000)
   .ease(d3.easeCircleIn)
   .attr("cx", 990);

 //Exp
 d3
   //SVG要素の選択と背景色の設定
   .select("#Exp")
   .style("background-color", "#F2F2F2")

   //circle要素の作成
   .selectAll("exp")
   .data([{ positionX: 100, positionY: 10, radius: 10 }])
   .enter()
   .append("circle")
   .attr("cx", (data) => {
     return data.positionX;
   })
   .attr("cy", (data) => {
     return data.positionY;
   })
   .attr("r", (data) => {
     return data.radius;
   })
   .style("fill", "red")

   //circle要素のアニメーションの作成
   .transition()
   .duration(2000)
   .delay(1000)
   .ease(d3.easeExpIn)
   .attr("cx", 990);
svg {
  width: 1000px;
  height: 20px;
}
Elasticの振幅と周期を変更する
| メソッド | 説明 | デフォルト値 |
|---|---|---|
| amplitude() | 振幅の大きさを変更 | 1 |
| period() | 周期の長さを変更 | 3 |
使用可能なイージング
- d3.easeElasticIn
- d3.easeElasticOut
- d3.easeElastic(d3.easeElasticInOut)
//d3.easeElasticInと等価
d3.easeElasticIn.amplitude(1).period(0.3);
<!DOCTYPE html>
<html lang="ja">
  <title>elastic</title>
  <meta charset="utf-8">
  <meta name="viewport" content="width=device-width, initial-scale=1.0">
  <script src="https://d3js.org/d3.v7.min.js"></script>
     <script src="main.js" type="module"></script>
  <link rel="stylesheet" href="style.css">
</head>
<body>
  <p>elastic(default)</p>
  <svg id="elasticDefault"></svg>

  <p>elastic(激しい)</p>
  <svg id="elasticIntense"></svg>

  <p>elastic(穏やか)</p>
  <svg id="elasticCalm"></svg>

</body>
</html>
//elasticDefault
d3
  //SVG要素の選択と背景色の設定
  .select("#elasticDefault")
  .style("background-color", "#F2F2F2")

  //circle要素の作成
  .selectAll("circle")
  .data([{ positionX: 10, positionY: 10, radius: 10 }])
  .enter()
  .append("circle")
  .attr("cx", (data) => {
    return data.positionX;
  })
  .attr("cy", (data) => {
    return data.positionY;
  })
  .attr("r", (data) => {
    return data.radius;
  })
  .style("fill", "red")

  //circle要素のアニメーションの作成
  .transition()
  .duration(2000)
  .delay(1000)
  .ease(d3.easeElastic)
  .attr("cx", 990);

 //elasticIntense
 d3
  //SVG要素の選択と背景色の設定
  .select("#elasticIntense")
  .style("background-color", "#F2F2F2")

  //circle要素の作成
  .selectAll("circle")
  .data([{ positionX: 10, positionY: 10, radius: 10 }])
  .enter()
  .append("circle")
  .attr("cx", (data) => {
    return data.positionX;
  })
  .attr("cy", (data) => {
    return data.positionY;
  })
  .attr("r", (data) => {
    return data.radius;
  })
  .style("fill", "red")

  //circle要素のアニメーションの作成
  .transition()
  .duration(2000)
  .delay(1000)
  .ease(d3.easeElastic.amplitude(10).period(0.1))
  .attr("cx", 990);

//elasticCalm
d3
  //SVG要素の選択と背景色の設定
  .select("#elasticCalm")
  .style("background-color", "#F2F2F2")

  //circle要素の作成
  .selectAll("circle")
  .data([{ positionX: 10, positionY: 10, radius: 10 }])
  .enter()
  .append("circle")
  .attr("cx", (data) => {
    return data.positionX;
  })
  .attr("cy", (data) => {
    return data.positionY;
  })
  .attr("r", (data) => {
    return data.radius;
  })
  .style("fill", "red")

  //circle要素のアニメーションの作成
  .transition()
  .duration(2000)
  .delay(1000)
  .ease(d3.easeElastic.amplitude(1).period(1))
  .attr("cx", 990);
svg {
  width: 1000px;
  height: 20px;
}
Backのオーバーシュート量を変更する
| メソッド | 説明 | デフォルト値 |
|---|---|---|
| overshoot() | Backのオーバーシュートを変更する | 1.70158 |
使用可能なイージング
- d3.easeBackIn
- d3.easeBackOut
- d3.easeBack(d3.easeBackInOut)
//d3.easeBackInと等価
d3.easeBackIn.overshoot(1.70158);
<!DOCTYPE html>
<html lang="ja">
  <title>overshoot</title>
  <meta charset="utf-8">
  <script src="https://d3js.org/d3.v7.min.js"></script>
  <script src="main.js" type="module"></script>
  <link rel="stylesheet" href="style.css">
</head>
<body>
  <p>backback(default1.70158)</p>
  <svg id="backDefault"></svg>

  <p>back(2倍)</p>
  <svg id="backTwice"></svg>

  <p>back(バックなし)</p>
  <svg id="backZero"></svg>

</body>
</html>
//backDefault
d3
  //SVG要素の選択と背景色の設定
  .select("#backDefault")
  .style("background-color", "#F2F2F2")

  //circle要素の作成
  .selectAll("circle")
  .data([{ positionX: 300, positionY: 10, radius: 10 }])
  .enter()
  .append("circle")
  .attr("cx", (data) => {
    return data.positionX;
  })
  .attr("cy", (data) => {
    return data.positionY;
  })
  .attr("r", (data) => {
    return data.radius;
  })
  .style("fill", "red")
  //circle要素のアニメーションの作成
  .transition()
  .duration(2000)
  .delay(1000)
  .ease(d3.easeBackIn)
  .attr("cx", 990);

//backTwice
d3
  //SVG要素の選択と背景色の設定
  .select("#backTwice")
  .style("background-color", "#F2F2F2")

  //circle要素の作成
  .selectAll("circle")
  .data([{ positionX: 300, positionY: 10, radius: 10 }])
  .enter()
  .append("circle")
  .attr("cx", (data) => {
    return data.positionX;
  })
  .attr("cy", (data) => {
    return data.positionY;
  })
  .attr("r", (data) => {
    return data.radius;
  })
  .style("fill", "red")

  //circle要素のアニメーションの作成
  .transition()
  .duration(2000)
  .delay(1000)
  .ease(d3.easeBackIn.overshoot(3.4))
  .attr("cx", 990);

//backZero
d3
  //SVG要素の選択と背景色の設定
  .select("#backZero")
  .style("background-color", "#F2F2F2")

  //circle要素の作成
  .selectAll("circle")
  .data([{ positionX: 300, positionY: 10, radius: 10 }])
  .enter()
  .append("circle")
  .attr("cx", (data) => {
    return data.positionX;
  })
  .attr("cy", (data) => {
    return data.positionY;
  })
  .attr("r", (data) => {
    return data.radius;
  })
  .style("fill", "red")

  //circle要素のアニメーションの作成
  .transition()
  .duration(2000)
  .delay(1000)
  .ease(d3.easeBackIn.overshoot(0))
  .attr("cx", 990);
svg {
  width: 1000px;
  height: 20px;
 }
Polyの曲がり具合を変更する
| メソッド | 説明 | デフォルト値 |
|---|---|---|
| exponent() | Polyの曲がり具合を変更する | 3 |
※1の場合は直線
使用可能なイージング
- d3.easePolyIn
- d3.easePolyOut
- d3.easePoly(d3.easePolyInOut)
//d3.easePolyInと等価
d3.easePolyIn.exponent(3);
<!DOCTYPE html>
<html lang="ja">
  <title>poly</title>
  <meta charset="utf-8">
  <meta name="viewport" content="width=device-width, initial-scale=1.0">
  <script src="https://d3js.org/d3.v7.min.js"></script>
  <script src="main.js" type="module"></script>
  <link rel="stylesheet" href="style.css">
</head>
<body>
  <p>poly(default)</p>
  <svg id="polyDefault"></svg>

  <p>poly(2倍)</p>
  <svg id="polyTwice"></svg>

  <p>poly(直線)</p>
  <svg id="polyLiner"></svg>

</body>
</html>
//polyDefault
d3
  //SVG要素の選択と背景色の設定
  .select("#polyDefault")
  .style("background-color", "#F2F2F2")

  //circle要素の作成
  .selectAll("circle")
  .data([{ positionX: 100, positionY: 10, radius: 10 }])
  .enter()
  .append("circle")
  .attr("cx", (data) => {
    return data.positionX;
  })
  .attr("cy", (data) => {
    return data.positionY;
  })
  .attr("r", (data) => {
    return data.radius;
  })
  .style("fill", "red")

  //circle要素のアニメーションの作成
  .transition()
  .duration(2000)
  .delay(1000)
  .ease(d3.easePolyIn)
  .attr("cx", 990);

//polyTwice
d3
  //SVG要素の選択と背景色の設定
  .select("#polyTwice")
  .style("background-color", "#F2F2F2")

  //circle要素の作成
  .selectAll("circle")
  .data([{ positionX: 100, positionY: 10, radius: 10 }])
  .enter()
  .append("circle")
  .attr("cx", (data) => {
    return data.positionX;
  })
  .attr("cy", (data) => {
    return data.positionY;
  })
  .attr("r", (data) => {
    return data.radius;
  })
  .style("fill", "red")

  //circle要素のアニメーションの作成
  .transition()
  .duration(2000)
  .delay(1000)
  .ease(d3.easePolyIn.exponent(6))
  .attr("cx", 990);

//polyZero
d3
  //SVG要素の選択と背景色の設定
  .select("#polyLiner")
  .style("background-color", "#F2F2F2")

  //circle要素の作成
  .selectAll("circle")
  .data([{ positionX: 100, positionY: 10, radius: 10 }])
  .enter()
  .append("circle")
  .attr("cx", (data) => {
    return data.positionX;
  })
  .attr("cy", (data) => {
    return data.positionY;
  })
  .attr("r", (data) => {
    return data.radius;
  })
  .style("fill", "red")

  //circle要素のアニメーションの作成
  .transition()
  .duration(2000)
  .delay(1000)
  .ease(d3.easePolyIn.exponent(1))
  .attr("cx", 990);
svg {
  width: 1000px;
  height: 20px;
}
2-5. イベント
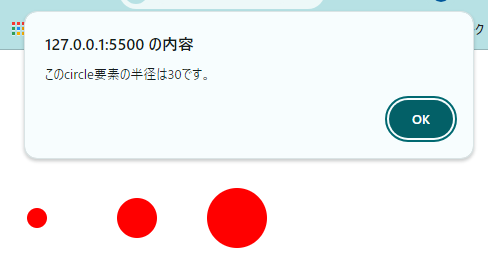
クリックイベント
円をクリックしたとき、アラートで半径を表示してみます。
<!DOCTYPE html>
<html lang="ja">
<head>
  <meta charset="utf-8">
  <title>event</title>
  <script src="https://d3js.org/d3.v7.min.js"></script>
  <script src="main.js" type="module"></script>
</head>
<body>
  <svg id="svgArea"></svg>
</body>
</html>
//円の半径、X軸の座標設定用データ
const dataset = [10, 20, 30];

d3.select("#svgArea")
  //svg要素の子要素のcircle要素を全て選択
  .selectAll("circle")

  //データ
  .data(dataset)

  //新規追加するcircle要素をDOMに反映
  .enter()

  //circle要素を追加
  .append("circle")

  //円の中心点のY座標の設定
  .attr("cy", 60)

  //円の中心点のX座標の設定
  .attr("cx", (data, index) => {
    return index * 100 + 30;
  })

  //円の半径の設定
  .attr("r", (data) => {
    return data;
  })

  // 塗りつぶす色の設定
  .style("fill", "red")

  //circle要素をクリックすると、半径を表示
  .on("click", function (event, data) {
    alert(`このcircle要素の半径は${data}です。`);
  });
3. データの視覚化
今回のメインであるデータの視覚化を行っていきます。
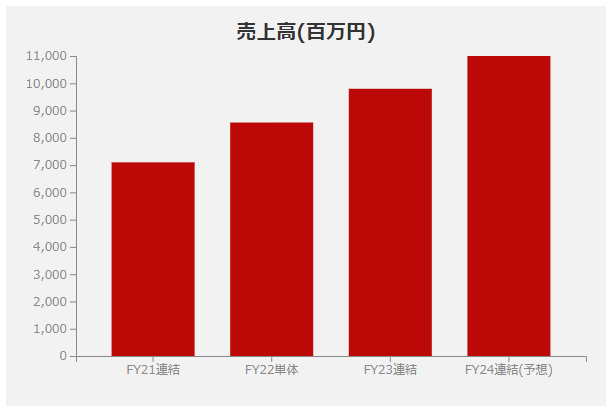
3-1.棒グラフ
| メソッド | 説明 |
|---|---|
| domain() | ラベルの設定 |
| max() | 配列の最大値を返す |
| min() | 配列の最小値を返す |
| range() | 範囲の設定 |
| rangeRound() | 範囲の設定(四捨五入) |
| scaleband() | 入力値を幅にスケール変換 |
| scaleLinear() | 入力値を直線的にスケール変換 |
| axisBottom() | 下側の軸に設定 |
| axisTop() | 上側の軸に設定 |
| axisRight() | 右側の軸に設定 |
| axisLeft() | 左側の軸に設定 |
<!DOCTYPE html>
<html>
<head>
  <title>bar graph</title>
  <meta charset="utf-8">
  <script src="https://d3js.org/d3.v7.min.js"></script>
  <script src="main.js" type="module"></script>
  <link rel="stylesheet" href="style.css">
</head>
<body>
  <svg id="svgArea"></svg>
</body>
</html>
//データの準備
const dataset = [
  { name: "FY21連結", value: 7101 },
  { name: "FY22単体", value: 8561 },
  { name: "FY23連結", value: 9798 },
  { name: "FY24連結(予想)", value: 11000 },
];

//SVG領域の大きさの設定
const svgAreaEntireWidth = 600;
const svgAreaEntireHeight = 400;

//SVG領域内の(メモリなどを除いた)グラフ部分の設定
const svgAreaPadding = { top: 50, right: 20, bottom: 50, left: 70 };

//パディングを除いたグラフ描画領域の幅を設定
const svgAreaGraphWidth =
  svgAreaEntireWidth - (svgAreaPadding.left + svgAreaPadding.right);

//パディングを除いたグラフ描画領域の高さを設定
const svgAreaGraphHeight =
  svgAreaEntireHeight - (svgAreaPadding.top + svgAreaPadding.bottom);

//棒グラフの間隔
const barGap = 0.3;

//タイトルの位置調整
const graphTitlePositionAjust = 3;

//グラフの全体設定
const svgArea = d3
  .select("#svgArea")

  .attr("width", svgAreaEntireWidth)
  .attr("height", svgAreaEntireHeight)

  // 余白を適用するためのグループを作成
  .append("g")

  //左、上パディング分移動
  .attr(
    "transform",
    "translate(" + svgAreaPadding.left + "," + svgAreaPadding.top + ")"
  );

//X軸の準備
const xScale = d3
  .scaleBand()

  //グラフのラベルとしてdatasetのnameを設定
  .domain(
    dataset.map((data) => {
      return data.name;
    })
  )

  //SVG領域のグラフ部分の幅の設定(x軸は最小、最大の順で設定)
  .range([0, svgAreaGraphWidth])

  //棒グラフの間隔の設定(増減させると棒が細くなったり太くなったりする)
  .padding(barGap);

//下にX軸を追加
const xAxis = d3.axisBottom(xScale);

svgArea
  //SVG領域の最後の子要素として、グループ要素を追加
 .append("g")

  //クラス「graphScale」を追加
  .attr("class", "graphScale")

  //左上が(0,0)なので X軸をグラフの下部に表示するには、描画領域の高さ分下げる
  .attr("transform", "translate(0," + svgAreaGraphHeight + ")")

  //scaleBandを設定
  .call(xAxis);

//Y軸の準備
const yScale = d3
  .scaleLinear()

  //スケール作成のためにdatasetのvalueの値の最小値と最大値を設定(今回は0から11000)
  .domain([
    0,
    d3.max(dataset, (data) => {
      return data.value;
    }),
  ])

  //Y軸は最大、最小の順で設定
  .range([svgAreaGraphHeight, 0]);

  //グラフの左にY軸を追加
  const yAxis = d3.axisLeft(yScale);

svgArea
  //SVG領域の最後の子要素としてグループ要素を追加
  .append("g")

  //クラス「graphScale」を追加
  .attr("class", "graphScale")
  .call(yAxis)

  //タイトル用のテキストを追加
  .append("text")
  .attr("class", "graphTitle")
  .attr("x", svgAreaEntireWidth / 2 - svgAreaPadding.left)
  .attr("y", -svgAreaPadding.top / graphTitlePositionAjust)
  .text("売上高(百万円)");

//グラフを描画
svgArea

  //クラス「bar」が付与されている要素全てを選択
  .selectAll(".bar")

  //データセットの投入
  .data(dataset)
  .enter()

  //最後の子要素としてrect要素追加
  .append("rect")

  //追加するrect要素にクラス「bar」を付与
  .attr("class", "bar")

  //属性xにnameの値を入れる
  .attr("x", (data) => {
    return xScale(data.name);
  })

  //棒グラフの幅の設定
  .attr("width", xScale.bandwidth())

  //棒グラフの高さの設定
  .attr("height", (data) => {
    return svgAreaGraphHeight - yScale(data.value);
  })
  .attr("y", (data) => {
    return yScale(data.value);
  });
#svgArea {
  background-color: #f2f2f2;
}

.bar {
  fill: #bb0907;
}

.graphScale {
  font: 12px sans-serif;
  color: #888;
}

.graphTitle {
  font: 20px sans-serif;
  fill: #333;
  text-anchor: middle;
  font-weight: bold;
}
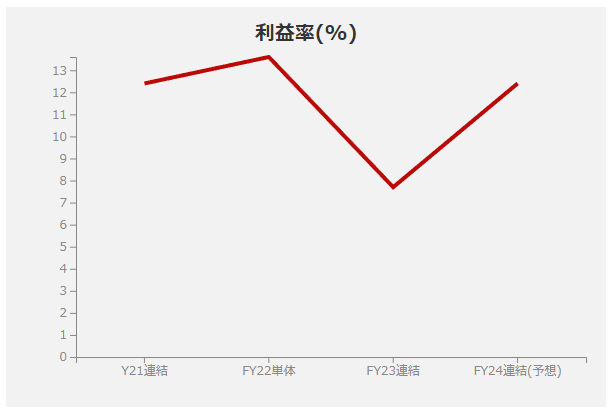
3-2. 折れ線グラフ
<!DOCTYPE html>
<html>
<head>
  <title>line graph</title>
  <meta charset="utf-8">
  <script src="https://d3js.org/d3.v7.min.js"></script>
  <script src="main.js" type="module"></script>
  <link rel="stylesheet" href="style.css">
</head>
<body>
  <svg id="svgArea"></svg>
</body>
</html>
// データの準備
const dataset = [
  ["Y21連結", 12.4],
  ["FY22単体", 13.6],
  ["FY23連結", 7.7],
  ["FY24連結(予想)", 12.4],
];

// SVG領域の大きさの設定
const svgAreaEntireWidth = 600;
const svgAreaEntireHeight = 400;

// SVG領域内の(メモリなどを除いた)グラフ部分の設定
const svgAreaPadding = { top: 50, right: 20, bottom: 50, left: 70 };

// パディングを除いたグラフ描画領域の幅を設定
const svgAreaGraphWidth =
  svgAreaEntireWidth - (svgAreaPadding.left + svgAreaPadding.right);

// パディングを除いたグラフ描画領域の高さを設定
const svgAreaGraphHeight =
  svgAreaEntireHeight - (svgAreaPadding.top + svgAreaPadding.bottom);

//タイトルの位置調整
const graphTitlePositionAjust = 3;

// グラフの全体設定
const svgArea = d3
  .select("#svgArea")
  .attr("width", svgAreaEntireWidth)
  .attr("height", svgAreaEntireHeight)
  .append("g")
  .attr(
    "transform",
    "translate(" + svgAreaPadding.left + "," + svgAreaPadding.top + ")"
  );

// X軸の準備
const xScale = d3
  .scaleBand()
  .domain(dataset.map((data) => data[0]))
  .range([0, svgAreaGraphWidth])
  .padding(0.1);

// X軸を追加
const xAxis = d3.axisBottom(xScale);

svgArea
  .append("g")
  .attr("class", "graphScale")
  .attr("transform", "translate(0," + svgAreaGraphHeight + ")")
  .call(xAxis);

// Y軸の設定
const yScale = d3
  .scaleLinear()
  .domain([0, d3.max(dataset, (data) => data[1])])
  .range([svgAreaGraphHeight, 0]);

// Y軸を追加
const yAxis = d3.axisLeft(yScale);

svgArea
  .append("g")
  .attr("class", "graphScale")
  .call(yAxis)

  //タイトル追加
  .append("text")
  .attr("class", "graphTitle")
  .attr("x", svgAreaEntireWidth / 2 - svgAreaPadding.left)
  .attr("y", -svgAreaPadding.top / graphTitlePositionAjust)
  .text("利益率(%)");

// グラフを描画
const line = svgArea
  .append("path")
  .datum(dataset)
  .attr("class", "line")
  .attr(
    "d",
    d3
      .line()
      .x((data) => {
        return xScale(data[0]) + xScale.bandwidth() / 2;
      })
      .y((data)=> {
        return yScale(data[1]);
      })
  );
#svgArea {
  background-color: #f2f2f2;
}

.line {
  stroke: #bb0907;
  stroke-width: 4;
  fill: none;
}

.graphScale {
  font: 12px sans-serif;
  color: #888;
}

.graphTitle {
  font: 20px sans-serif;
  fill: #333;
  text-anchor: middle;
  font-weight: bold;
}
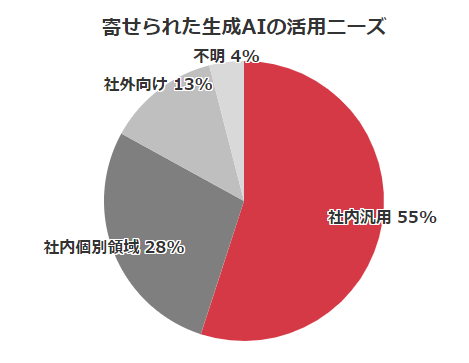
3-3. 円グラフ
<!DOCTYPE html>
<html>
<head>
  <title>pie chart</title>
  <meta charset="utf-8">
  <script src="https://d3js.org/d3.v7.min.js"></script>
  <script src="main.js" type="module"></script>
  <link rel="stylesheet" href="style.css">
</head>
<body>
  <svg id="svgArea"></svg>
</body>
</html>
//データの準備
const dataset = [
  { name: "社内汎用", value: 55 },
  { name: "社内個別領域", value: 28 },
  { name: "社外向け", value: 13 },
  { name: "不明", value: 4 },
];

//SVG領域の大きさの設定
const svgAreaEntireWidth = 600;
const svgAreaEntireHeight = 400;

//SVG領域内の(メモリなどを除いた)グラフ部分の設定
const svgAreaPadding = { top: 50, right: 50, bottom: 50, left: 50 };

//パディングを除いたグラフ描画領域の幅を設定
const svgAreaGraphWidth = svgAreaEntireWidth - (svgAreaPadding.left + svgAreaPadding.right);

//パディングを除いたグラフ描画領域の高さを設定
const svgAreaGraphHeight = svgAreaEntireHeight - (svgAreaPadding.top + svgAreaPadding.bottom);

//タイトルの位置調整
const graphTitlePositionAjust = 3;

// 円の半径
const radius = Math.min(svgAreaGraphWidth, svgAreaGraphHeight) / 2 - 10;

// 色の設定
const color = d3
  .scaleOrdinal()
  .range(["#d43945", "#7f7f7f", "#bfbfbf", "#d9d9d9"]);

// 円グラフ関数
const pie = d3
  .pie()
  .value((data) => {
    return data.value;
  })
  .sort(null);

//グラフの全体設定
const svgArea = d3
  .select("#svgArea")
  .attr("width", svgAreaEntireWidth)
  .attr("height", svgAreaEntireHeight)

  // 余白を適用するためのグループを作成(適用された属性は子要素に継承される)
  .append("g")

  //左、上パディング分移動
  .attr(
    "transform",
    "translate(" + svgAreaPadding.left + "," + svgAreaPadding.top + ")"
  );

const arcGroup = svgArea
  .append("g")
  .attr(
    "transform",
    "translate(" + svgAreaGraphWidth / 2 + "," + svgAreaGraphHeight / 2 + ")"
  );

//グラフを描画

// 円グラフへのデータ設定
const pieChart = arcGroup
  .selectAll(".pie")
  .data(pie(dataset))
  .enter()
  .append("g")
  .attr("class", "pie");

const arc = d3.arc().outerRadius(radius).innerRadius(0);

pieChart
  .append("path")
  .attr("d", arc)
  .attr("fill", (data) => {
    return color(data.index);
  })
  .attr("opacity", 1);

// 円グラフにテキスト追加
const textPosition = d3.arc().outerRadius(radius).innerRadius(radius);

pieChart
  .append("text")
  .attr("transform", (data) => {
    return "translate(" + textPosition.centroid(data) + ")";
  })
  .attr("class", "arcInfomation")
  .text((data) => {
    return data.data.name + " " + data.data.value + "%";
  });

//タイトル
svgArea
  .append("text")
  .attr("class", "graphTitle")
  .attr("x", svgAreaEntireWidth / 2 - svgAreaPadding.left)
  .attr("y", -svgAreaPadding.top / graphTitlePositionAjust)
  .text("寄せられた生成AIの活用ニーズ");
.arcInfomation {
  fill: #333;
  font-size: 16px;
  text-anchor: middle;
  font-weight: bold;
  text-shadow: 1px 1px 0 #fff, -1px -1px 0 #fff, -1px 1px 0 #fff,
  1px -1px 0 #fff, 0px 1px 0 #fff, 0-1px 0 #fff, -1px 0 0 #fff, 1px 0 0 #fff;
}

.graphTitle {
  font: 20px sans-serif;
  fill: #333;
  text-anchor: middle;
  font-weight: bold;
}
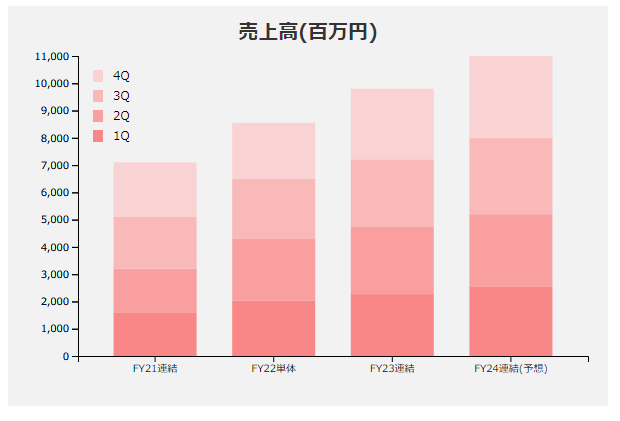
3-4. 積み上げ棒グラフ
<!DOCTYPE html>
<html>
<head>
  <meta charset="utf-8">
  <title>Stacked Bar Chart</title>
  <script src="https://d3js.org/d3.v7.min.js"></script>
  <script src="main.js" type="module"></script>
  <link rel="stylesheet" href="style.css">
</head>
<body>
  <svg id="svgArea"></svg>
</body>
</html>
//SVG領域の大きさの設定
const svgAreaEntireWidth = 600;
const svgAreaEntireHeight = 400;

//SVG領域内の(メモリなどを除いた)グラフ部分の設定
const svgAreaPadding = { top: 50, right: 20, bottom: 50, left: 70 };

//パディングを除いたグラフ描画領域の幅を設定
const svgAreaGraphWidth = svgAreaEntireWidth - (svgAreaPadding.left + svgAreaPadding.right);

//パディングを除いたグラフ描画領域の高さを設定
const svgAreaGraphHeight = svgAreaEntireHeight - (svgAreaPadding.top + svgAreaPadding.bottom);

//棒グラフの間隔
const barGap = 0.3;

//タイトルの位置調整
const graphTitlePositionAjust = 3;

//グラフの全体設定
const svgArea = d3
  .select("#svgArea")
  .attr("width", svgAreaEntireWidth)
  .attr("height", svgAreaEntireHeight)

  // 余白を適用するためのグループを作成(適用された属性は子要素に継承される)
  .append("g")

  //左、上パディング分移動
  .attr(
    "transform",
    "translate(" + svgAreaPadding.left + "," + svgAreaPadding.top + ")"
  );

//データ
const dataset = [
  {
    group: "FY21連結",
    quater1: 1579,
    quater2: 1624,
    quater3: 1895,
    quater4: 2003,
  },
  {
    group: "FY22単体",
    quater1: 2024,
    quater2: 2265,
    quater3: 2203,
    quater4: 2056,
  },
  {
    group: "FY23連結",
    quater1: 2270,
    quater2: 2462,
    quater3: 2480,
    quater4: 2587,
  },
  {
    group: "FY24連結(予想)",
    quater1: 2534,
    quater2: 2666,
    quater3: 2800,
    quater4: 3000,
  },
];

const [, ...keys] = Object.keys(dataset[0]);

const groups = dataset.map((data) => {
  return data.group;
});

const xScale = d3
  .scaleBand()
  .domain(groups)
  .range([0, svgAreaGraphWidth])
  .padding(barGap);

const yScale = d3
  .scaleLinear()
  .domain([
    0,
    d3.max(dataset, (data) => {
      return d3.sum(keys, (key) => +data[key]);
    }),
  ])
  .range([svgAreaGraphHeight, 0]);

const color = d3
  .scaleOrdinal()
  .domain(keys)
  .range(["#f98787", "#f99f9f", "#f9b9b9", "#f9d3d3"]);

const stackedData = d3.stack().keys(keys)(dataset);

svgArea
  .append("g")
  .selectAll("g")
  .data(stackedData)
  .join("g")
  .attr("fill", (data) => {
    return color(data.key);
  })
  .selectAll("rect")
  .data((data) => {
    return data;
  })
  .join("rect")
  .attr("x", (data) => {
    return xScale(data.data.group);
  })
  .attr("y", (data) => {
    return yScale(data[1]);
  })
  .attr("height", (data) => {
    return yScale(data[0]) - yScale(data[1]);
  })
  .attr("width", xScale.bandwidth());

svgArea
  .append("g")
  .attr("transform", `translate(0,${svgAreaGraphHeight})`)
  .call(d3.axisBottom(xScale));

svgArea
  .append("g")
  .call(d3.axisLeft(yScale))

  //タイトル用のテキストを追加
  .append("text")
  .attr("class", "graphTitle")
  .attr("x", svgAreaEntireWidth / 2 - svgAreaPadding.left)
  .attr("y", -svgAreaPadding.top / graphTitlePositionAjust)
  .text("売上高(百万円)");

svgArea.append("g").call(d3.axisLeft(yScale));

// 凡例表示

svgArea
  .append("line")
  .attr("x1", 15)
  .attr("x2", 25)
  .attr("y1", 80)
  .attr("y2", 80)
  .attr("class", "usageGuideLineQuater1");

svgArea
  .append("text")
  .attr("x", 35)
  .attr("y", 84)
  .text("1Q")
  .attr("class", "usageGuideText");

svgArea
  .append("line")
  .attr("x1", 15)
  .attr("x2", 25)
  .attr("y1", 60)
  .attr("y2", 60)
  .attr("class", "usageGuideLineQuater2");

svgArea
  .append("text")
  .attr("x", 35)
  .attr("y", 64)
  .text("2Q")
  .attr("class", "usageGuideText");

svgArea
  .append("line")
  .attr("x1", 15)
  .attr("x2", 25)
  .attr("y1", 40)
  .attr("y2", 40)
  .attr("class", "usageGuideLineQuater3");

svgArea
  .append("text")
  .attr("x", 35)
  .attr("y", 44)
  .text("3Q")
  .attr("class", "usageGuideText");

svgArea
  .append("line")
  .attr("x1", 15)
  .attr("x2", 25)
  .attr("y1", 20)
  .attr("y2", 20)
  .attr("class", "usageGuideLineQuater4");

svgArea
  .append("text")
  .attr("x", 35)
  .attr("y", 24)
  .text("4Q")
  .attr("class", "usageGuideText");
 #svgArea {
   background-color: #f2f2f2;
 }
 .graphScale {
   font: 12px sans-serif;
   color: #888;
 }
 .graphTitle {
   font: 20px sans-serif;
   fill: #333;
   text-anchor: middle;
   font-weight: bold;
 }

 .usageGuideText {
   font-size: 12px;
 }
 .usageGuideLineQuater1 {
   stroke-width: 12;
   stroke: #f98787;
 }
 .usageGuideLineQuater2 {
   stroke-width: 12;
   stroke: #f99f9f;
 }
 .usageGuideLineQuater3 {
   stroke-width: 12;
   stroke: #f9b9b9;
 }
 .usageGuideLineQuater4 {
   stroke-width: 12;
   stroke: #f9d3d3;
 }
4. おまけ アニメーション
前章で作成した棒グラフをアニメーション表示させてみます。
<html>
<head>
  <title>bar graph animation</title>
  <meta charset="utf-8">
  <script src="https://d3js.org/d3.v7.min.js"></script>
  <script src="main.js" type="module"></script>
  <link rel="stylesheet" href="style.css">
</head>
<body>
  <svg id="svgArea"></svg>
</body>
</html>
//データの準備
const dataset = [
  { name: "FY21連結", value: 7101 },
  { name: "FY22単体", value: 8561 },
  { name: "FY23連結", value: 9798 },
  { name: "FY24連結(予想)", value: 11000 },
];

//SVG領域の大きさの設定
const svgAreaEntireWidth = 600;
const svgAreaEntireHeight = 400;

//SVG領域内の(メモリなどを除いた)グラフ部分の設定
const svgAreaPadding = { top: 50, right: 20, bottom: 50, left: 70 };

//パディングを除いたグラフ描画領域の幅を設定
const svgAreaGraphWidth = svgAreaEntireWidth - (svgAreaPadding.left + svgAreaPadding.right);

//パディングを除いたグラフ描画領域の高さを設定
const svgAreaGraphHeight = svgAreaEntireHeight - (svgAreaPadding.top + svgAreaPadding.bottom);

//棒グラフの間隔
const barGap = 0.3;

//タイトルの位置調整
const graphTitlePositionAjust = 3;

//グラフの全体設定
const svgArea = d3
  .select("#svgArea")
  .attr("width", svgAreaEntireWidth)
  .attr("height", svgAreaEntireHeight)
  .append("g") // 余白を適用するためのグループを作成(適用された属性は子要素に継承される)

  //左、上パディング分移動
  .attr(
    "transform",
    "translate(" + svgAreaPadding.left + "," + svgAreaPadding.top + ")"
   );

//X軸の準備
//X軸のスケールを作成
const x = d3

  //ラベル作成
  .scaleBand()

  //グラフのラベルとしてdatasetのnameを設定
  .domain(
    dataset.map((data) => {
      return data.name;
    })
  )

  //SVG領域のグラフ部分の幅の設定(x軸は最小、最大の順で設定)
  .range([0, svgAreaGraphWidth])

  //棒グラフの間隔の設定(増減させると棒が細くなったり太くなったりする)
  .padding(barGap);

//X軸を追加
//下にX軸を追加
const xAxis = d3.axisBottom(x);

svgArea
  //SVG領域の最後の子要素として、グループ要素を追加
  .append("g")

  //クラス「scale」を追加
  .attr("class", "graphScale")

  //左上が(0,0)なので X軸をグラフの下部に表示するには、描画領域の高さ分下げる
  .attr("transform", "translate(0," + svgAreaGraphHeight + ")")

  //scaleBandを設定
  .call(xAxis);

// Y軸の設定
// Y軸のスケールを作成
const y = d3

  //スケールを作成()
  .scaleLinear()

  //スケール作成のためにdatasetのvalueの値の最小値と最大値を設定
  .domain([
    0,
    d3.max(dataset, (data) => {
      return data.value;
    }),
  ])
  //Y軸は最大、最小の順で設定
  .range([svgAreaGraphHeight, 0]);

//Y軸を追加
//左にY軸を追加
const yAxis = d3.axisLeft(y);

svgArea
  //SVG領域の最後の子要素としてグループ要素を追加
  .append("g")
  //クラス「scale」を追加
  .attr("class", "graphScale")
  .call(yAxis)
  .append("text")
  .attr("class", "graphTitle")
  .attr("x", svgAreaEntireWidth / 2 - svgAreaPadding.left)
  .attr("y", -svgAreaPadding.top / graphTitlePositionAjust)
  .text("売上高(百万円)");

 //グラフを描画
 svgArea
  //クラス「bar」が付与されている要素全てを選択
  .selectAll(".bar")
  //データセットの投入
  .data(dataset)
  .enter()
  //最後の子要素としてrect要素追加
  .append("rect")
  //追加するrect要素にクラス「bar」を付与
  .attr("class", "bar")
  //属性xにnameの値を入れる
  .attr("x", (data) => {
    return x(data.name);
  })
  //属性yにvalueの値を入れる(アニメーションのために初期値を0にするためにグラフ本体の高さを設定)
  .attr("y", svgAreaGraphHeight)

  //棒グラフの幅の設定
  .attr("width", x.bandwidth())
  //アニメーションのために一旦高さ0にする
  .attr("height", 0)
  .transition()
  .duration(1000)
  .delay((data, i) => {
    return i * 100;
  })
  .ease(d3.easeLinear)
  //棒グラフの高さの設定
  .attr("height", (data) => {
    return svgAreaGraphHeight - y(data.value);
  })
  .attr("y", (data) => {
    return y(data.value);
  });
#svgArea {
  background-color: #f2f2f2;
}

.bar {
  fill: #bb0907;
}

.graphScale {
  font: 12px sans-serif;
  color: #888;
}

.graphTitle {
  font: 20px sans-serif;
  fill: #333;
  text-anchor: middle;
  font-weight: bold;
}
5. 終わりに
今回は使用しなかったのですが、D3.jsは他に「散布図」「バブルチャート」「レーダーチャート」「地図」などの描画にもよくも使われているようなので、機会があったら試してみたいと思います。