OLS
import statsmodels.api as sm

n_samples = 20

a_true = 1.0
b_true = 3.0

x = np.array([i / n_samples for i in range(n_samples)])
y = a_true + b_true * x + np.random.normal(loc = 0, scale = 0.2, size = [n_samples])
from statsmodels.regression.linear_model import OLS

X = np.column_stack((np.repeat(1, n_samples), x))

model = OLS(y, X)
results = model.fit()

print (results.summary())
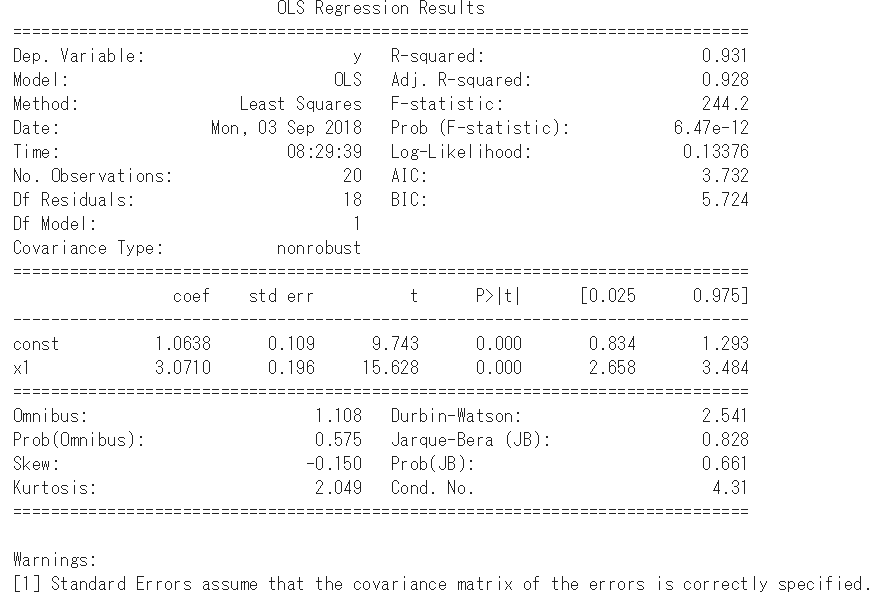
a, b = results.params
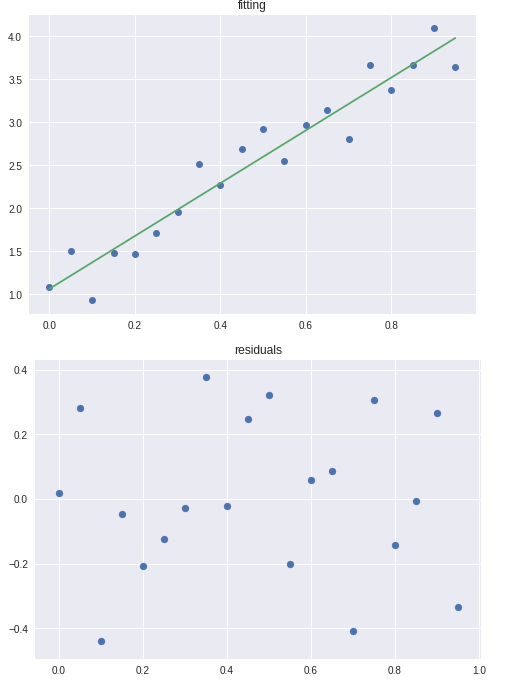
plt.plot(x, y, 'o')
plt.plot(x, a + b * x)
# plt.text(0, 0, "a = {:.3f}, b = {:.3f}".format(a,b))
plt.title('fitting')
plt.show()
residuals = y - (a + b * x)
plt.scatter(x, residuals)
plt.title('residuals')
plt.show()
ARIMA
n_samples = 120

a_true = 0.75
b_true = 0.5
x_ = 0.0
u_ = 0.0

x = []
for i in range(n_samples):
  u = np.random.normal(loc = 0.0, scale = 1.0)
  t = a_true * x_ + u + b_true * u_

  if i % 12 == 0:
    t += 2

  x.append(t)
  x_ = t
  u_ = u

plt.plot(range(n_samples), x)
plt.show()
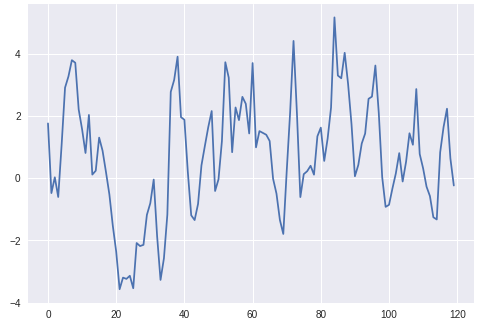
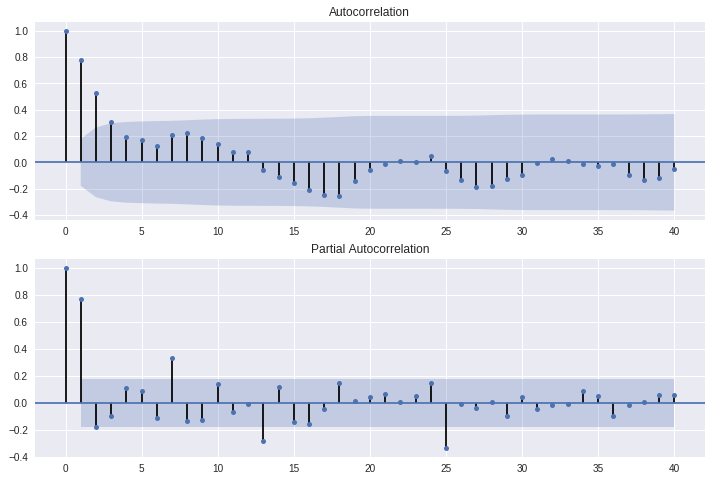
fig = plt.figure(figsize = (12, 8))
ax1 = fig.add_subplot(211)
fig = sm.graphics.tsa.plot_acf(x, lags = 40, ax = ax1)
ax2 = fig.add_subplot(212)
fig = sm.graphics.tsa.plot_pacf(x, lags = 40, ax = ax2)
order_select = sm.tsa.arma_order_select_ic(x, ic = 'aic', trend = 'nc')
print (order_select)

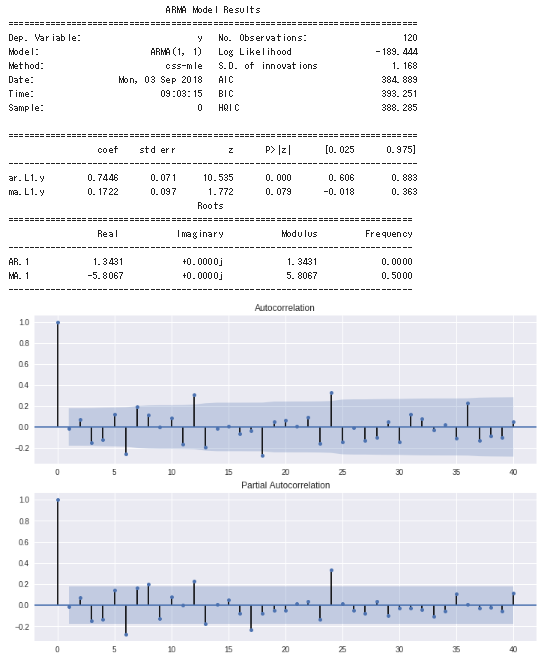
from statsmodels.tsa.arima_model import ARIMA

model = ARIMA(x, order = (1, 0, 1))
results = model.fit(trend = 'nc')

print (results.summary())

residuals = results.resid

fig = plt.figure(figsize = (12, 8))
ax1 = fig.add_subplot(211)
fig = sm.graphics.tsa.plot_acf(residuals, lags = 40, ax = ax1)
ax2 = fig.add_subplot(212)
fig = sm.graphics.tsa.plot_pacf(residuals, lags = 40, ax = ax2)
SARIMAX
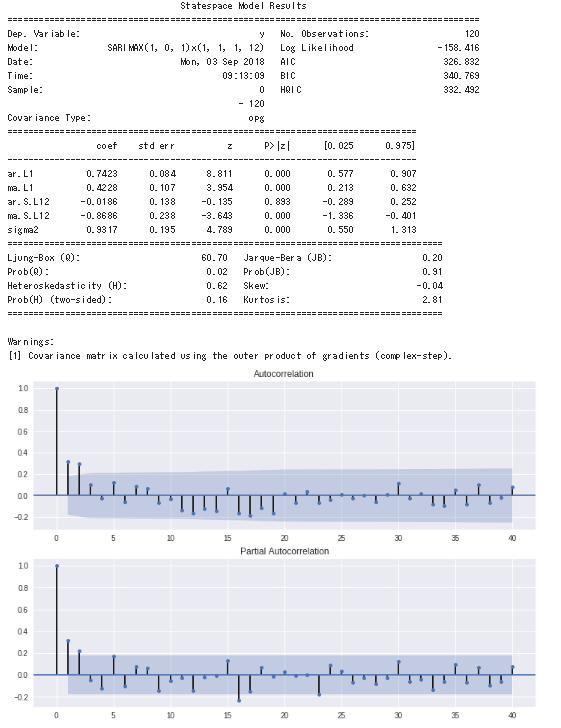
from statsmodels.tsa.statespace.sarimax import SARIMAX

model = SARIMAX(x, order = (1, 0, 1), seasonal_order = (1, 1, 1, 12))
results = model.fit()

print (results.summary())

residuals = results.resid

fig = plt.figure(figsize = (12, 8))
ax1 = fig.add_subplot(211)
fig = sm.graphics.tsa.plot_acf(residuals, lags = 40, ax = ax1)
ax2 = fig.add_subplot(212)
fig = sm.graphics.tsa.plot_pacf(residuals, lags = 40, ax = ax2)
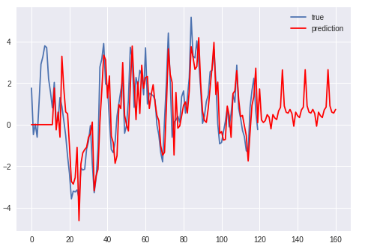
prediction = results.predict(0, 160)

plt.plot(x, label = 'true')
plt.plot(prediction, 'r', label = 'prediction')
plt.legend(loc = 'upper right')
plt.show()