概要
Rユーザーが、Pythonを使う際に、
「Rのアレ、Pythonではどうやるんだっけ?」
というのをまとめてみた感じです。
Pythonユーザーで、「Pythonのアレ、Rでどうやるんだっけ?」って人にも役立つかもしれません。
(dplyr, stringrの対応はこちらも参考にしてみてください)
ライブラリ
- tidyr => pandas
- ggplot2 => seaborn
データはirisのデータセットを利用。(R標準のデータセット、列名を一部変更)
| Sepal_Length | Sepal_Width | Petal_Length | Petal_Width | Species |
|---|---|---|---|---|
| 5.1 | 3.5 | 1.4 | 0.2 | setosa |
| 4.9 | 3.0 | 1.4 | 0.2 | setosa |
| 4.7 | 3.2 | 1.3 | 0.2 | setosa |
| 4.6 | 3.1 | 1.5 | 0.2 | setosa |
| 5.0 | 3.6 | 1.4 | 0.2 | setosa |
| 5.4 | 3.9 | 1.7 | 0.4 | setosa |
| ... | ... | ... | ... | ... |
tidyr
gather
DataFrameをWideからLongにする
R}
iris %>% gather(key, value, -Species) %>% head()
py}
pd.melt(iris, id_vars=['Species'], var_name='key', value_name='value').head()
    Species          key value
1  setosa Sepal_Length   5.1
2  setosa Sepal_Length   4.9
3  setosa Sepal_Length   4.7
4  setosa Sepal_Length   4.6
5  setosa Sepal_Length   5.0
6  setosa Sepal_Length   5.4
spread
DataFrameをLongからWideにする
R}
iris %>%
    rownames_to_column('id') %>%  # idとなる列がないと "Duplicate identifiers for rows" というエラーが生じる
    gather(key, value, -id, -Species) %>%
    spread(key, value) %>%
    arrange(as.integer(id)) %>%
    head()
py}
iris_index = iris.reset_index()  # df.pivot()で列(columns)にする値と行(index)にする値がユニークでないと、 "ValueError: Index contains duplicate entries, cannot reshape" というエラーが生じる
iris_melt2 = pd.melt(iris_index, id_vars=['index', 'Species'], var_name='key', value_name='value')
iris_melt2.pivot(index='index', columns='key', values='value').head()
id Species Petal_Length Petal_Width Sepal_Length Sepal_Width
1  1  setosa          1.4         0.2          5.1         3.5
2  2  setosa          1.4         0.2          4.9         3.0
3  3  setosa          1.3         0.2          4.7         3.2
4  4  setosa          1.5         0.2          4.6         3.1
5  5  setosa          1.4         0.2          5.0         3.6
6  6  setosa          1.7         0.4          5.4         3.9
ggplot2
Histgram
R}
iris %>% ggplot(aes(x=Sepal_Length)) + geom_histogram(fill="blue", alpha=0.5) + theme_bw()
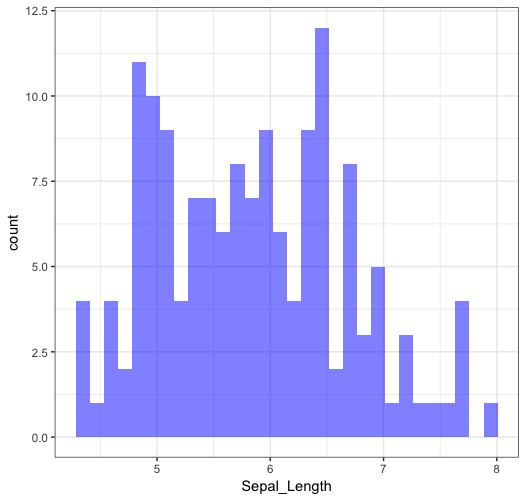
py}
sns.distplot(iris.Sepal_Length, kde=False) # kde=True で密度曲線

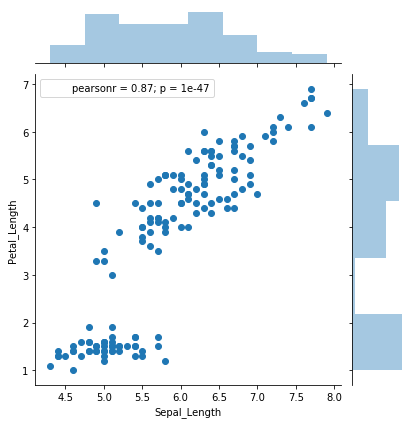
Point Plot
R}
iris %>% ggplot(aes(x=Petal_Width, y=Petal_Length, color=Species)) + geom_point()
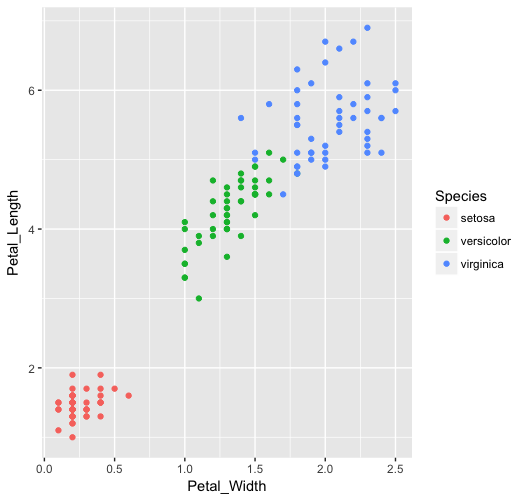
py}
sns.jointplot(x="Sepal_Length", y="Petal_Length", data=iris)
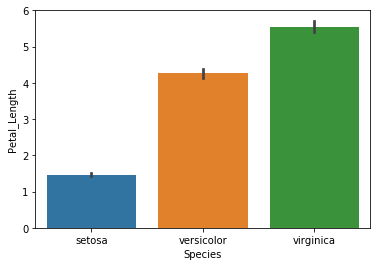
Bar Plot
R}
iris %>% ggplot(aes(x=Species, y=Petal_Length, fill=Species)) + stat_summary(fun.y=mean, geom="bar", alpha=0.5) + theme_bw()
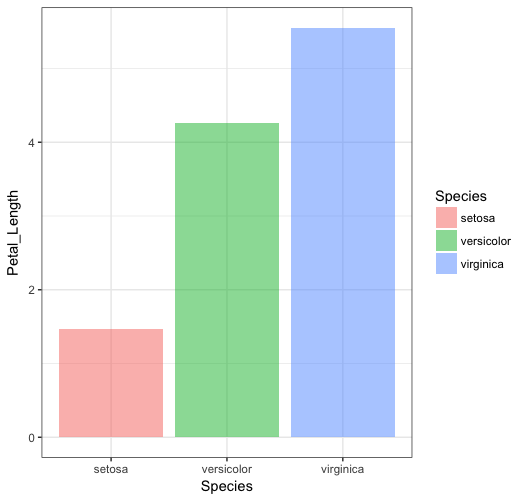
py}
sns.barplot(x="Species", y="Petal_Length", data=iris) # 平均値
Count Plot
R}
iris %>% ggplot(aes(x=Species, fill=Species)) + geom_bar(stat="count", alpha=0.5)
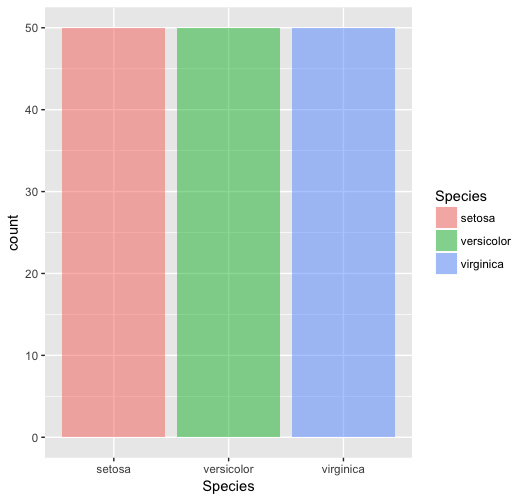
py}
sns.countplot(x="Species", y="Petal_Length", data=iris) # 個数

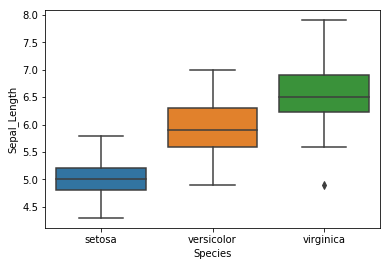
Box Plot
R}
iris %>% ggplot(aes(x=Species, y=Sepal_Length, fill=Species)) + geom_boxplot(alpha=0.5)
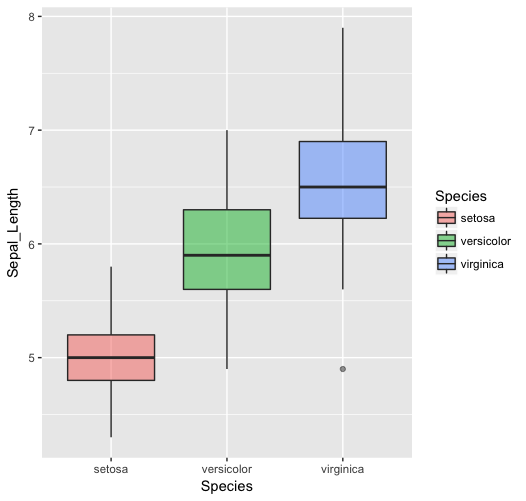
py}
sns.boxplot(x="Species", y="Sepal_Length", data=iris)