Pythonでのグラフ描画
Pythonチャートを描く場合の定番は「matplotlib」ですが、その見た目のやや野暮ったい感じと、表記法のややこしさが指摘されています。
そこで、この記事ではMatplotlibの機能をより美しく、またより簡単に実現するためのラッパー的存在である、「Seaborn」の使い方を取り上げます。
◆ Overview of Python Visualization Tools
http://pbpython.com/visualization-tools-1.html
上記の記事ではMatplotlibとSeabornについて下記のように書かれています。
matplotlibについて
Matplotlib is the grandfather of python visualization packages. It is extremely powerful but with that power comes complexity. You can typically do anything you need using matplotlib but it is not always so easy to figure out.
Seabornについて
Seaborn is a visualization library based on matplotlib. It seeks to make default data visualizations much more visually appealing. It also has the goal of making more complicated plots simpler to create. It does integrate well with pandas.
要は、
matplotlibはできることが多くていいけど、扱うのが複雑でメンドー(´・ω・`)
seabornはmatplotlibをベースにしているけど、もっと見目麗しく、簡単にかけるからサイコー(;´∀`)
ってことですね。(適当)
セッティング
seabornをインストールします
(matplotlibが入っていない人はmatplotlibも一緒に)
pip install seaborn
パッケージの準備とデータの準備
seabornにはいくつかの有名データがデフォルトでバンドルされているので、それを使って分析をしてみることにします。
import numpy as np
import pandas as pd
import seaborn as sns

x = np.random.normal(size=100) #ランダムデータをnumpy arrayとして作る

titanic = sns.load_dataset("titanic") ##kaggleで有名な、タイタニック号の生死者データ
tips = sns.load_dataset("tips")  ## お店の食事時間と会計総額とチップの関係のデータ
iris = sns.load_dataset("iris")  ## Rでお馴染みのアヤメの統計データ
ヒストグラム
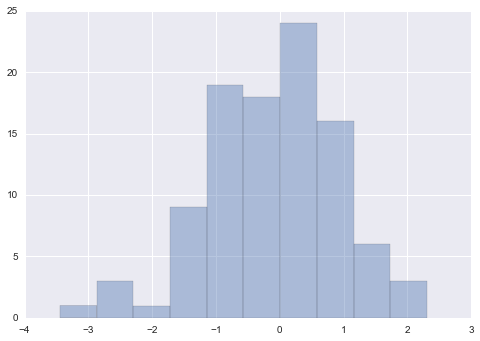
Seabornではヒストグラムは「distplot」というメソッドで描画できます。
kdeは密度近似関数の描画のオプション、binsはx軸の刻み目の指定です。
rugに関してはTrueにすると何が起こるか試してみてください。
sns.distplot(x, kde=False, rug=False, bins=10)
散布図
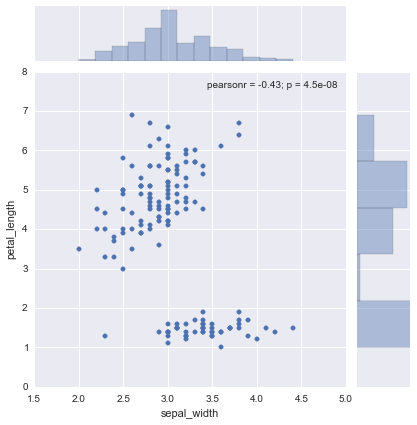
Seabornでは散布図は「jointplot」というメソッドで描画できます。
上記で読み込んだirisのデータで試してみます。
sns.jointplot('sepal_width', 'petal_length', data=iris)
うーん、x軸とy軸の数値それぞれの分布もヒストグラムで同時に見れて美しい
散布図祭り
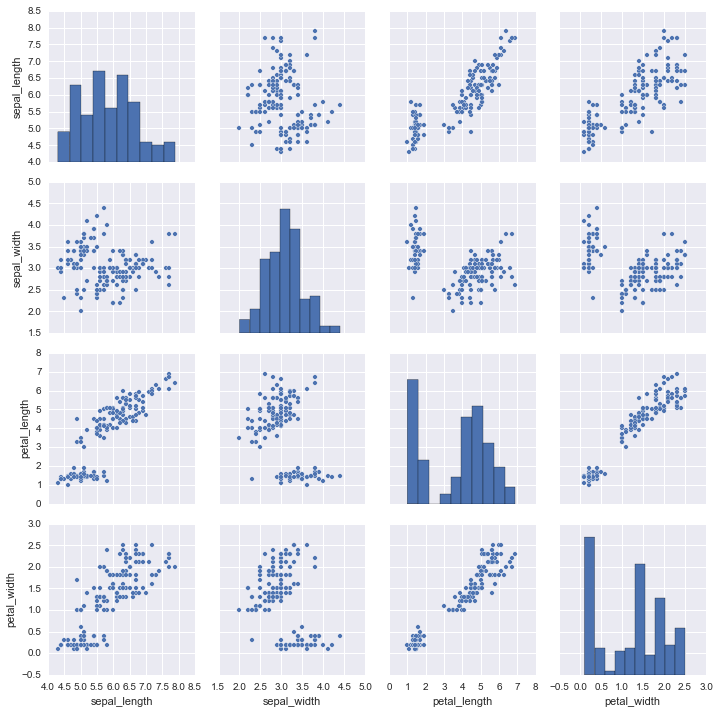
なお、この散布図は、データに含まれる全ての数値変数同士について簡単に見ることが出来ます。
「pairplot」というメソッドを使います。
sns.pairplot(iris)
どの変数間の相関が高いか、などがすぐに分かります。
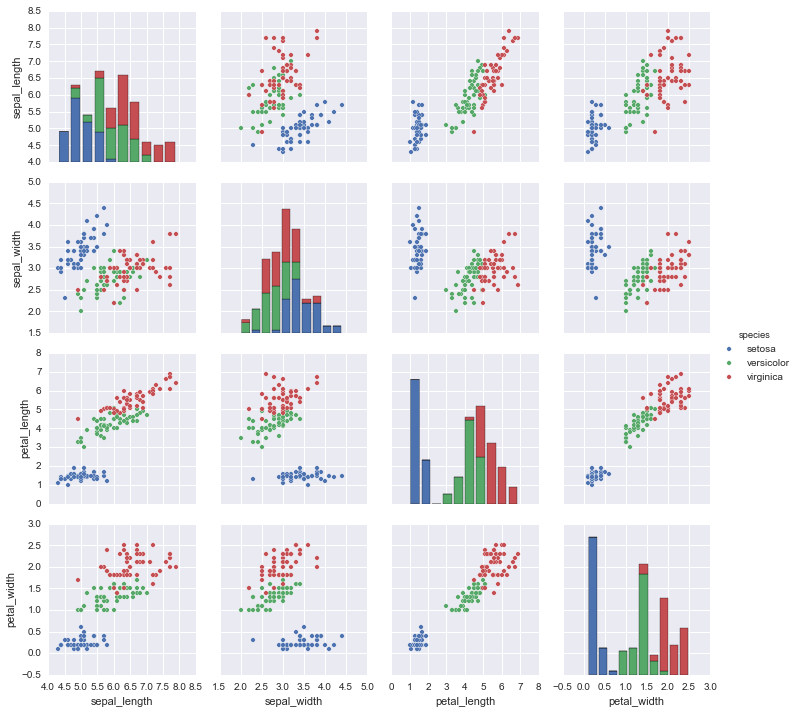
なお、カテゴリカル変数について色分けしてみることも可能です。
hue というオプションを使います.
weblioさんによると、 http://ejje.weblio.jp/content/hue
【不可算名詞】 [具体的には 【可算名詞】]
a色合い,色調.
用例
a change in hue 色調の変化.
b色.
用例
a cold [warm] hue 寒[暖]色.
という意味合いが「hue」という言葉にあるそうです。生まれた初めて聞いた単語だわ
sns.pairplot(iris, hue="species")
その2に続く
その2では、barplot,boxplot、stripplot などについて取り上げます
http://qiita.com/hik0107/items/7233ca334b2a5e1ca924
Seabornで美しいヒートマップ
http://qiita.com/hik0107/items/67ad4cfbc9e84032fc6b
Seabornで複数のグラフを一気に書く方法が超便利
http://qiita.com/hik0107/items/865b75ae486728cb0006
その他の記事
データサイエンティストに興味があるならまずこの辺りを見ておきな、って文献・動画のまとめ
http://qiita.com/hik0107/items/ef5e044d2f47940ba712
そろそろデータサイエンティストの定義とスキルセットについて本気で考えてみる
http://qiita.com/hik0107/items/f9bf14a7575d5c885a16


