Pythonでのグラフ描画
Pythonチャートを描く場合の定番は「matplotlib」ですが、その見た目のやや野暮ったい感じと、
表記法のややこしさが指摘されています。
そこで、この記事ではMatplotlibの機能をより美しく、またより簡単に実現するためのラッパー的存在である、「Seaborn」の使い方を取り上げます。
Seabornについてと、初歩的な使い方については下記リンクをご覧ください。
◆pythonで美しいグラフ描画 -seabornを使えばデータ分析と可視化が捗る その1
http://qiita.com/hik0107/items/3dc541158fceb3156ee0
ヒートマップ
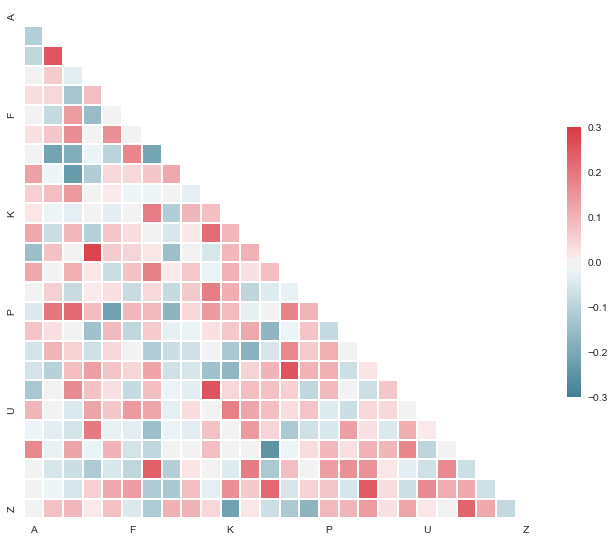
seabornでは下記のように美しいヒートマップを描くことが出来ます
(SeabornのTutorialサイトより抜粋)
見た目にもインパクトがあり、数字があまり得意でない人にもウケがよかったりするので、重宝します。
使い方を覚えておいて損はないと思います。
参考)
http://stanford.edu/~mwaskom/software/seaborn/examples/many_pairwise_correlations.html
やり方
ではやり方を説明していきます。
必要な下記のライブラリをインポートしておきます
import matplotlib.pyplot as plt
import seaborn as sns
import pandas as pd
import numpy as np
データを用意し、読みこませる形式に変換します。
seabornにはいくつかのデータセットがデフォルトでバンドルされているのでそれを使っていきましょう。
今回は『flights』というデータを使ってみます
df_flights = sns.load_dataset('flights')
df_flights.head(5)
headでみてみると、yearとmonthでひたすら縦に伸びたデータであることがわかります。
	year	month	    passengers
0	1949	January	    112
1	1949	February    118
2	1949	March	    132
3	1949	April	    129
4	1949	May         121
ここで仮に、yearとmonthの2軸でpassengersにどのような傾向があるか興味があるとしましょう。
つまり、x-year,y-monthのヒートマップを描くことにします。
ヒートマップはsns.heatmap という関数で描けますが、喰わせるデータに工夫が必要です。
xに持ってきたい軸をindexに、yに持ってきたい軸をcolumnに持つPivot形式に直してやる必要があります
df_flights_pivot = pd.pivot_table(data=df_flights, values='passengers',
                                  columns='year', index='month', aggfunc=np.mean)
Python Pandasでのデータ加工に馴染みがない方は下記あたりを参考にしてみてください。
参考:Pythonによるデータ加工
Python Pandasでのデータ操作の初歩まとめ − 前半&後半
http://qiita.com/hik0107/items/d991cc44c2d1778bb82e
http://qiita.com/hik0107/items/0ae69131e5317b62c3b7
あとは、Pivot形式にしたdataframeをseabornに与えるだけです
sns.heatmap(df_flights_pivot)
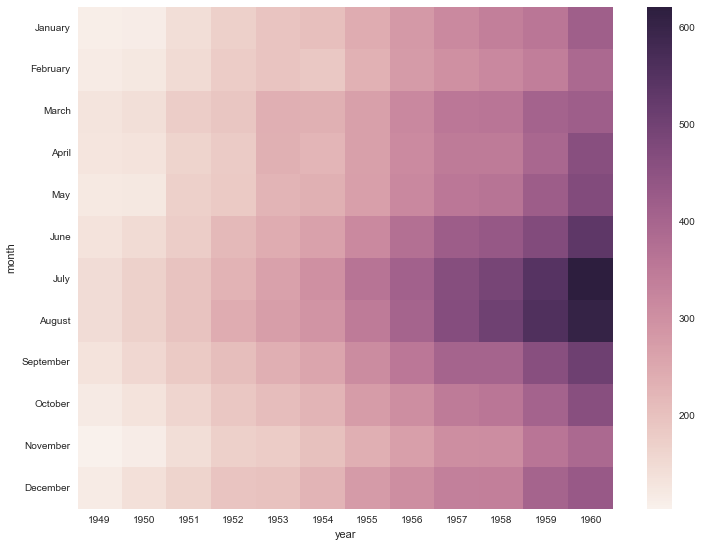
こんな感じの図が表示されます。
1949年から年を追うごとに全体的に乗客数が増加し、特に7~8月あたりは
特に乗客数が多いことが一発で見て取れます。
また、毎年11月はやや客数が落ち着き、12月はまた増加するようですね。
もう少しお化粧
上記図のままでもいいのですが、もう少し見せ方を変えるためにお化粧を施してみましょう。
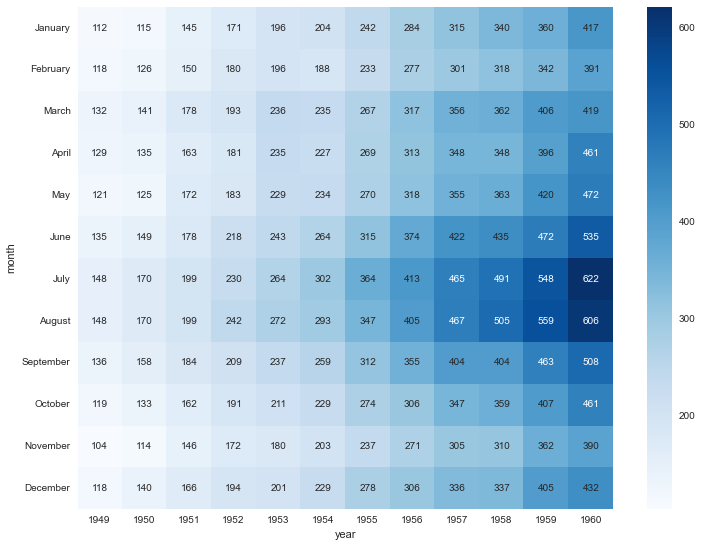
例えばこんな感じです
plt.figure(figsize=(12, 9))
sns.heatmap(df_flights_pivot, annot=True, fmt='g', cmap='Blues')
annotは数値をセルに書き込む引数、fmtは数値の桁の調整、cmapはColour_mapのことで、
グラディエーションの色のパレットを指定します。
このようになります。具体的な数値を見ながら議論したいときはこっちのほうがよいでしょう。
こちらの記事も
pythonで美しいグラフ描画 -seabornを使えばデータ分析と可視化が捗る その1
http://qiita.com/hik0107/items/3dc541158fceb3156ee0
pythonで美しいグラフ描画 -seabornを使えばデータ分析と可視化が捗る その2
http://qiita.com/hik0107/items/7233ca334b2a5e1ca924
データサイエンティストに興味があるならまずこの辺りを見ておきな、って文献・動画のまとめ
http://qiita.com/hik0107/items/ef5e044d2f47940ba712


