以下で説明されているノートブックをウォークスルーした内容になっています。
ノートブックはこちらにあります。
このノートブックでは、ファーマーマーケットのデータセットを探索するためにJupyterのウィジェットを活用します。Jupyterのウィジェットはデータを探索可能にし、ノートブックでの作業をより簡単かつインタラクティブなものにします。
ipyleafletのインストール
はじめにipyleaflet Pythonパッケージをインストールします。あとでマップ上に地理情報データを表示する際に使用します。
%pip install ipyleaflet==0.17.0
データの読み込み
databricks-datasetsからpandasデータフレームとしてファーマーマーケットのデータを読み込みます。
import pandas as pd
market_data = pd.read_csv("/dbfs/databricks-datasets/data.gov/farmers_markets_geographic_data/data-001/market_data.csv")
display(market_data)
ipywidgetsの活用
データセットは8000行以上、約60個のカラムがあるので、これら全てを一度に参照するのは実用的ではありませんが、データのサブセットを表示するためにipywidgetsを活用することができます。
import ipywidgets as w
column_widget = w.SelectMultiple(options=market_data.columns, value=["MarketName", "city", "County", "State", "Fruits", "Coffee", "x", "y"])

@w.interact(first_row=(0, len(market_data), 25), columns=column_widget)
def display_data(first_row=0, columns=["MarketName", "city", "County", "State", "Fruits", "Coffee", "x", "y"]):
  return market_data.loc[first_row:first_row+25, columns]
スライダーで表示行、マルチセレクトボックスで表示列をコントロールできます。

ipyleafletの活用
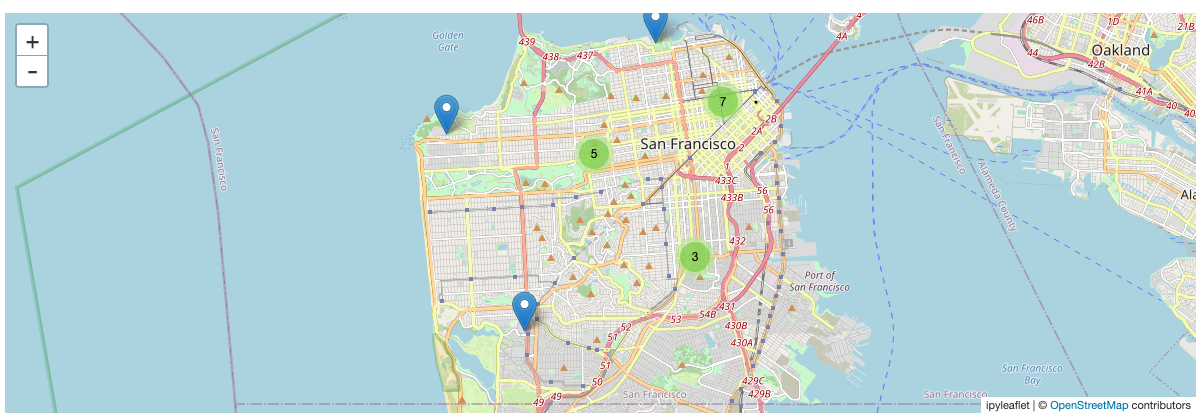
これでテーブルにどのような種類があるのか理解を深めることができます。サンフランシスコにどのようなマーケットがあって、それらがどこにあるのかを知りたいものとします。インタラクティブな地図上にサンフランシスコのすべてのファーマーズマーケットの場所を表示するためにipyleafletのmapウィジェットを活用することができます。そして、ズームインすることでそれぞれのマーケットの正確な場所を確認することができます。
from ipyleaflet import Map, Marker, MarkerCluster

city_map = Map(center=(37.76, -122.45), zoom=12)
local_markets = market_data[market_data.city == "San Francisco"]
locations = [Marker(location=(y, x), draggable=False) for (x, y) in zip(local_markets.x, local_markets.y)]
cluster = MarkerCluster(markers=locations)
city_map.add(cluster)
city_map
HTMLウィジェットによる地図の拡張
この地図は素晴らしいものですが、地図上で見ているのがどのマーケッなのかを知ることが少し大変です。これらをクリックした際に情報がポップアップされるようにマーカーを再定義することができます。このためには、それぞれのマーケットの名前と時間を表示するHTMLウィジェットを使います。以下のコードでは上の地図を変更しており、以下のセルを実行したあとに変更を確認するために、上にスクロールしてください。
market_desc = """<div style="white-space: pre">Name: {name}
Season: {season}
Time: {time}</div>
"""

def createMarker(row):
  "Create a marker with an appropriate description from a row in our dataset"
  description = market_desc.format(name=row.MarketName, season=row.Season1Date, time=row.Season1Time)
  return Marker(location=(row.y, row.x), popup=w.HTML(description), draggable=False)

cluster.markers = [createMarker(row) for idx, row in local_markets.iterrows()]
地図におけるフィルタリング
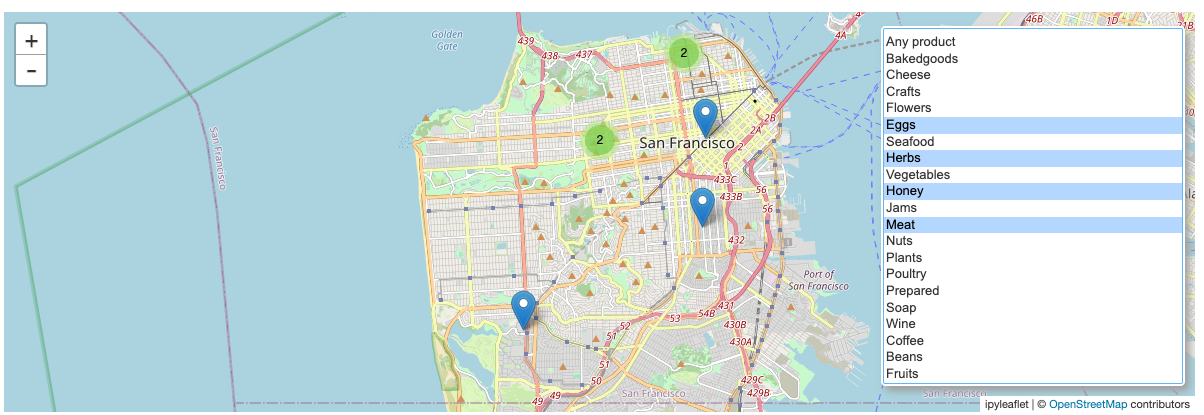
あなたの好きな食べ物を売っているマーケットを特定するために、買いたいものに基づいてマーケットをフィルタリングするマルチセレクトのウィジェットを地図に追加します。
import operator
import functools
from ipyleaflet import WidgetControl

# オプション "" はフィルターなしを表現します
item_list = ["Any product", "Bakedgoods", "Cheese", "Crafts", "Flowers", "Eggs", "Seafood", "Herbs",
             "Vegetables", "Honey", "Jams", "Meat", "Nuts", "Plants", "Poultry", "Prepared",
             "Soap", "Wine", "Coffee", "Beans", "Fruits"]
item_filter = w.SelectMultiple(options=item_list, rows=len(item_list))

def update_markers(*args):
    selected_items = item_filter.value
    if len(selected_items) == 0 or "Any product" in selected_items:
        filtered_markets = local_markets
    else:
        filter = functools.reduce(operator.and_, (local_markets[item] == "Y" for item in selected_items))
        filtered_markets = local_markets[filter]
    cluster.markers = [createMarker(row) for idx, row in filtered_markets.iterrows()]

item_filter.observe(update_markers, names="value")
city_map.add(WidgetControl(widget=item_filter, position="bottomright"))
この時点で、あなたは今週末に訪れるマーケットを特定できたことになります。そしてこのプロセスでは、小規模なデータアプリケーションを構築しました。他の領域でも使えるように、このアプリケーションをより一般的なものにすることができます。以下のセルでは、地図上で表示される範囲にマッチするマーカーをアップデートするためのリフレッシュボタンを追加しています。
import numpy as np

max_markers = 200

refresh = w.Button(description="Refresh")
current_bounds = (city_map.north, city_map.south, city_map.east, city_map.west)

def update_local_markets(*args):
    global local_markets
    global current_bounds
    bounds = (city_map.north, city_map.south, city_map.east, city_map.west)
    if bounds == current_bounds:
        return
    else:
        current_bounds = bounds
    local_markets = market_data[market_data.x.between(city_map.west, city_map.east) & market_data.y.between(city_map.south, city_map.north)]
    # 場所が多い場合には、地図の中心に最も近いものを取得します
    if len(local_markets) > max_markers:
        dist = np.linalg.norm(local_markets[["y", "x"]] - city_map.center, axis=1)
        closest = dist.argpartition(max_markers)[:max_markers]
        local_markets = local_markets.iloc[closest]
        # 表示されていないマーケットが存在する場合にはボタンに赤枠を表示します
        refresh.layout.border = "1px solid red"
    else:
        refresh.layout.border = ""
    update_markers()

refresh.on_click(update_local_markets)
city_map.add(WidgetControl(widget=refresh, position="bottomleft"))


