こちらの続きです。
03_Derive_Raw_Material_Demandと04_Manage_Material_Shortagesをウォークスルーします。
予測需要を原材料にマッピング
03_Derive_Raw_Material_Demandを実行していきます。
前提条件: このノートブックを実行する前に 01_Introduction_And_Setup と 02_Fine_Grained_Demand_Forecasting を実行してください。
前回のノートブック (002_Fine_Grained_Demand_Forecasting) では、優れたスピードとコスト効率性を提供す並列での複数モデルのトレーニングに対するDatabricksの一つのアプローチのメリットをデモンストレーションしましたが、このパートでは、製造に必要な原材料がどれだけ必要なのかを特定するために、製造バリューチェーンを移動するためのDatabricksのグラフ機能の使い方を説明します。
このノートブックのハイライト:
- Apache Sparkをベースとした分散グラフ処理フレームワークとしてのGraphXを用いた大規模グラフ問題の解決
- ビジネス知識を組み込み、製造バリューチェーンを移動するためのプロパティグラフの完全サポートの活用
予測した製品数だけ製造を行うのに原材料がどれだけ必要なのかを特定するために、製造バリューチェインを遡ります。
%run ./_resources/00-setup $reset_all_data=false
print(cloud_storage_path)
print(dbName)
s3://taka-external-location-bucket/external-tables/demand_planning
demand_planning_takaaki_yayoi
import os
import string
import networkx as nx
import random
import numpy as np
import pyspark.sql.functions as f
from graphframes import *
from graphframes.lib import *
AM = AggregateMessages
from pyspark.sql.types import StructType, StructField, StringType, ArrayType, StringType, LongType
はじめにシンプルな例を用いてアルゴリズムを説明します
# 簡単なBoMデータセットを作成しましょう
edges = spark.createDataFrame([
                               ('Raw1', 'Intermediate1', 5),
                               ('Intermediate1','Intermediate2', 3),
                               ('Intermediate2', 'FinishedProduct', 1),
                               ('Raw2', 'Intermediate3', 5),
                               ('Intermediate3', 'FinishedProduct', 1),
                               ('FinishedProduct', 'SKU', 1)
                              ],
                              ['src', 'dst', 'qty'])
上のデータフレームは非常にシンプルなBoMを表現しています。最終製品の構築計画を表現しています。いくつかの中間製品と原材料から構成されています。数量も指定されています。現実には、あるBoMはさらに多くの、そして未知数のステップから構成されます。さらに多くの原材料や中間製品が存在することは言うまでもないことです。この図では、最終製品は一つのSKUにマッピングされることを前提としています。この情報は典型的なBoMには含まれないかもしれません。BoMは主に、SKUが物流システムの一部となる何かである、製造計画システムに適したものであることに注意してください。それぞれの最終製品をSKUにマッピングする検索テーブルがあることを前提としています。そのため、上のBoMは数量1のもう一つのステップを人工的に追加した結果となります。ここからは、製造業の用語をグラフ理論で用いられる用語に変換します: それぞれの組み立てステップはエッジ(edge)と呼びます。原材料や中間製品、最終製品、SKUは頂点(vertice)となります。
準備
ここでのゴールは、予測したそれぞれのSKUに対する需要の値を、関連する最終製品(製造ラインのアウトプット)を製造するのに必要な原材料の数量(製造ラインへのインプット)にマッピングすることです。このためには、ある期間(計算コストを削減するにはある時点でも構いません)での製造に必要となるすべての原材料に対するそれぞれのSKUの需要を一覧するテーブルが必要となります。これを2ステップで実行します:
- ステップ1: それぞれの原材料のSKUを導出
- ステップ2: 原材料の視点から全ての後続の組み立てステップ(=エッジ)の全ての数量の積の導出
全ての頂点の導出
def create_vertices_from_edges(edges):
  vertices = ((edges.
   select(f.col('src')).
   distinct().
   withColumnRenamed('src','id')).
 union(
    (edges.
     select(f.col('dst')).
     distinct().
     withColumnRenamed('dst','id'))
 ).distinct()
 )
  return(vertices)
vertices = create_vertices_from_edges(edges)
display(vertices)
グラフの導出
g = GraphFrame(vertices, edges)
ステップ1
以下の関数では、それぞれのSKUの原材料にマッピングするテーブルを導出するために、集約メッセージングのコンセプトを活用しています。
https://spark.apache.org/docs/latest/graphx-programming-guide.html をご覧ください。
def get_sku_for_raw(gx):

  # 初回のイテレーション
  iteration = 1

  # エッジの初期化
  updated_edges = gx.edges.select(f.col("src"),f.col("dst")).withColumn("aggregated_parents", f.col("dst"))
  updated_edges = updated_edges.localCheckpoint()

  # 頂点の初期化
  updated_vertices = gx.vertices
  updated_vertices = updated_vertices.localCheckpoint()

  # グラフの初期化
  g_for_loop = GraphFrame(updated_vertices, updated_edges)

  # vertices_with_agg_messages の初期化
  emptyRDD = spark.sparkContext.emptyRDD()
  schema = StructType([
    StructField('id', StringType(), True),
    StructField('aggregated_parents_from_parent', ArrayType(StringType(), True)),
    StructField('iteration', LongType(), True)
  ])
  vertices_with_agg_messages = spark.createDataFrame(emptyRDD,schema)


  while(True):

    #### WHILEループはここからスタート ############################################################################

    # 集約メッセージング
    msgToSrc = AM.edge["aggregated_parents"]

    agg = g_for_loop.aggregateMessages(
     f.collect_set(AM.msg).alias("aggregated_parents_from_parent"),
     sendToSrc=msgToSrc,
     sendToDst=None
    )

    agg = agg.withColumn("iteration", f.lit(iteration))

    if (iteration > 1):
      agg = agg.withColumn("aggregated_parents_from_parent",f.flatten(f.col("aggregated_parents_from_parent")))


    vertices_with_agg_messages = vertices_with_agg_messages.union(agg)

    # イテレーションの増加
    iteration+=1

    # エッジの更新
    updated_edges = g_for_loop.edges
    updated_edges = (updated_edges.
      join(agg, updated_edges["dst"] == agg["id"], how="inner").
      select(f.col("src"), f.col("dst"), f.col("aggregated_parents_from_parent")).
      withColumnRenamed("aggregated_parents_from_parent", "aggregated_parents").
      withColumn("aggregated_parents", f.array_union(f.col("aggregated_parents"), f.array(f.col("dst")))).
      select(f.col("src"), f.col("dst"), f.col("aggregated_parents"))
    )

    if (updated_edges.count() == 0):
      break

    # チェックポイント
    updated_vertices = updated_vertices.localCheckpoint()
    updated_edges = updated_edges.localCheckpoint()

    # グラフの更新
    g_for_loop = GraphFrame(updated_vertices, updated_edges)

    #### WHILEループはここで終了 #######################################################################

  # idごとの最終イテレーションのサブセット
  helper = (vertices_with_agg_messages.
    groupBy("id").
    agg(f.max("iteration").alias("iteration")))

  vertices_with_agg_messages = helper.join(vertices_with_agg_messages, ["id", "iteration"],  how="inner")

  # 最も遠方にいる子供のサブセット
  in_degrees_df = gx.inDegrees
  raw_df = (vertices.
   join( in_degrees_df, ["id"], how='left_anti'))
  vertices_with_agg_messages = (raw_df.
                               join(vertices_with_agg_messages, ["id"],how="inner").select(f.col("id"),f.col("aggregated_parents_from_parent"))
                              )
  vertices_with_agg_messages = (vertices_with_agg_messages.
                                 withColumn("SKU", f.col("aggregated_parents_from_parent").getItem(0)).
                                 select(f.col("id"), f.col("SKU"))
                              )


  return(vertices_with_agg_messages)
res1 = get_sku_for_raw(g)
display(res1)
ステップ2
以下の関数では、原材料を要求される最終製品の製造に必要な数量にマッピングするテーブルを導出するために、集約メッセージングのコンセプトを活用しています。それぞれの原材料に対して、全ての後続ステップの数量の掛け算となります。
https://spark.apache.org/docs/latest/graphx-programming-guide.html をご覧ください。
def get_quantity_of_raw_needed_for_its_fin(gx):


  # 初期化:
  msgToSrc = AM.edge["qty"]

  # それぞれのループのイテレーションでアップデートされるグラフの初期化
  vertices = gx.vertices
  edges = gx.edges
  vertices = vertices.localCheckpoint()
  edges = edges.localCheckpoint()

  g_for_loop = gx

  # vertices_with_agg_messages の初期化
  emptyRDD = spark.sparkContext.emptyRDD()
  schema = StructType([
  StructField('id', StringType(), True),
  StructField('qty', LongType(), True),
  StructField('iteration', LongType(), True)
  ])
  vertices_with_agg_messages = spark.createDataFrame(emptyRDD,schema)

  # イテレーションの値の初期化
  iteration = 1


  while(True):
    # 子供の頂点にエッジ qty を渡す
    agg = g_for_loop.aggregateMessages(
     f.first(AM.msg).alias("qty_from_parent"),
     sendToSrc=msgToSrc,
     sendToDst=None
    )

    # 集約情報テーブルのアップデート
    agg = agg.withColumn("iteration", f.lit(iteration))
    vertices_with_agg_messages = vertices_with_agg_messages.union(agg)


    # エッジのアップデート
    edges_old = g_for_loop.edges

    helper = (edges_old.
       join(agg, edges_old['dst'] == agg['id'], "left").
       filter(f.col("id").isNull()).
       select(f.col("src")).
       withColumnRenamed("src","to_multiply_look_up")
       )

    edges_update = edges_old.join(agg, edges_old['dst'] == agg['id'], "inner")
    edges_update = (edges_update.
           join(helper, edges_update["dst"] == helper["to_multiply_look_up"], "left").
                withColumn("qty", f.when(f.col("to_multiply_look_up").isNull(), f.col("qty")  ).otherwise(f.col("qty")*f.col("qty_from_parent"))).
                select(f.col('src'),f.col('dst'),f.col('qty'))
               )

    # break条件の計算
    if (edges_update.count()==0):
      break

    # イテレーションの更新
    iteration+=1

    # チェックポイント
    edges_update = edges_update.localCheckpoint()

    # グラフのアップデート
    g_for_loop = GraphFrame(vertices, edges_update)


  # idごとの最終イテレーションのサブセット
  helper = (vertices_with_agg_messages.
    groupBy("id").
    agg(f.max("iteration").alias("iteration"))
         )

  vertices_with_agg_messages = helper.join(vertices_with_agg_messages, ["id", "iteration"],  how="inner")

  # 最も遠方にいる子供のサブセット
  in_degrees_df = g.inDegrees
  raw_df = (vertices.
   join( in_degrees_df, ["id"], how='left_anti' )
  )
  vertices_with_agg_messages = raw_df.join(vertices_with_agg_messages, ["id"], how="inner").select(f.col("id"),f.col("qty"))

  # 返却
  return(vertices_with_agg_messages)
res2 = get_quantity_of_raw_needed_for_its_fin(g)
display(res2)
二つのテーブルをjoinすることで、必要な集約BoMを得ることができます。
aggregated_bom = res1.join(res2, ["id"], how="inner").withColumnRenamed("id","RAW")
display(aggregated_bom)
予測需要のデータセットにこのコンセプトを適用します
demand_df = spark.read.table(f"{dbName}.part_level_demand_with_forecasts")
sku_mapper = spark.read.table(f"{dbName}.sku_mapper")
bom = spark.read.table(f"{dbName}.bom")
demand_df = (demand_df.
        withColumn("Demand", f.col("Demand_Fitted")).
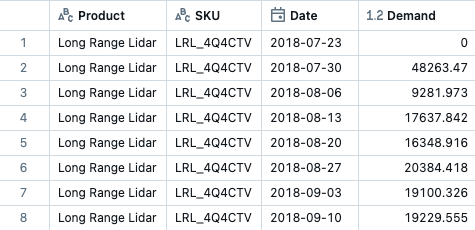
        select(f.col("Product"), f.col("SKU"), f.col("Date"), f.col("Demand")))
display(demand_df)
このBoMにはSKUへのマッピングが含まれていないので、数量1を持つ人工的な組み立てステップを追加します。
display(bom)
display(sku_mapper)
display(spark.sql(f"select distinct SKU from {dbName}.part_level_demand_with_forecasts"))
edges = (sku_mapper.withColumn("qty", f.lit(1)).
  withColumnRenamed("final_mat_number", "material_in").
  withColumnRenamed("sku","material_out").
  union(bom).
  withColumnRenamed("material_in","src").
  withColumnRenamed("material_out","dst")
        )
display(edges)
vertices = create_vertices_from_edges(edges)
display(vertices)
g = GraphFrame(vertices, edges)
ステップ1
res1 = get_sku_for_raw(g)
display(res1)
ステップ2
res2 = get_quantity_of_raw_needed_for_its_fin(g)
display(res2)
二つのテーブルをjoinすることで、必要な集約BoMを得ることができます。
aggregated_bom = (res1.
                    join(res2, ["id"], how="inner").
                    withColumnRenamed("id","RAW").
                    withColumnRenamed("qty","QTY_RAW").
                    orderBy(f.col("SKU"),f.col("RAW"))
                 )
display(aggregated_bom)
原材料の需要の導出
demand_raw_df = (demand_df.
      join(aggregated_bom, ["SKU"], how="inner").
      select("Product","SKU","RAW", "Date","Demand", "QTY_RAW").
      withColumn("Demand_Raw", f.col("QTY_RAW")*f.col("Demand")).
      withColumnRenamed("Demand","Demand_SKU").
      orderBy(f.col("SKU"),f.col("RAW"), f.col("Date"))
                )
display(demand_raw_df)
Deltaに保存
forecast_df_delta_path = os.path.join(cloud_storage_path, 'forecast_raw')

# データの書き出し
demand_raw_df.write \
.mode("overwrite") \
.format("delta") \
.save(forecast_df_delta_path)

spark.sql(f"DROP TABLE IF EXISTS {dbName}.forecast_raw")
spark.sql(f"CREATE TABLE {dbName}.forecast_raw USING DELTA LOCATION '{forecast_df_delta_path}'")
display(spark.sql(f"SELECT * FROM {dbName}.forecast_raw"))
原材料不足への対応
04_Manage_Material_Shortagesを実行していきます。
サプライヤーが実際にどれだけの原料を配達できるのかをチェックすると、実際に顧客にどれだけのSKUを出荷できるのかを特定するために、製造バリューチェーンを下ることができます。特定のSKUである原材料が製造のボトルネックになっている場合、在庫コストを削減するために、当該SKUの他の原材料の注文をそれに合わせて調整することができます。
前提条件: このノートブックを実行する前に 01_Introduction_And_Setup、02_Fine_Grained_Demand_Forecasting、03_Derive_Raw_Material_Demand を実行してください。
前回のノートブック (03_Derive_Raw_Material_Demand) では、製造に必要な原材料がどれだけなのかを特定するために、製造バリューチェーンを遡るためのDatabricksのグラフ機能をデモンストレーションしました。このノートブックでは:
- それぞれの原材料の可用性をチェック
- 実際に配送できるSKUの数量をチェックするために製造バリューチェーンを下る
- 適切に原材料の注文を調整する
このノートブックのハイライト:
- 製造バリューチェーンを下るために以前のノートブックとDeltaを活用
%run ./_resources/00-setup $reset_all_data=false
import os
import pyspark.sql.functions as f
全ての原材料不足のレポートを取得
ここで、ノートブックHelper/Simulate_Material_Shortagesを実行するのですが、こちらのノートブックでもUnity Catalogの対応が必要です。ノートブックの冒頭(Cmd3など)に以下のコードを追加してください。
# Unity Catalog対応
catalogName = "takaakiyayoi_catalog"
spark.sql(f"""USE CATALOG {catalogName}""")
notebook_path = dbutils.notebook.entry_point.getDbutils().notebook().getContext().notebookPath().get()
notebook_path = os.path.join(os.path.dirname(notebook_path),"Helper/Simulate_Material_Shortages")
dbutils.notebook.run(notebook_path, 600, {"dbName": dbName, "cloud_storage_path": cloud_storage_path})
display(spark.sql(f"select * from {dbName}.material_shortage"))
影響を受けるSKUの取得
影響を受けるSKUを取得し、実際に顧客に出荷することができる数量を導出します。
demand_raw_df = spark.read.table(f"{dbName}.forecast_raw")
material_shortage_df = spark.read.table(f"{dbName}.material_shortage")
affected_skus_df = (material_shortage_df.
                    join(demand_raw_df, ["RAW","Date"], how="inner").
                    withColumn("fraction_raw", f.col("available_demand") / f.col("Demand_Raw"))
                   )

min_fraction =  (affected_skus_df.
                    groupBy("SKU").
                    agg(f.min(f.col("fraction_raw")).alias("min_fraction_raw"))
                   )

affected_skus_df = (
                  affected_skus_df.
                  join(min_fraction, ["SKU"]).
                  withColumnRenamed("available_demand", "Adjusted_Demand_Raw").
                  withColumn("Adjusted_Demand_SKU", f.floor(f.col("Demand_SKU") * f.col("min_fraction_raw")) ).
                  select(f.col("RAW"), f.col("Date"), f.col("SKU").alias("Affected_SKU"), f.col("Product").alias("Affected_Product"), f.col("Demand_RAW"), f.col("Adjusted_Demand_Raw"), f.col("Demand_SKU"), f.col("Adjusted_Demand_SKU"), f.col("min_fraction_raw").alias("Available_Fraction_For_SKU"))
)

display(affected_skus_df)
display(affected_skus_df.select('Affected_SKU', 'RAW', 'Date', 'Demand_SKU', 'Adjusted_Demand_SKU'))
他の原材料とオーバーラップする数量を取得
ある原材料が不足しており、特定のSKUの他の原材料がオーバーラップしている場合には、在庫コストを削減するために注文を調整することができます。
raw_overplanning_df = (affected_skus_df.
                        select(f.col("Affected_SKU").alias("SKU"), f.col("Date"), f.col("Available_Fraction_For_SKU")).
                        join(demand_raw_df, ["SKU", "Date"], how="inner").
                        withColumn("Demand_Raw_Adjusted", f.floor(f.col("Demand_RAW") * f.col("Available_Fraction_For_SKU"))).
                        select(f.col("RAW"), f.col("Date"), f.col("Demand_Raw"), f.col("Demand_Raw_Adjusted"))
                      )


display(raw_overplanning_df)
Deltaに保存
material_shortage_data_path = os.path.join(cloud_storage_path, "material_shortage_sku")

# データの書き出し
affected_skus_df.write \
.mode("overwrite") \
.format("delta") \
.save(material_shortage_data_path)

spark.sql(f"DROP TABLE IF EXISTS {dbName}.material_shortage_sku")
spark.sql(f"CREATE TABLE {dbName}.material_shortage_sku USING DELTA LOCATION '{material_shortage_data_path}'")
material_shortage_raw_data_path = os.path.join(cloud_storage_path, "material_shortage_raw")

# データの書き出し
raw_overplanning_df.write \
.mode("overwrite") \
.format("delta") \
.save(material_shortage_raw_data_path)

spark.sql(f"DROP TABLE IF EXISTS {dbName}.material_shortage_raw")
spark.sql(f"CREATE TABLE {dbName}.material_shortage_raw USING DELTA LOCATION '{material_shortage_raw_data_path}'")
display(spark.sql(f"SELECT * FROM {dbName}.material_shortage_sku"))
display(spark.sql(f"SELECT * FROM {dbName}.material_shortage_raw"))
ここまでの流れで構成されたリネージはこちらとなります。部品レベルの需要から予測、BoMとSKUへのマッピングから原材料の需要予測、欠品に基づく原材料の調整に至る流れを確認できます。


