0
0

Delete article

Deleted articles cannot be recovered.

Draft of this article would be also deleted.

Are you sure you want to delete this article?

Databricks AI/BIダッシュボードでサンキー図がサポートされました

Posted at

こちらのアップデートです。

サンキーの可視化: サンキーの可視化が AI/BI ダッシュボードで利用できるようになりました。サンキーダイアグラムを参照してください。

工程などのステージ間の流量把握が容易に行えます。

データを準備します。

SELECT pickup_zip as stage1, dropoff_zip as stage2, sum(fare_amount) as value
FROM samples.nyctaxi.trips
GROUP BY 1, 2
ORDER BY 3 DESC
LIMIT 10
stage1 stage2 value
10023 10023 798
10028 10021 777.5
11371 10001 754.5
11422 10011 731.5
10003 10011 730
11422 10017 728
10028 10028 722
10021 10021 701.5
11371 10018 693
11371 10020 688.5

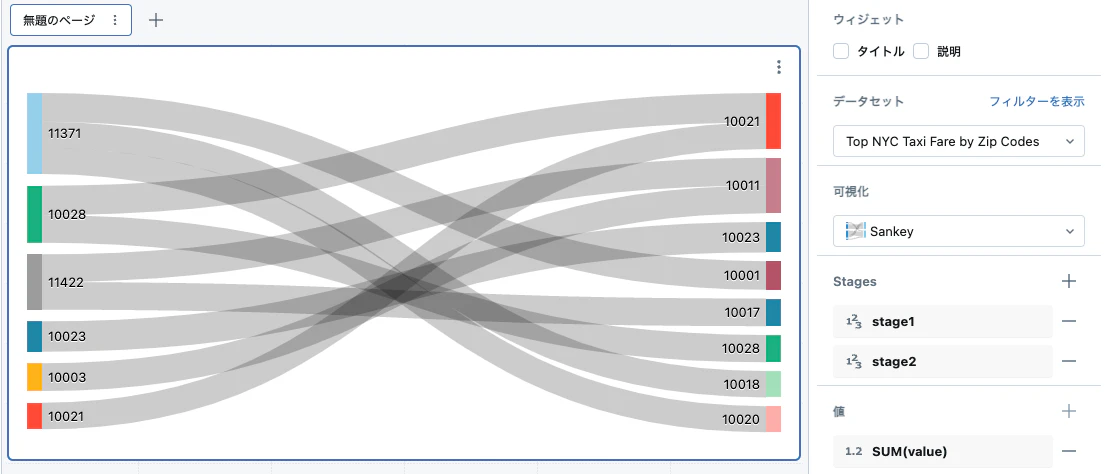
キャンバスに移動して、可視化を追加してSankeyを選択します。

Screenshot 2025-04-09 at 13.36.27.png

Stagesを指定すると、サンキー図が表示されます。

Screenshot 2025-04-09 at 13.37.17.png

特定の関係にフォーカスもできます。

Screenshot 2025-04-09 at 13.37.35.png

はじめてのDatabricks

はじめてのDatabricks

Databricks無料トライアル

Databricks無料トライアル

0
0
0

Register as a new user and use Qiita more conveniently

  1. You get articles that match your needs
  2. You can efficiently read back useful information
  3. You can use dark theme
What you can do with signing up
0
0

Delete article

Deleted articles cannot be recovered.

Draft of this article would be also deleted.

Are you sure you want to delete this article?