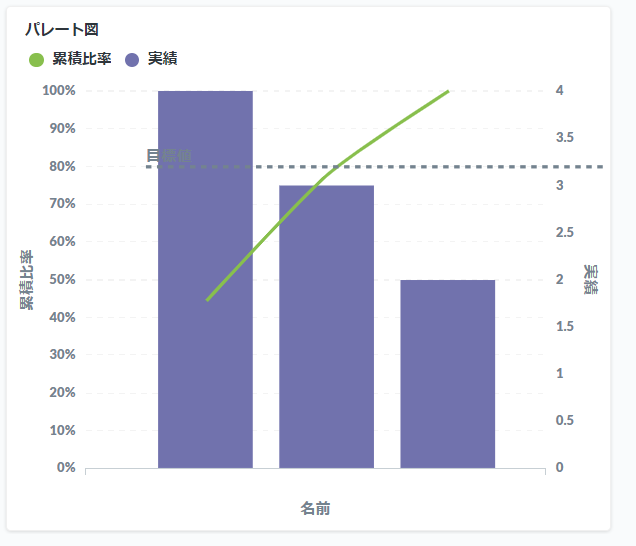
副問い合わせを用いたものは割とよくありますが、windows関数をつかってパレート図のデータを作る方法がみつからず、
ちょっと作ってみたときのメモです。
データが少ないのでもしかしたらうまくいかないケースがあるかもしれません ^^;
準備
sqlite に man_hour というテーブルを作成して、以下のデータを投入し、
metabaseから接続しておく。
名前, 実績
hoge,	2
hoge,	2
fuga,	3
test,	2
グラフの作成
質問内容(記述したSQL)
-- データの絞り込み and ソート
with dataitem as (
select
    sum(実績) as 実績,
    名前
from man_hour
group by
    -- グルーピングしておく
    名前
order by
    -- ここでグルーピングしたものを多い順に並べ替えておく
    sum(sum(実績)) over (partition by 名前) desc
)

-- グラフ用
select
    実績,
    -- 最初のデータから現在の行までを合計したものを、すべての合計で割る
    sum(実績) over (rows between unbounded preceding and current row) / sum(実績) over () as 累積比率,
    名前
from dataitem
グラフの設定(metabase)
- コンボを選択
- 「表示」の「累積比率」を展開し、どちらの軸で「左」を選択する。
- 「表示」の「実績」を展開し、どちらの軸で「右」を選択する。
- 「表示」の目標ラインをオンにして、目標値に「0.8」を記述する
- 「データ」の「累積比率」の歯車アイコンを押し、スタイルを「percent」にする
できたグラフ
グラフの左右の軸は反対にしたいが、metabaseの目標ライン機能を使いたかったので、
左側に累計比率をおいている(違和感があるが・・・)
そのほか
- 「目標ライン」の点線が、なぜかずれる(たぶんmetabaseのバグ)
