前回の続きです。
Problems 3 and 4
A very common task handled by GIS is to convert a list of coordinates into geographic objects. For instance, you might have a table with latitude and longitude values, and want to use the locations in a map. Python is an excellent tool for this kind of a task: it can read data from (almost) any input format (CSV, text, Excel, GPX, various databases).
In this exercise, we concentrate on reading data using pandas, and on creating geometry objects using shapely. Later on in the course, we will get to know other packages that are better tailored to geographic data, and will also learn how to write data to files, including to GIS file formats.
CSVなどから座標のリストを扱いやすい形(例えばPointとか)に変換することは多々あります。
Pandasを使って、実現します。
Sample data set
travel_times_2015_helsinki.txtをダウンロードして使用します。このファイルは以下の項目を";"で区切って格納しています。

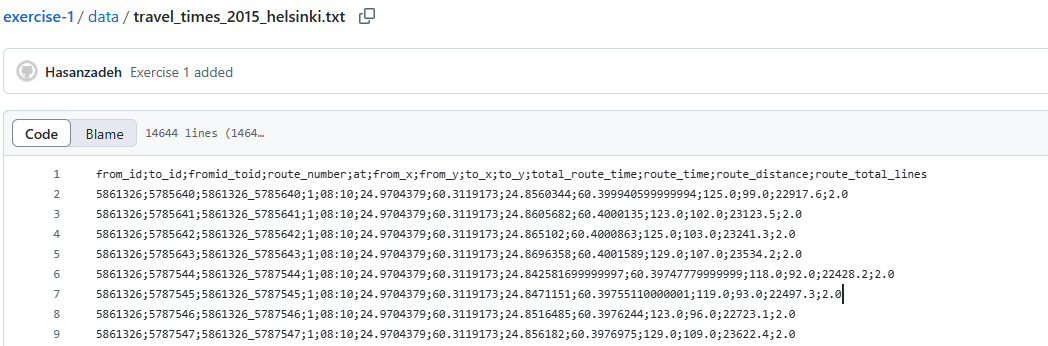
なお、どういうデータなのか把握していなくても、実習に支障はありません。
Problem 3: Reading coordinates from a text file, and creating geometries (5 points)
In this problem, your task is to read data from the file described above, and create two lists of points representing the origins and destinations of the routes described in the data set.
This task entails multiple steps:
- Read the data into a pandas.DataFrame
- Discard all unnecessary columns (this is good practice, as it helps reduce the memory footprint of a program)
- Create two lists of shapely.geometry.Points
ざっくりいうと、travel_times_2015_helsinki.txtをpandas.DataFrameとして読み取って、処理に必要な列だけ抜き取って、origin_points・destination_pointsというPointのリスト2つを作る、です。
早速作るわけですが、まずは、Google colabのカレントディレクトリにtravel_times_2015_helsinki.txtをアップロードする必要があります。
これは、ドラッグアンドドロップでできます。
https://qiita.com/kazoo04/items/a0bd374199a7783ca0ee#%E3%82%A2%E3%83%83%E3%83%97%E3%83%AD%E3%83%BC%E3%83%89
余談ですが、先頭に ! をつけるとシェルコマンドを実行できます。
https://qiita.com/kazoo04/items/a0bd374199a7783ca0ee#%E3%82%B7%E3%82%B9%E3%83%86%E3%83%A0%E3%82%B3%E3%83%9E%E3%83%B3%E3%83%89
カレントディレクトリは、/contentでした。
!pwd

(1)
First, use pandas to read the file into a variable data. You can revisit lesson 5 of the Geo-Python course and consult the pandas documentation to find the best way to do this.
ファイルを読み込み、先頭5件を表示します。
前述の通り、";"区切りのため、 sep=";"とする必要があります。
import pandas as pd

data = pd.read_csv("travel_times_2015_helsinki.txt", sep=";")

data.head()

読み込んだデータの行数・列数を見ます。

(2)
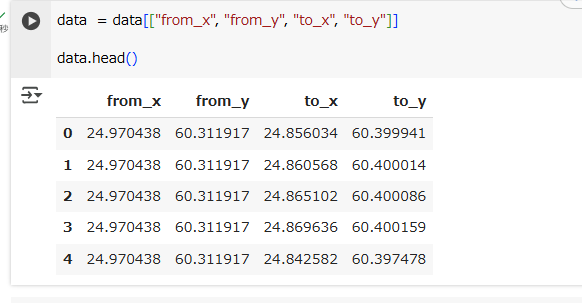
Now, select the 4 columns that contain coordinate information (from_x, from_y, to_x, to_y), and store them in a DataFrame data. (i.e. update the variable data to contain only these four columns).
必要な列だけにします。
data  = data[["from_x", "from_y", "to_x", "to_y"]]

data.head()
余談ですが、上記のコードの場合、列名の指定を間違えると、KeyErrorになります。
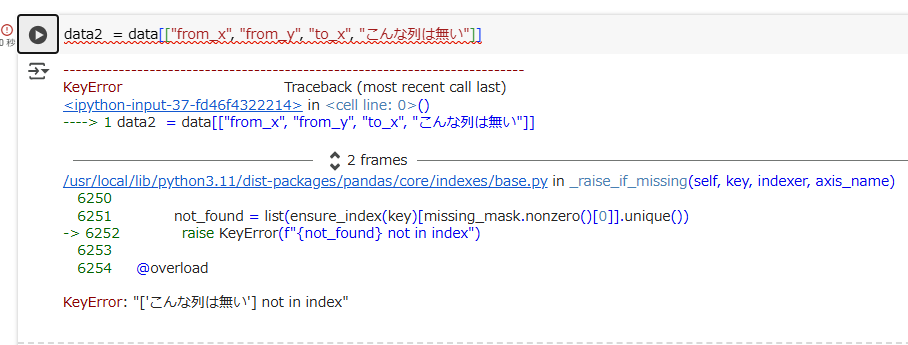
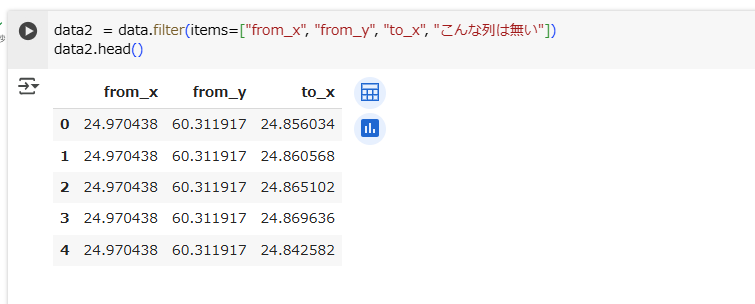
これが嫌な場合は、pandas.DataFrame.filterを使いましょう。
KeyErrorにならず、間違った列名は無視されるだけです。
(3)
Finally, create two lists called origin_points and destination_points that contain shapely.geometry.Point objects created using the coordinates from data.
In particular, the origin points in origin_points should be based on columns from_x and from_y, and the destination points in destination_points on columns to_x and to_y.
from_x・from_y列から、origin_pointsというPointのリストを作る
to_x・to_y列から、destination_pointsというPointのリストを作る
There are many ways to achieve this, find two possible approaches below (you can implement either one of them):
やり方はいろいろある。以下2種類、どっちでやってもよい。
Approach A
- Create two empty lists for the origin and destination points, respectively
- Use a for-loop to iterate over the rows of your dataframe:
- For each row, create a shapely.geometry.Point object based on the coordinate columns
- Append the point object to the origin_points and destination_point lists
You can consult lesson 6 of Geo-Python to revisit how to loop over the rows of a pandas.DataFrame.
Approach A forループで一行すつ処理する
Approach B (more advanced)
- Make use of the .apply() function of the pandas.DataFrame to operate on all rows at once (see its documentation, HINT: you might want to use the axis parameter)
- Use the shapely.geometry.Point constructor directly, or wrap it into a lambda function
- Finally, convert the output pandas.Series into lists
Approach B apply()と lambda関数で一気にやる(こちらのほうが先進的)
今回はApproach Bでやります。apply()の結果はpandas.Series型(雑に言うとpandasの一次配列)なので、to_list()でリストします。
from shapely.geometry import Point

origin_points = data.apply(lambda row: Point(row["from_x"], row["from_y"]), axis=1).to_list()
destination_points = data.apply(lambda row: Point(row["to_x"], row["to_y"]), axis=1).to_list()
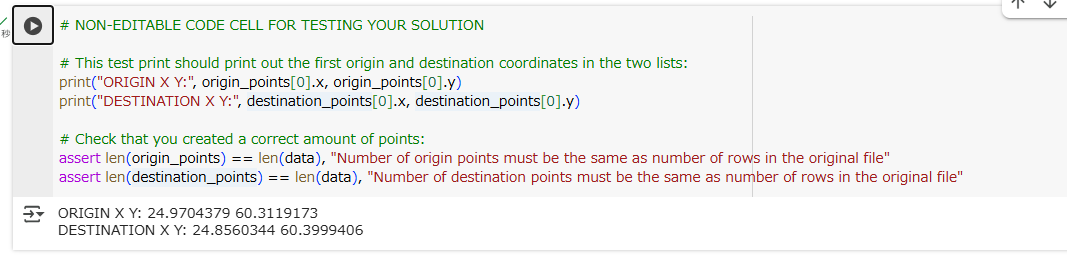
結果確認です。
Problems 4に続きます。