Point-in-polygon queries on geopandas.GeoDataFrames
In the following practical example we find which of the addresses we obtained in the geocoding section are located within a certain city district of Helsinki.
The data set we are using is from Helsinki Region Infoshare, and licensed under a Creative-Commons-Attribution-4.0 license.
geocodingセクションで取得した住所情報のうち、ヘルシンキのとある地域の住所のみを取り出してみましょう。
ヘルシンキのデータセットは、以下から取得したものです。
https://hri.fi/data/en_GB/dataset/helsingin-piirijako
ライセンスはこちらに属します。
https://creativecommons.org/licenses/by/4.0/
ファイルはここにあります。
ファイルのパスを指定します。
import pathlib
NOTEBOOK_PATH = pathlib.Path().resolve()
DATA_DIRECTORY = NOTEBOOK_PATH / "data"
ファイルを読み込みます。
import geopandas

city_districts = geopandas.read_file(
    DATA_DIRECTORY / "helsinki_city_districts" / "helsinki_city_districts_2021.gpkg"
)
city_districts.head()
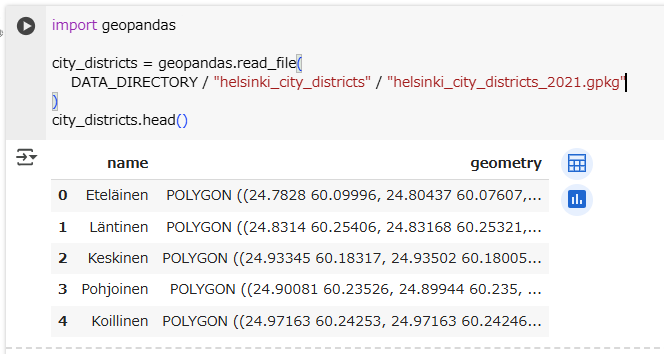
読み込んだデータを表示します。
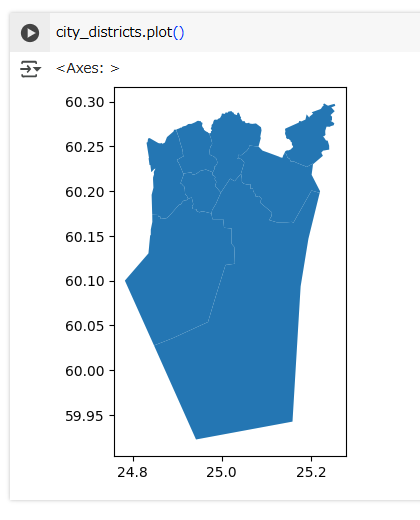
Specifically, we want to find out which points are within the ‘Eteläinen’ (‘southern’) city district. Let’s start by obtaining a separate data set for this district, loading the addresses data, and plotting a multi-layer map that shows all districts, the ‘Eteläinen’ district, and all the points in one map:
どの住所の点がHelsinkiのEteläinen(フィンランド語で「南部」らしいです)地区に含まれるかを調べます。
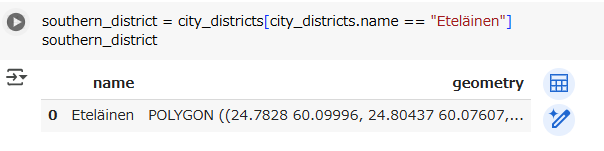
まずはこの地域だけを切り出します。
southern_district = city_districts[city_districts.name == "Eteläinen"]
southern_district
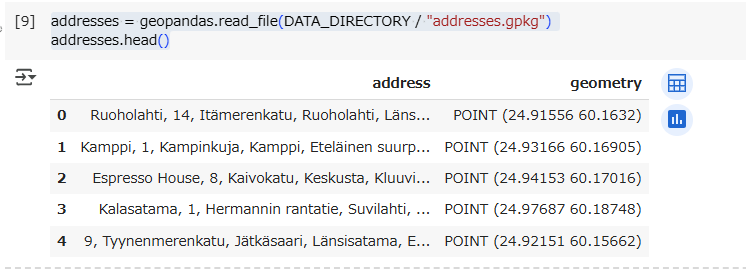
次に住所情報をファイルから読み込みます。
ファイルは、こちらで作成したものです。

addresses = geopandas.read_file(DATA_DIRECTORY / "addresses.gpkg")
addresses.head()
そして、複数レイヤー地図をプロットをします。一つのレイヤーは全地区、もう一つのレイヤーはEteläinen地区のみです。
Hint: Plotting multiple map layers
To plot several map layers in one figure, use the ax parameter to specify in which axes data should be plotted. This was used in lesson 7 of Geo-Python to add text to a plot or modify axes properties.
The easiest way to obtain an axes is to save the return value of the first plot() (see below). Another option is to create subplots(), possibly with only one row and one column.
いくつかの地図レイヤーを一つのfigure(これは適切な日本語が思い浮かびませんでした)にプロットする場合、
axパラメータを使います。これはどのaxes(軸)でデータをプロットするかを指定するものです。
もっとも手早い方法は、以下のように、最初のplot()関数の戻り値を使うことです。
他には、matplotlib.pyplot.subplotsも使えます。
axes = city_districts.plot(facecolor="grey")
southern_district.plot(ax=axes, facecolor="red")
addresses.plot(ax=axes, color="blue", markersize=5)
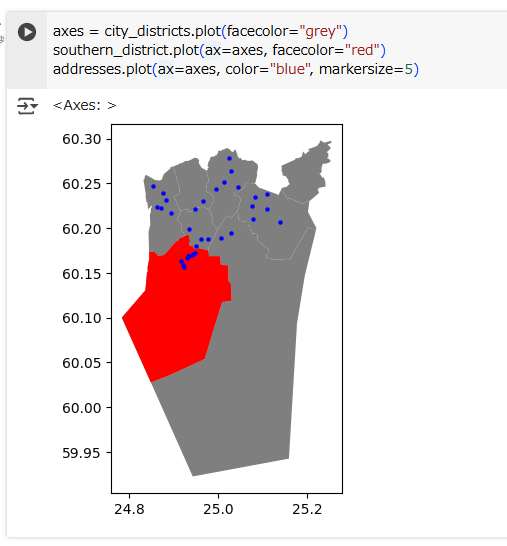
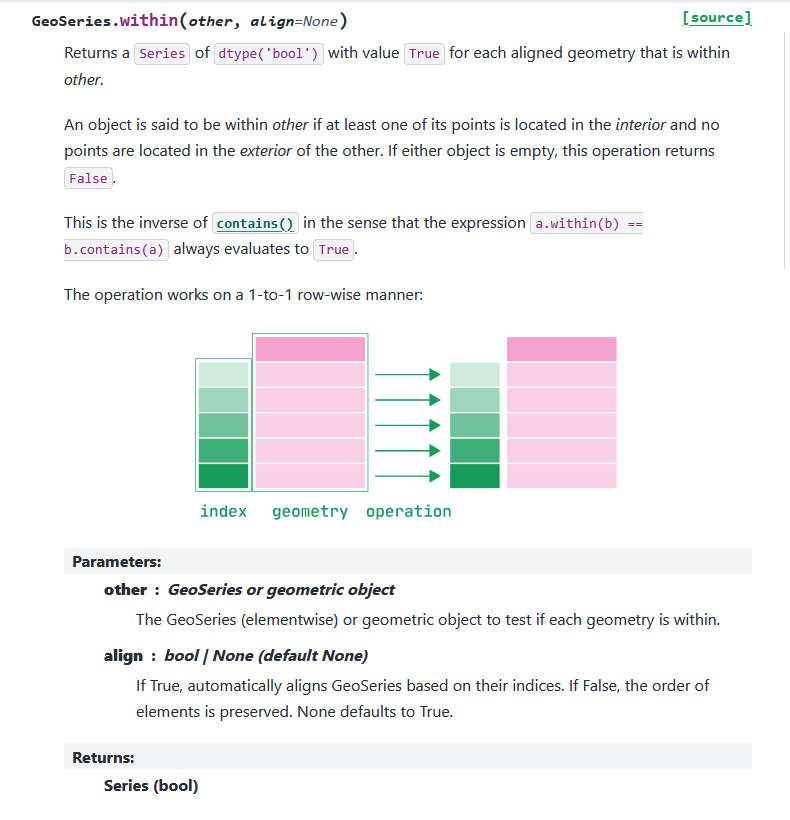
Some points are within the ‘Eteläinen’ district, but others are not. To find out which are the ones inside the district, we can use a point-in-polygon query, this time on the entire geopandas.GeoDataFrame. Its method within() returns Boolean (True/False) values that indicate whether or not a row’s geometry is contained in the supplied other geometry:
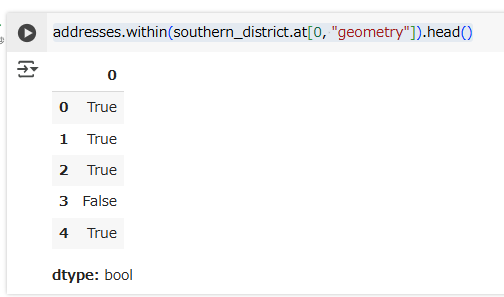
いくつかの点がEteläinen地区の内側にあります。が、そうでない点もあります。内側の点だけを検出するために、point-in-polygonクエリを使います。今回はgeopandas.GeoDataFrame上、つまり複数行の地図データセット上でpoint-in-polygonクエリをします。within() メソッドの戻り値はbool型です。
仮に、geopandas.GeoDataFrame1行目のgeometry(今回は住所の点)が対象となるgeometry(今回はEteläinen地区のポリゴン)に含まれているとすると、その行の結果はTrueとなります。
(行数が多いので、最初の5行に絞っています)
addresses.within(southern_district.at[0, "geometry"]).head()
Geometry vs. geometry column
In the example below, we use southern.at[0, "geometry"] to obtain a single value, a shapely.geometry.Polygon, instead of an entire column (a GeoSeries). This ensures that each row’s geometry in the addresses data frame is matched against the same polygon. In contrast, if we ran within() against a column, the operation would be carried out row-wise: the first address point would be checked against the first polygon, the second address point against the second polygon, and so forth.
Check the documentation for ``within()
<https://geopandas.org/en/stable/docs/reference/api/geopandas.GeoSeries.within.html>__ to learn more!
以下の例では、southern.at[0, "geometry"]と、列そのもの(GeoSeries型)ではなく、一つのshapely.geometry.Polygon型の値に対して、within()しています。
addresses.within(southern_district.at[0, "geometry"])
これにより、addressesの各々の行のgeometryに単一のポリゴンを突き合わせることができます。
(余談ですが、atは、局所的な場所を指すときに使う前置詞です。)
一方、列そのもの(GeoSeries型)に対して、within()すると、行ごとに実行されます。addressesの1行目のgeometryとsouthernの1行目のgeometry、addressesの2行目のgeometryとsouthernの2行目のgeometry、ということになります。
addresses.within(southern.geometry)
詳細はこちら
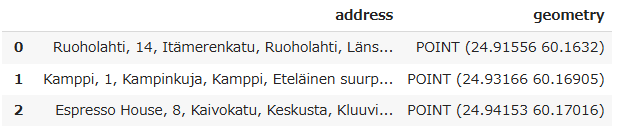
This list of Boolean values, also called a mask array can be used to filter the input data frame:
このリストは、bool型の値のリストです。マスク配列とも呼ばれ、データフレームの行フィルタとして使うことができます。
addresses_in_the_southern_district = addresses[
    addresses.within(southern_district.at[0, "geometry"])
]
addresses_in_the_southern_district
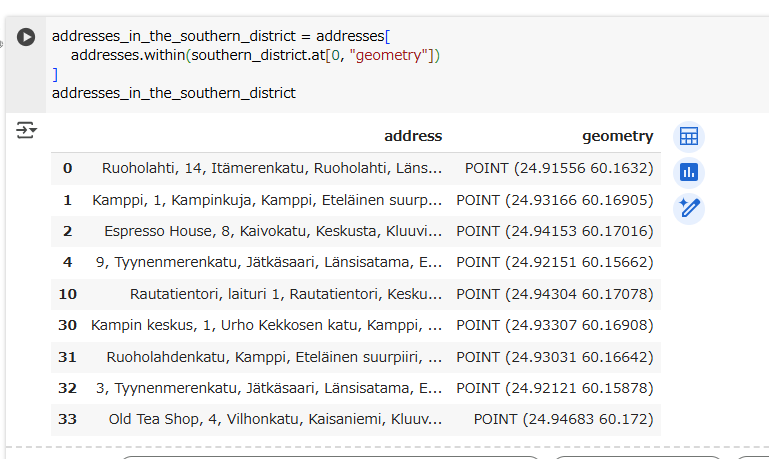
マスク配列addresses.within(southern_district.at[0, "geometry"]) の1・2・3行目はTrueでした。
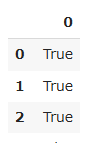
なので、1・2・3行目(インデックスは0・1・2)はフィルター後も出力されます。
Finally, let’s plot this list of addresses one more time to visually verify that all of them, indeed, are located within the ‘Eteläinen’ city district:
最後に、住所情報のリストをもう一度プロットします。今後は、‘Eteläinen’地区の中にあるものだけに限定されます。
axes = city_districts.plot(facecolor="grey")
southern_district.plot(ax=axes, facecolor="red")

addresses_in_the_southern_district.plot(
    ax=axes,
    color="gold",
    markersize=5
)
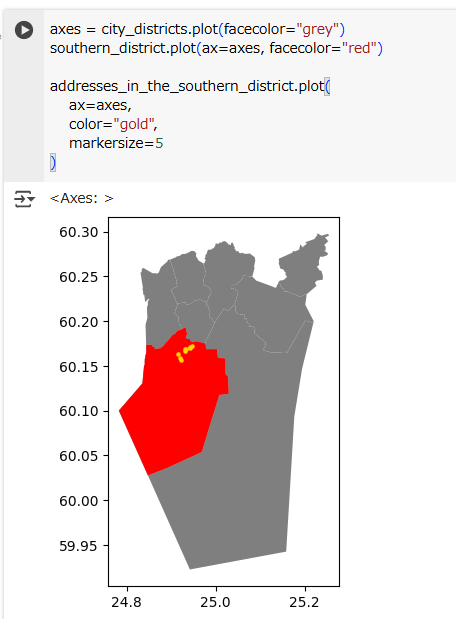
Perfect! Now we are left with only the (golden) points which, indeed, are inside the red polygon. That’s exactly what we wanted!
黄金色の点だけが残りました。これは、赤色のポリゴンの(’Eteläinen’地区)の中にあるものだけに限定されます。狙い通りです。