はじめに
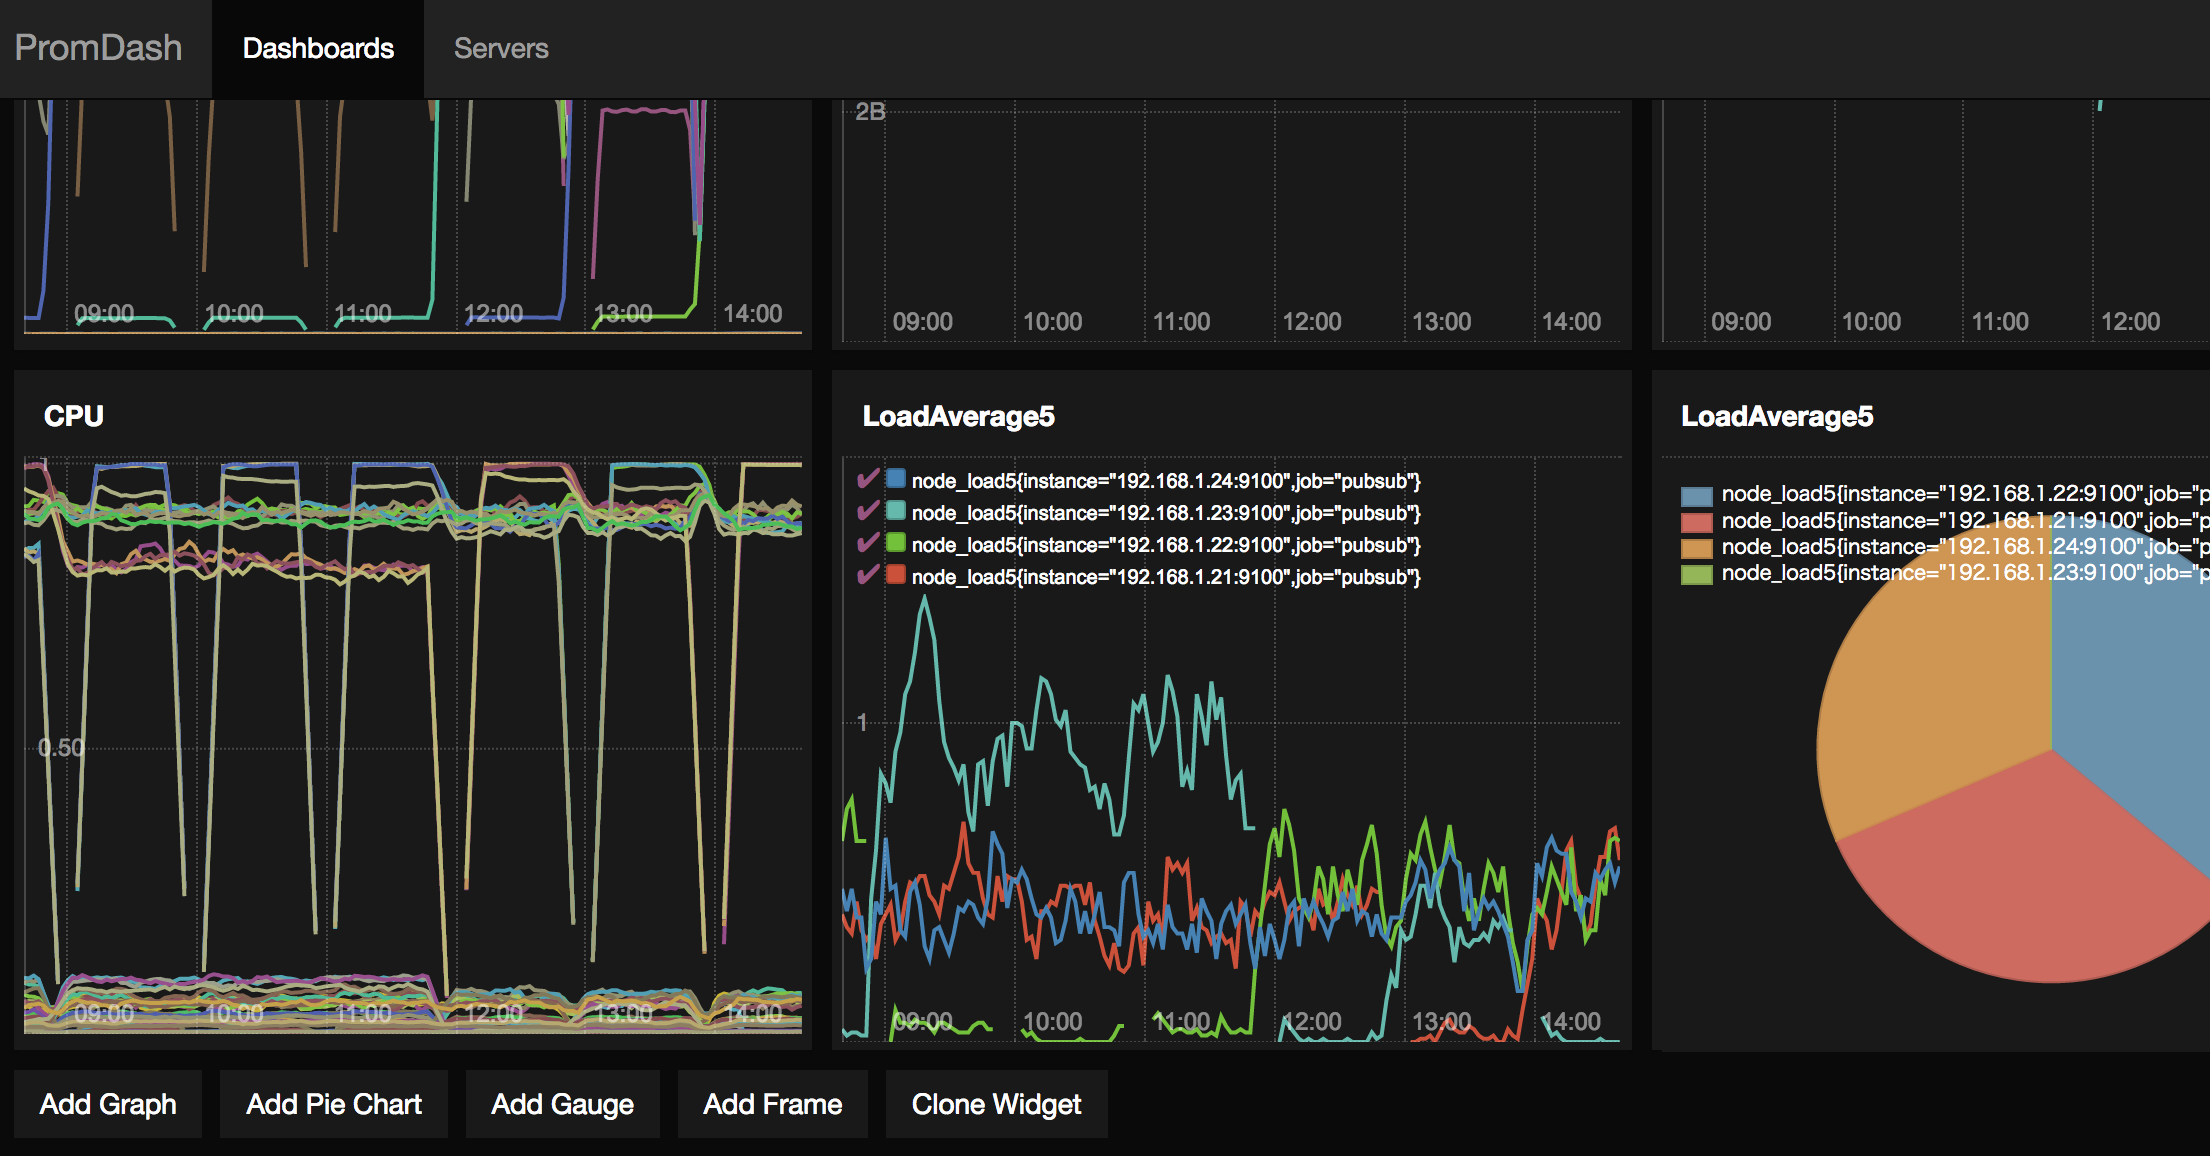
PrometheusとPromDashを使って、こんな感じのサーバ監視のためのダッシュボードを表示します。
- さくらのクラウド(プラン/1Core-1GB)
- Ubuntu 16.04
192.168.x.12: PrometheusとPromDash
192.168.x.31-33: 監視対象のサーバ

Prometheusのinstallと起動
$ wget https://github.com/prometheus/prometheus/releases/download/v1.5.2/prometheus-1.5.2.linux-amd64.tar.gz
$ tar xzvf prometheus-1.5.2.linux-amd64.tar.gz
$ mv prometheus-1.5.2.linux-amd64 prometheus
$ vi prometheus.yml
$ nohup ./prometheus > prometheus.log 2>&1 &
prometheus.ymlの中身
# global config
global:
  scrape_interval:     30s #node_exporterなどに問い合わせる頻度
  evaluation_interval: 30s

  external_labels:
      monitor: 'codelab-monitor'

# Load rules once and periodically evaluate them according to the global 'evaluation_interval'.
rule_files:
  # - "first.rules"
  # - "second.rules"

# A scrape configuration containing exactly one endpoint to scrape:
# Here it's Prometheus itself.
scrape_configs:
  # The job name is added as a label `job=<job_name>` to any timeseries scraped from this config.
  - job_name: 'server'

    # metrics_path defaults to '/metrics'
    # scheme defaults to 'http'.

    static_configs:
      - targets: ['192.168.x.31:9100','192.168.x.32:9100','192.168.x.33:9100']
node_exporterのインストール
監視対象のサーバにnode_exporterをインストールします。
$ wget https://github.com/prometheus/node_exporter/releases/download/v0.14.0/node_exporter-0.14.0.linux-amd64.tar.gz
$ tar -xzvf node_exporter-0.14.0.linux-amd64.tar.gz
$ sudo ln -s ~/node_exporter/node_exporter-0.14.0.linux-amd64/node_exporter /usr/bin/
service node_exporter startで起動できるように、/etc/systemd/system/node_exporter.serviceに以下を記述。
こちらのGistを参考にしました。
[Unit]
Description=Prometheus node exporter
After=local-fs.target network-online.target network.target
Wants=local-fs.target network-online.target network.target

[Service]
ExecStart=/usr/bin/node_exporter
Type=simple

[Install]
WantedBy=multi-user.target
$sudo systemctl list-unit-files
$sudo systemctl enable node_exporter.service
$sudo service node_exporter start
PromDashのインストール
Prometheus用のダッシュボードである、PromDashをインストールします。
$sudo apt-get install sqlite3 libsqlite3-dev
$sudo apt-get install apt-transport-https ca-certificates
$sudo docker run -p 3000:3000 -v /tmp/prom:/tmp/prom -e DATABASE_URL=sqlite3:/tmp/prom/file.sqlite3 -d prom/promdash
ベーシック認証をかける
全体にベーシック認証をかけます。
nginxをインストール。
$sudo apt-get install nginx
.htpasswdファイルを作成。
$htpasswd -c .htpasswd user
/etc/nginx/site-available/prometheusに以下のnginx用の設定を記述。example.comのところは自分のサーバのDNSを設定します。Prometheu用は/api/をルーティングして、PromDashはルートから振り分けます。
server {
    server_name example.com
    listen 0.0.0.0:80;
    location / {
      proxy_pass http://localhost:3000/;

      auth_basic "Prometheus";
      auth_basic_user_file ".htpasswd";
      proxy_set_header    X-Host       $host;
    }
    location /api/ {
      proxy_pass http://localhost:9090/api/;

      auth_basic "Prometheus";
      auth_basic_user_file ".htpasswd";
      proxy_set_header    X-Host       $host;
    }

}
$sudo ln -s /etc/nginx/sites-available/prometheus /etc/nginx/sites-enabled/prometheus
$sudo service nginx restart
VPCなどで192.168.x.12にアクセスするとダッシュボードが表示されます。
PromDashでの設定
Add Server

Graph追加
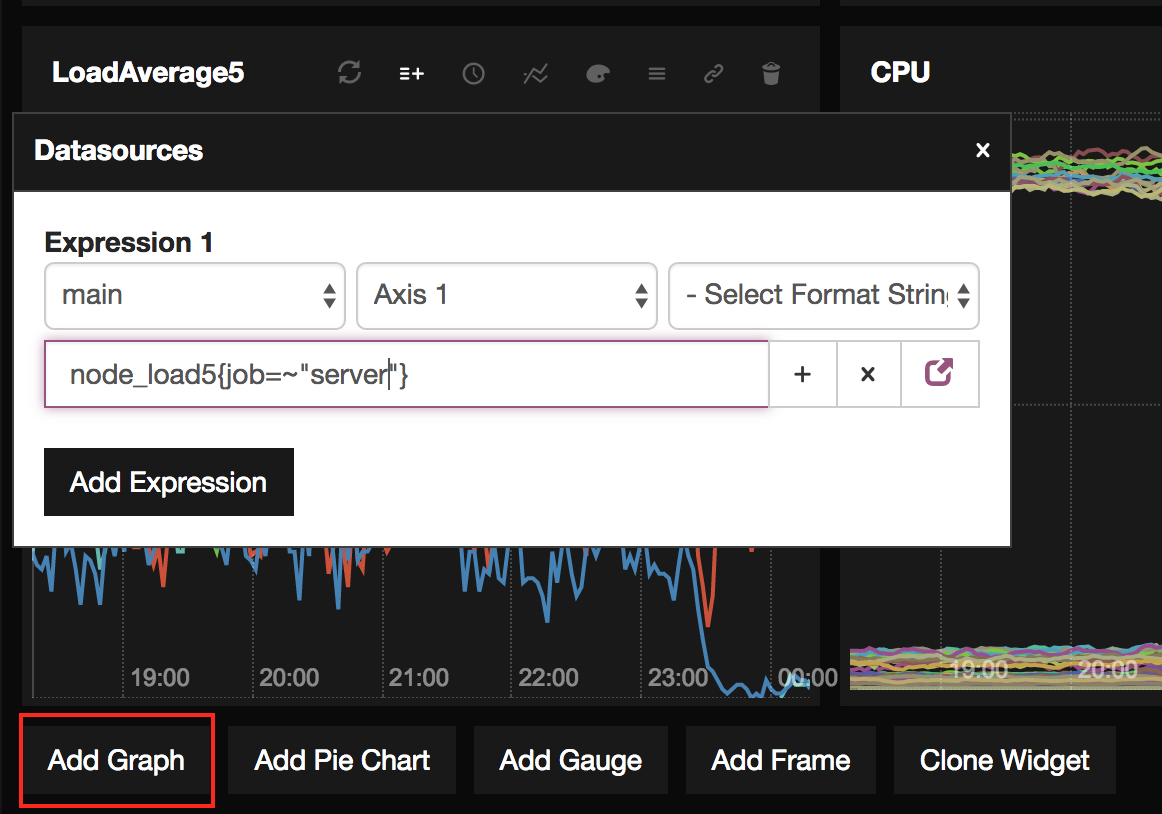
Prometheusのクエリ
- ロードアベレージ:
node_load1{job=~"server"} - ネットワーク受信
rate(node_network_receive_bytes{job=~"server"}[5m]) - ネットワーク送信
rate(node_network_transmit_bytes{job=~"server"}[5m]) - ファイルディスクリプタ
node_filefd_allocated{job=~"server"} - メモリ関連
node_memory_MemFree{job=~"server"} - ディスクRead
rate(node_disk_reads_completed{job=~"server"}[5m]) - ディスクWrite
rate(node_disk_write_completed{job=~"server"}[5m])
最後に
これでサーバをお手軽監視できます。node_exporter以外に、例えばjmx_exporterというのもあって、cassandraなどのJavaで動くミドルウェアのメトリクスも表示できます。
参考
node_exporter:https://github.com/prometheus/node_exporter
serviceの設定:https://gist.github.com/deviantony/2a2141ea32c1f601467e39d3a093d6ec
PromDash: https://github.com/prometheus-junkyard/promdash
Prometheusのクエリ:https://prometheus.io/docs/querying/basics/
ベーシック認証をPrometheusとPromDashにかける:https://github.com/prometheus-junkyard/promdash/issues/341