はじめに
-
2019年警察庁交通事故統計データがオープンデータとして公開されましたので、deck.glのScatterplotLayerとHeatmapLayerを用いて可視化してみました。
-
交通事故統計データは以下の警察庁のHPよりcsvファイルがダウンロードできます。
※本記事では、事故発生地点の座標(緯度、経度)を10進数に変換したデータを用いています。
https://www.npa.go.jp/publications/statistics/koutsuu/opendata/2019/opendata_2019.html -
背景地図にはMapboxを使用しているため、Mapboxにてアクセストークンの取得が必要になります。
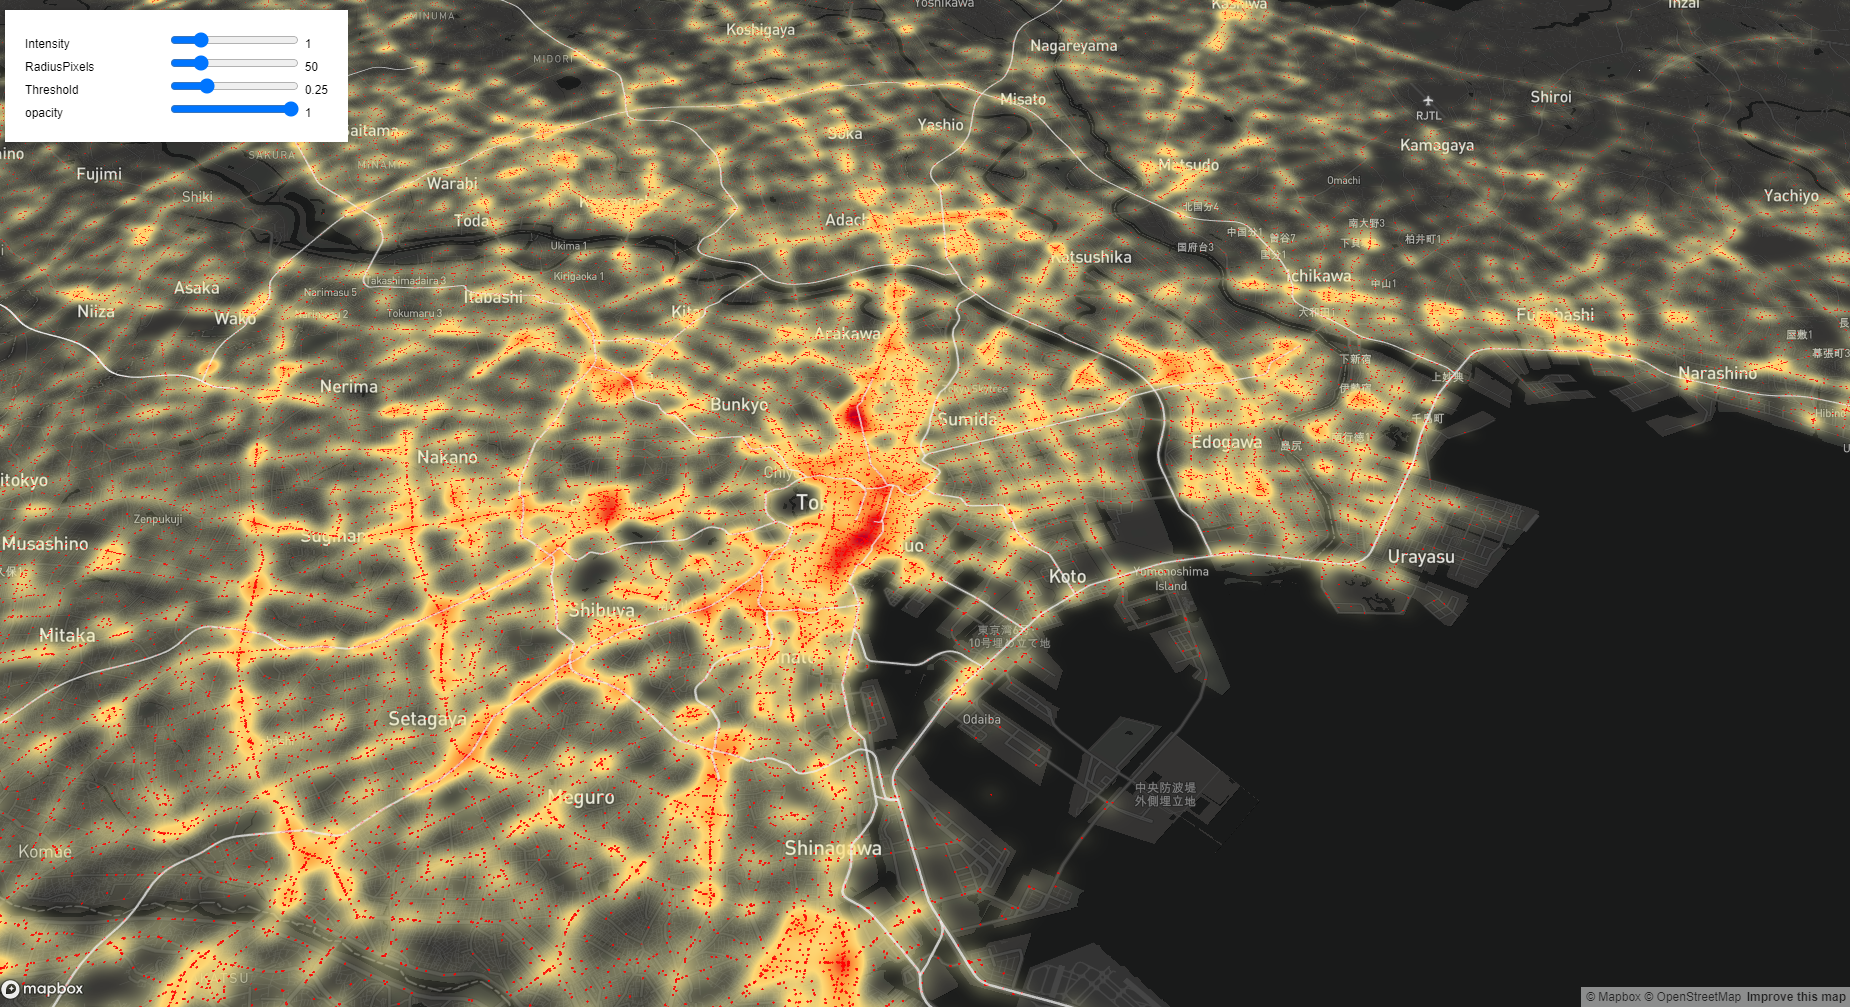
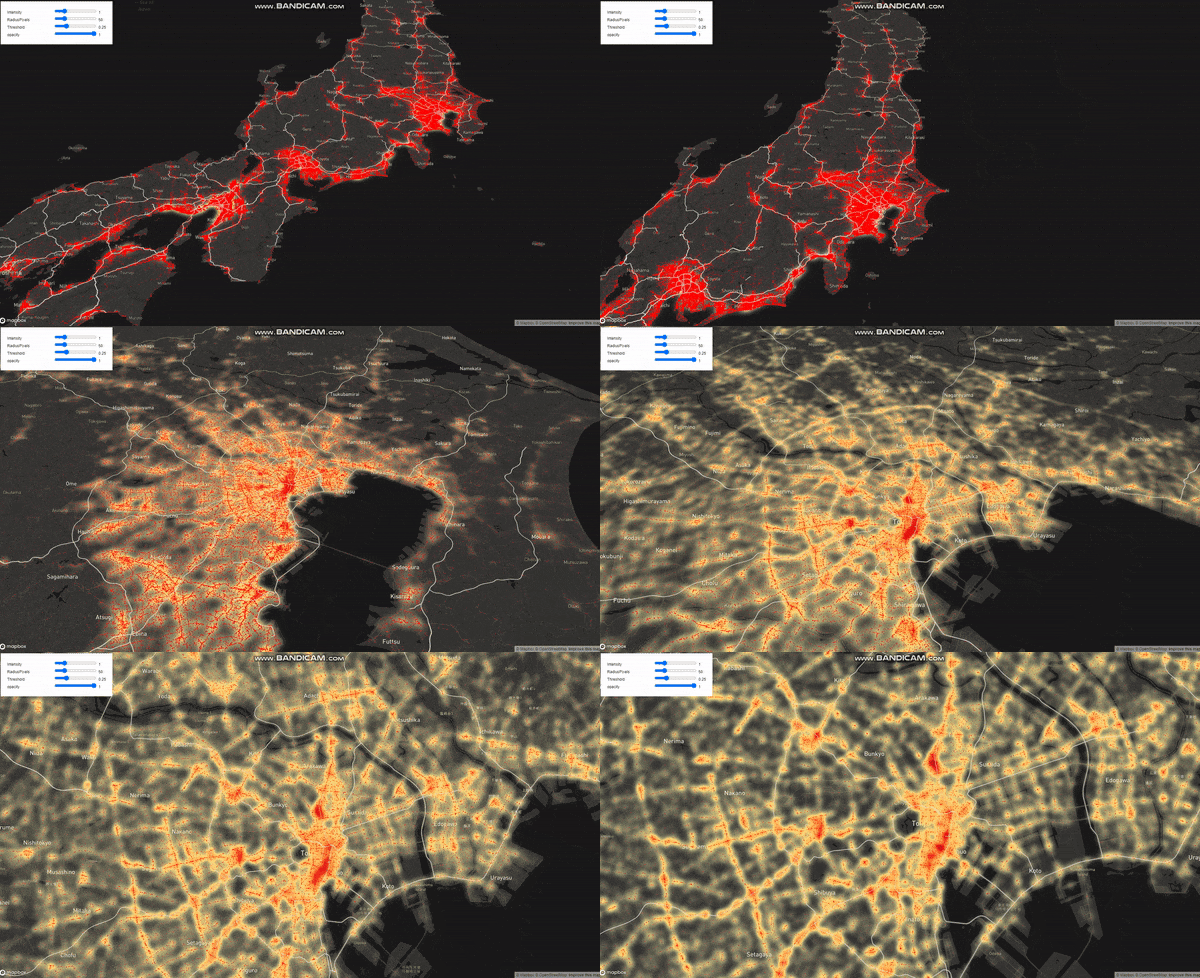
アウトプットイメージ
※「交通事故統計情報のオープンデータ」(警察庁)
(https://www.npa.go.jp/publications/statistics/koutsuu/opendata/2019/opendata_2019.html) を加工して作成
前提条件
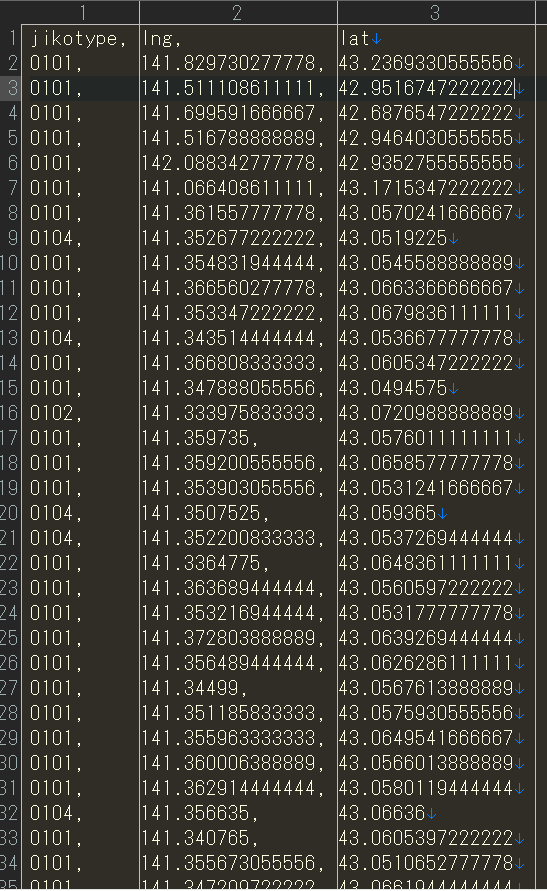
- 交通事故統計データは以下のデータ形式(csvファイル)とします。

- 高速道路のラインデータは国土数値情報からダウンロードし、QGISでgeojsonファイルに変換したデータになります。
- なお、交通事故統計データや高速道路のラインデータはWebサーバ上に保存されていることが前提です。
html
<html>
  <head>
    <title>2019年警察庁事故データ(全事故)</title>
    <meta charset="UTF-8">
    <script src="https://unpkg.com/deck.gl@^7.0.0/dist.min.js"></script>
    <script src="https://d3js.org/d3.v5.min.js"></script>
    <script src="https://api.tiles.mapbox.com/mapbox-gl-js/v0.50.0/mapbox-gl.js"></script>
    <link rel="stylesheet" href="style.css"/>
  </head>
  <body>
    <div id="control-panel">
      <div>
        <label>Intensity</label>
        <input id="intensity" type="range" min="0" max="5" step="0.1" value="1"></input>
        <span id="intensity-value"></span>
      </div>
      <div>
        <label>RadiusPixels</label>
        <input id="radiusPixels" type="range" min="1" max="250" step="1" value="50"></input>
        <span id="radiusPixels-value"></span>
      </div>
      <div>
        <label>Threshold</label>
        <input id="threshold" type="range" min="0" max="1" step="0.01" value="0.25"></input>
        <span id="threshold-value"></span>
      </div>
      <div>
        <label>opacity</label>
        <input id="opacity" type="range" min="0" max="1" step="0.01" value="1"></input>
        <span id="opacity-value"></span>
      </div>
    </div>
    <script  src="script.js"></script>
  </body>
</html>
CSS
html,body {
  font-family: Helvetica, Arial, sans-serif;
  width: 100vw;
  height: 100vh;
  margin: 0;
}
.deck-tooltip {
  font-family: Helvetica, Arial, sans-serif;
  padding: 6px !important;
  margin: 8px;
  color: #ffffff;
  background-color: #4682b4;
  max-width: 300px;
  font-size: 20px;
}

# control-panel {
  position: absolute;
  top: 0;
  left: 0;
  margin: 12px;
  padding: 20px;
  font-size: 12px;
  line-height: 1.5;
  z-index: 1;
  background: #fff;
  font-family: Helvetica, Arial, sans-serif;
  box-shadow: 0 0 4px rgba(0, 0, 0, 0.15);
}
JavaScript
- mapboxApiAccessTokenには、取得したアクセストークンを入力してください。
- honhyo_2019_all_utf-8.csvが交通事故統計データになります。
- N06-19_HighwaySection.geojsonが高速道路のラインデータになります。
const deckgl = new deck.DeckGL({
  mapboxApiAccessToken: 'アクセストークンを入力してください',
  mapStyle: 'mapbox://styles/mapbox/dark-v9',
  initialViewState: {
    latitude: 35.1801494,
    longitude: 136.9034925,
    zoom: 7,
    maxZoom: 16,
    pitch: 45,
    bearing: 15
  },
  controller: true,
  });

const OPTIONS = ['intensity', 'radiusPixels', 'threshold', 'opacity'];

const colorRange  = [
  [0, 255, 255, 127],
  [63, 255, 0, 127],
  [255, 255, 0, 127],
  [255, 127, 60, 170],
  [255, 0, 0, 212],
  [152, 0, 38, 255]
];

const getValue=(d) =>{
        return Number(d.jiko);
};

const jiko = d3.csv('data/honhyo_2019_all_utf-8.csv');
const highway = d3.json('data/N06-19_HighwaySection.geojson');

const renderLayer = () => {
    const options = {};
    OPTIONS.forEach(key => {
      const value = document.getElementById(key).value;
      document.getElementById(key + '-value').innerHTML = value;
      options[key] = Number(value);
    });

    const geoJsonLayer = new deck.GeoJsonLayer({
      id: 'geojson',
      data: highway,
      stroked: false,
      filled: false,
      lineWidthMinPixels: 2,
      parameters: {
        depthTest: false
      },
      opacity: 0.5,
      getLineColor: [240,240,240],
      getLineWidth: 2,

      pickable: false,
    });

    const heatmapLayer = new HeatmapLayer({
      data: jiko,
      id: 'heatmp-layer',
      pickable: false,
      getPosition: d => [Number(d.lng), Number(d.lat)],
      getWeight: 1,
      radiusPixels: 30,
      intensity: 2.5,
      threshold: 0.1,
      opacity: 0.3,
      ...options
    });

    const scatterplotLayer = new ScatterplotLayer({
      id: 'scatter-plot',
      data: jiko,
      radiusUnits: 'meters',
      lineWidthUnits: 'meters',
      radiusScale: 0.75,
      lineWidthScale: 1,
      stroked: false,
      filled: true,
      radiusMinPixels: 1,
      getPosition: d => [Number(d.lng), Number(d.lat)],
      getColor: d => [255, 0, 0]
    });

 deckgl.setProps({
  layers:[heatmapLayer, scatterplotLayer, geoJsonLayer]
});

}

renderLayer();

OPTIONS.forEach(key => {
  document.getElementById(key).oninput = renderLayer;
});
参考文献
https://deck.gl/docs/api-reference/layers/scatterplot-layer
https://deck.gl/docs/api-reference/aggregation-layers/heatmap-layer
https://deck.gl/gallery/
https://github.com/visgl/deck.gl
https://deckgl.readthedocs.io/en/latest/index.html

